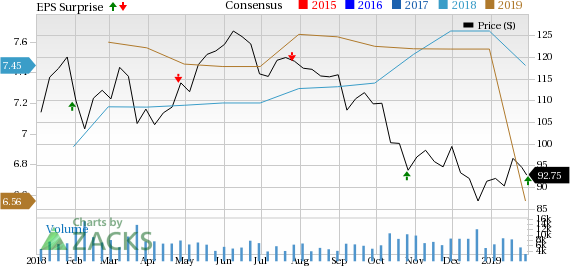
T. Rowe Price Group (NASDAQ:TROW) reported fourth-quarter 2018 adjusted earnings per share of $1.54, up 1.3% from the year-ago figure of $1.52. The Zacks Consensus Estimate was pegged at $1.68.
Results were driven by higher revenues. Moreover, the company’s strong liquidity position was a key tailwind. However, escalating expenses and lower assets under management (AUM) posed key concerns.
Including certain non-recurring items, net income came in at $351.9 million or $1.41 per share compared with $347.1 million or $1.37 per share recorded a year ago.
For full-year 2018, the company reported GAAP net income of $1.84 billion or $7.27 per share, up from $1.36 million or $5.97 per share.
Revenues Improve, Expenses Flare Up
Net revenues rose nearly 1% to $1.31 billion from the year-ago quarter. The rise primarily stemmed from higher investment advisory fees that grew 2.2% year over year to $1.18 billion. However, the net revenue figure lagged the Zacks Consensus Estimate of $1.32 billion.
For full-year 2018, the company reported net revenues of $5.37 billion, up 10.7% on a year-over-year basis. However, the figure lagged the Zacks Consensus Estimate of $5.40 billion.
Administrative, distribution and servicing fees declined 13% year over year to $121.3 million.
Investment advisory revenues earned from the T. Rowe Price mutual funds, distributed in the United States, were down slightly year over year to $817.9 million. However, Investment advisory revenues earned from other investment portfolios, managed by the company, rose 8.2% to $365.8 million.
Total adjusted operating expenses flared up 4.7% year over year to $794.7 million in the fourth quarter. Rise in almost all components of expenses resulted in this upsurge. Including certain one-time items, expenses were up slightly to $762.7 million.
Strong Assets Position
As of Dec 31, 2018, total AUM declined 2.9% year over year to $962.3 billion. During the fourth quarter, net market depreciation and income came in at $110.8 billion while net cash outflow was $8.4 billion after client transfers.
T. Rowe Price remains debt free with substantial liquidity, including cash and sponsored portfolio investment holdings of about $4.5 billion as of Dec 31, 2018. This enables it to keep on investing.
Capital-Deployment Activity
During fourth-quarter 2018, T. Rowe Price repurchased 5.5 million shares of its common stock for $534.8 million and invested $168.5 million in the year in capitalized technology and facilities using available cash balances.
For 2019, the company projects capital expenditures to be approximately $200 million, comprising 65% for technology development.
Our Viewpoint
T. Rowe Price’s financial stability has the potential to benefit from growth opportunities in domestic and global AUM. The company’s debt-free position, higher return on earnings and improvement in investor sentiment, as a whole, make us confident of its robust prospects. Furthermore, a relatively better mutual fund performance is a positive.
T. Rowe Price Group, Inc. Price, Consensus and EPS Surprise
Currently, T. Rowe Price carries a Zacks Rank #3 (Hold). You can see the complete list of today’s Zacks #1 Rank (Strong Buy) stocks here.
Performance of Other Investment Managers
Cohen & Steers’ (NYSE:CNS) fourth-quarter 2018 adjusted earnings came in at 56 cents per share, missing the Zacks Consensus Estimate of 60 cents. However, the bottom line was 1.8% higher than the year-ago quarter figure.
TD Ameritrade Holding Corp. (NASDAQ:AMTD) delivered a positive earnings surprise of 11% in first-quarter fiscal 2019 (ending Dec 31, 2018). The company reported earnings of $1.11 per share, beating the Zacks Consensus Estimate of $1.00. Moreover, the figure jumped 39% from the prior-year quarter.
Federated Investors, Inc. (NYSE:FII) delivered a positive earnings surprise of 1.7% in fourth-quarter 2018. Earnings per share of 61 cents surpassed the Zacks Consensus Estimate of 60 cents. However, the figure compares unfavorably with the prior-year quarter earnings of $1.31.
Zacks' Top 10 Stocks for 2019
In addition to the stocks discussed above, wouldn't you like to know about our 10 finest buy-and-holds for the year?
From more than 4,000 companies covered by the Zacks Rank, these 10 were picked by a process that consistently beats the market. Even during 2018 while the market dropped -5.2%, our Top 10s were up well into double-digits. And during bullish 2012 – 2017, they soared far above the market's +126.3%, reaching +181.9%.
This year, the portfolio features a player that thrives on volatility, an AI comer, and a dynamic tech company that helps doctors deliver better patient outcomes at lower costs.
See Stocks Today >>
TD Ameritrade Holding Corporation (AMTD): Free Stock Analysis Report
Federated Investors, Inc. (FII): Free Stock Analysis Report
Cohen & Steers Inc (CNS): Free Stock Analysis Report
T. Rowe Price Group, Inc. (TROW): Get Free Report
Original post
Zacks Investment Research

