
Sysco Corporation (NYSE:SYY) reported second-quarter fiscal 2018 results, wherein both top and bottom lines grew year over year and surpassed the Zacks Consensus Estimate. Notably, this marked Sysco’s third straight quarter of earnings and sales beat. Sysco’s impressive past record has also helped this Zacks Rank #2 (Buy) company jump 22.6% in a year, as against the industry’s decline of 1.5%.

Quarter in Detail
Adjusted earnings of 66 cents per share jumped 13.8% year over year. Including a one-time benefit associated with the recent tax reforms, adjusted earnings increased 34.5% to 78 cents per share. The Zacks Consensus Estimate stood at 65 cents.
Sysco Corporation Price, Consensus and EPS Surprise
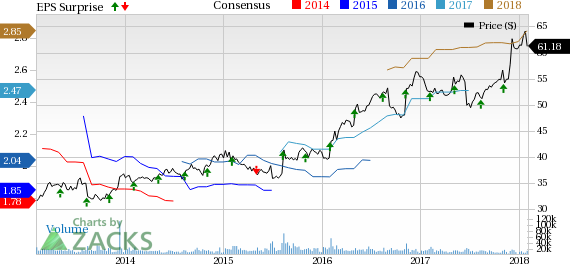
Sysco Corporation Price, Consensus and EPS Surprise | Sysco Corporation Quote
On a GAAP basis, earnings came in at 54 cents a share, up 8% year over year.
This global food products maker and distributor’s sales of $14,411.5 million exceeded the Zacks Consensus Estimate of $14,186 million and advanced 7.1% on a year-over-year basis.
Gross profit improved 5% to $2,699.4 million in the quarter, while gross margin contracted 38 basis points (bps) to 18.7%. Adjusted operating income rose 3.9% to $579.5 million, while the adjusted operating margin improved nearly 10 bps to 4%.
Segment Details
The company reports through these operating segments: U.S. Foodservice Operations and International Foodservice Operations.
U.S. Foodservice Operations
Segment sales advanced 6.6% to $9,681.2 million, where local case volume within U.S. Broadline operations climbed 4.8% and total case volume ascended 3.5%. Gross profit expanded 5.1% to $1,915.5 million, while the gross margin contracted 28 bps to 19.79%. This could be accountable to food cost inflation in U.S. Broadline, particularly in produce, dairy and meat categories.
Operating expenses escalated 5.9% on account of higher selling and transport costs. Nonetheless, the operating income jumped 3.7% to $706 million.
International Foodservice Operations
Segment sales increased 9.3% to roughly $2,869 million. Adjusted operating income tanked 28.8% to $79 million. While results in Canada gained strength from surge in local cases and efficient expense management, the company’s European business remained difficult. This stemmed from the amendment from calendar to fiscal year, which weighed on costs and gross profit. Also, the company incurred higher costs in Europe due to constant investments in transformation endeavors, which in turn place the company well for the long term. Also, results from Ireland and France remained were relatively better.
Other Financial Updates
Sysco ended the quarter with cash and cash equivalents of $961.1 million, long-term debt of $8,312.5 million and total shareholders’ equity of $2,268.6 million.
During the first half, the company generated cash flow from operations of $933.2 million and incurred net capital expenditure of $255 million. The company’s total free cash flow for the first half of fiscal 2018 amounted to $679 million, marking a considerably improvement from the year-ago period.
Outlook
Management remains pleased with its performance which was backed by solid sales and robust growth in local case volumes. These factors helped the company overcome increased costs, and deliver bottom-line growth. Sysco remains confident of achieving its financial goals for fiscal 2018.
Looking for More? Check These 3 Picks From Sysco’s Space
J&J Snack Foods (NASDAQ:JJSF) witnessed positive estimate revisions in the past seven days. The company carries a Zacks Rank #2. You can see the complete list of today’s Zacks #1 Rank (Strong Buy) stocks here.
Lamb Weston Holdings (NYSE:LW) with a Zacks Rank #2 has a splendid earnings surprise history and a long-term earnings growth rate of 12%.
Mondelez International (NASDAQ:MDLZ) , with a Zacks Rank #2 has a long-term growth rate of 11.5%.
Today's Stocks from Zacks' Hottest Strategies
It's hard to believe, even for us at Zacks. But while the market gained +18.8% from 2016 - Q1 2017, our top stock-picking screens have returned +157.0%, +128.0%, +97.8%, +94.7%, and +90.2% respectively.
And this outperformance has not just been a recent phenomenon. Over the years it has been remarkably consistent. From 2000 - Q1 2017, the composite yearly average gain for these strategies has beaten the market more than 11X over. Maybe even more remarkable is the fact that we're willing to share their latest stocks with you without cost or obligation.
See Them Free>>
Sysco Corporation (SYY): Free Stock Analysis Report
Mondelez International, Inc. (MDLZ): Free Stock Analysis Report
J & J Snack Foods Corp. (JJSF): Free Stock Analysis Report
Lamb Weston Holdings Inc. (LW): Free Stock Analysis Report
Original post
Zacks Investment Research