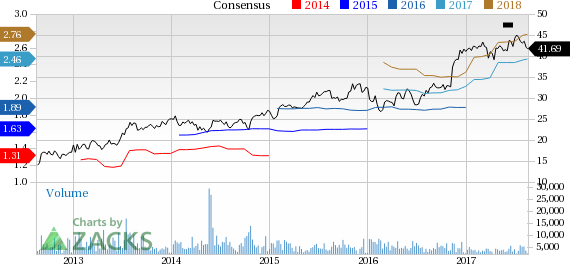
It has been about a month since the last earnings report for Synovus Financial Corp. (NYSE:SNV) . Shares have lost about 2.7% in that time frame, underperforming the market.
Will the recent negative trend continue leading up to the stock's next earnings release, or is it due for a breakout? Before we dive into how investors and analysts have reacted as of late, let's take a quick look at the most recent earnings report in order to get a better handle on the important drivers.
Synovus Q2 Earnings Beat on High Revenues, Costs Rise
Driven by revenue growth, Synovus recorded a positive earnings surprise of 1.7% in second-quarter 2017. Earnings of $0.60 per share beat the Zacks Consensus Estimate by $0.01. Also, the reported figure was up 30.4% from the prior-year quarter tally.
Higher revenues backed by strong loans & deposits balances drove organic growth. However, escalating expenses and provisions remain a concern. Notably, lower efficiency ratio was a tailwind.
Net income available to common shareholders came in at $73.4 million compared with $57.9 million recorded in the prior-year quarter.
Top-Line Growth Recorded, Expenses Moved Up
Total revenue in the second quarter was $319.8 million, up 10.5% year over year. In addition, the top line outpaced the Zacks Consensus Estimate of $317.6 million.
Net interest income increased 13.4% year over year to $251.1 million. Further, net interest margin expanded 24 basis points (bps) year over year to 3.51%.
Non-interest income inched up 1.2% year over year to $68.7 million, primarily on rise in fiduciary and asset management fees, other non-interest income and other fee income. These increases were partially offset by lower brokerage revenue, mortgage banking income and bankcard fees. Adjusted non-interest income was $70.1 million, up 3.4% year over year.
On the other hand, total non-interest expenses were $191.7 million, up 1.7% year over year, while adjusted non-interest expenses came in at $191.4 million, up 5.0% from the prior-year quarter. Notably, higher net occupancy and equipment expense, third-party processing expense, salaries and other personnel expense, along with professional fees, led to the rise.
Adjusted efficiency ratio was 59.56%, as compared with 63.00% in the year-earlier quarter. A decline in ratio indicates improvement in profitability.
Total deposits came in at $25.2 billion, up 5.4% year over year. Total net loans climbed 6.1% year over year to $24.2 billion.
Credit Quality: A Concern?
Credit quality metrics for Synovus was a mixed bag in the quarter.
Net charge-offs more than doubled to $15.7 million on a year-over-year basis. The annualized net charge-off ratio was 0.26%, up 15 bps from the prior-year quarter. Provision for loan losses jumped 53.3% year over year to $10.3 million.
Non-performing loans, excluding loans held for sale, were up 3.4% year over year to $159.3 million. The non-performing loan ratio was 0.65%, down 2 bps year over year.
Additionally, total non-performing assets amounted to $178.9 million, underlining a decline of 4.5% year over year. The non-performing asset ratio contracted 8 bps year over year to 0.73%.
Capital Position: A Mixed Bag
Tier 1 capital ratio and total risk based capital ratio were 10.36% and 12.24%, respectively, compared with 10.06% and 12.05% as of Jun 30, 2016.
Further, as of Jun 30, 2017, Common Equity Tier 1 Ratio (fully phased-in) was 9.81% compared with 9.49% in the year-ago quarter. Tier 1 Leverage ratio was 9.29% compared with 9.10% in the year-ago quarter.
Capital Deployment Update
During the reported quarter, the company repurchased common stock worth $30.2 million.
2017 Outlook
Management projects average loan and average total deposits growth of around 5–7%.
Net interest income is projected to grow in the range of 12–14%. Also, management remains focused on achieving adjusted non-interest income growth of 2–4% on investments in fee-producing business.
Total non-interest expense is projected to increase 2–4%. Also, management expects to maintain positive operating leverage.
The company’s loan loss reserve ratio is expected to be above 1%, though a slightly downward trend is likely to be witnessed. Further, it expects net charge-off ratio of 15 to 20 bps. Non-performing assets and liabilities are expected to be relatively flat in 2017.
Management expects the tax rate to be 34 to 35% in 2017.
Long-term Targets
The company expects EPS (earnings per share) to grow more than 10%.
Return on assets of 1% has been projected.
Management projects adjusted efficiency ratio to be lower than 60%.
Ongoing efficiency initiative is expected to result in annual savings of approximately $2.5 million.
How Have Estimates Been Moving Since Then?
Following the release, investors have witnessed an upward trend in fresh estimates. There have been three revisions higher for the current quarter.
Synovus Financial Corp. Price and Consensus
VGM Scores
At this time, the stock has a subpar Growth Score of D, however its Momentum is doing a bit better with a C. Following the exact same course, the stock was allocated also a grade of C on the value side, putting it in the middle 20% for this investment strategy.
Overall, the stock has an aggregate VGM Score of C. If you aren't focused on one strategy, this score is the one you should be interested in.
Zacks' style scores indicate that the company's stock is suitable for value and momentum investors.
Outlook
Estimates have been trending upward for the stock. The magnitude of these revisions also looks promising. Notably, the stock has a Zacks Rank #3 (Hold). We are expecting an inline return from the stock in the next few months.
Synovus Financial Corp. (SNV): Free Stock Analysis Report
Original post

