Forex News and Events
Switzerland manufacturing PMI below 50
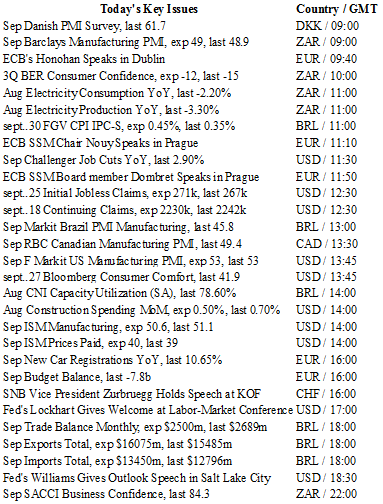
Manufacturing sectors are contracting across the planet and Switzerland can no longer be considered an exception. According to the latest data, Swiss purchasing mangers’ index surprised to the downside in September, printing at 49.5, less than the median forecast of 51.8 and previous month read of 52.2. For the first time since March, the output (s.a.) contracted to 49.1 in September from 62.4 in August.
At the same time, August real retail sales contracted 0.3%m/m (-2.5% in nominal terms), compared to an upwardly revised increase of 0.1%m/m in the previous month, as volatile components such as food, beverage, tobacco and fuel continue to weigh on the index. When excluding fuel, retail sales grew 0.6% (-1.6% in nominal terms).
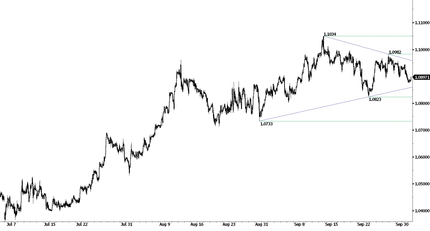
Despite the recent depreciation of the Swiss franc to EUR/CHF 1.10, the CHF is still widely seen as overvalued. It may limit the damage, to some extent, but the economy will continue to suffer in the long-term. In addition, with the current bleak, uncertain global economic outlook and environment, investors are in risk-off mode, preventing the Swiss franc from further weakening. The SNB has been of little help but even if the central bank remained active in the FX market, the size of its interventions (Sfr432mn per week on average in September) would not be substantial enough to allow EUR/CHF to properly break the 1.10 strong threshold. We expect EUR/CHF to remain below 1.10 as long as the market remains in risk-off mode.
EUR/CHF - Downside Momentum Continues


The Risk Today
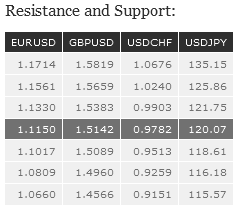
EUR/USD has broken short-term symmetrical triangle and is now approaching support at 1.1087 (03/09/2015 low). Stronger support lies at 1.1017 (18/08/2015 low). Hourly resistance can be found at 1.1330 (21/09/2015 high). In the longer term, the symmetrical triangle from 2010-2014 favored further weakness towards parity. As a result, we view the recent sideways moves as a pause in an underlying declining trend. Key supports can be found at 1.0504 (21/03/2003 low) and 1.0000 (psychological support). We remain in a downside momentum.
GBP/USD has broken hourly support at 1.5136 (25/09/2015 low) and is heading toward the 61.8% Fibonacci retracement. Stronger support can be found at 1.4960 (23/04/2015 low). Hourly resistance can be found at 1.5659 (27/08/2015 high). In the longer term, the technical structure looks like a recovery. Strong support is given by the long-term rising trend-line. A key support can be found at 1.4566 (13/04/2015 low).
USD/JPY is moving sideways. The pair is still moving around the 200-day moving average. Hourly support is given at 118.61 (04/09/2015 low). Stronger support can be found at 116.18 (24/08/2015 low). Hourly resistance can be found at 121.75 (28/08/2015 high). A long-term bullish bias is favored as long as the strong support at 115.57 (16/12/2014 low) holds. A gradual rise towards the major resistance at 135.15 (01/02/2002 high) is favored. A key support can be found at 118.18 (16/02/2015 low).
USD/CHF is still holding below resistance at 0.9844 (25/09/2015 low). The technical structure still shows an upside momentum. We remain bullish in the medium-term. In the long-term, the pair has broken resistance at 0.9448 suggesting the end of the downtrend. This reinstates the bullish trend. Key support can be found 0.8986 (30/01/2015 low).

