Anyone who reads my newsletter knows that I was waiting for a chart-related signal for a reversal in the sugar price as early as the end of April of this year. This signal has failed to appear so far, and in the meantime, the price of the Sugar #11 Futures is actually almost three cents lower than the end of April.
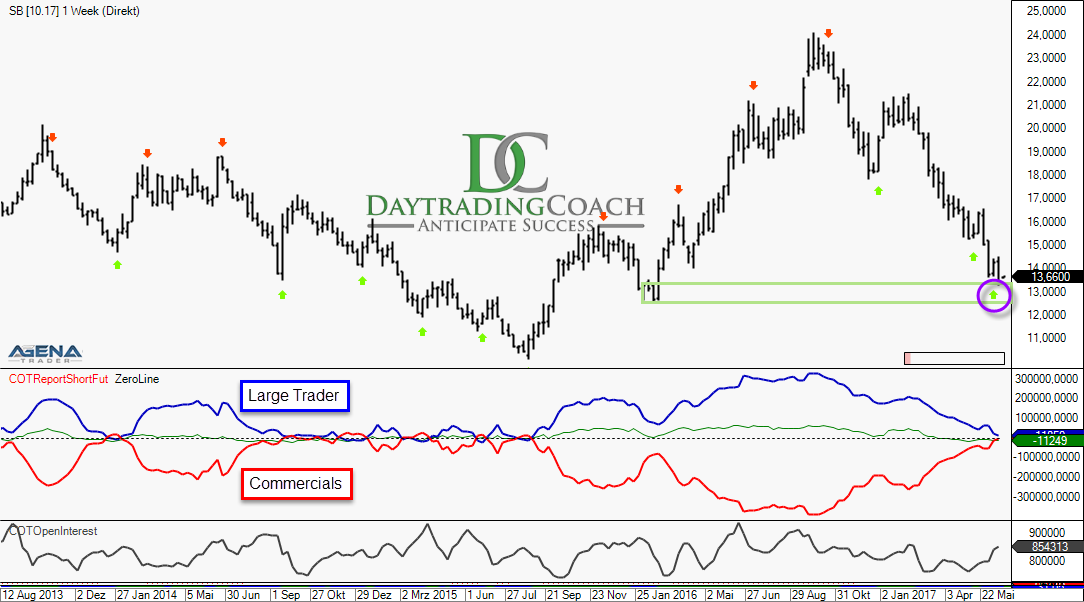
Even now, there are still no relevant signals in the chart to show that the downward trend may have come to an end, but the basic fundamental situation looks very bullish by now. In the first image, one can clearly see that the price has arrived at a strong support level. The green arrow shows that my indicator combination of COT and price indicators has already generated a long signal in the weekly chart. In the daily chart, this signal is still missing, but it could appear as early as at the end of today’s trading day if the price of sugar closes higher than it opened.
Regarding the Commitments of Traders (COT data): on Tuesday of the past week, the commercial hedgers were only a little over 600 futures contracts away from a net long position. A net long position of the commercials in a market in which the producers make up the majority of the commercials is one of the most bullish scenarios one can come across. In recent years, a net long position of the commercials was usually followed by a correction in the scale of 10 to 50 percent in an upwards direction.

The conclusion from a positioning such as this is that the consumers of sugar are of the opinion that the current price is, historically seen, very cheap, and that it is worth fixing this price for the near future. They do so by opening long positions in the futures market.
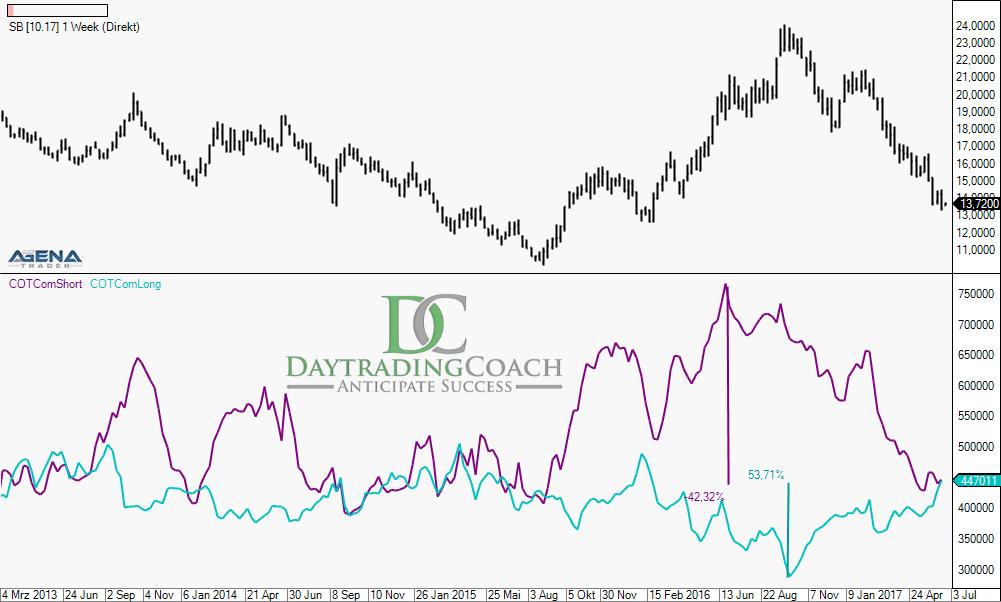
The long positions of the consumers have risen by over 50 percent in comparison to the market high in September 2016. From the perspective of the producers, the current price seems so low that the hedges against further falling prices have, in the meantime, been reduced by over 40 percent. To compare, take a look at image 2, in which the absolute long and short positions of the commercials are depicted.
The attainment of extremely low values (all the way down to net short positionings) of the big traders (blue line in screenshot 1) also indicates an imminent trend reversal. The big traders are predominantly trend followers – they sell when prices are falling – and therefore it is in the nature of things that they have usually reached their largest positions at the end of the trend.

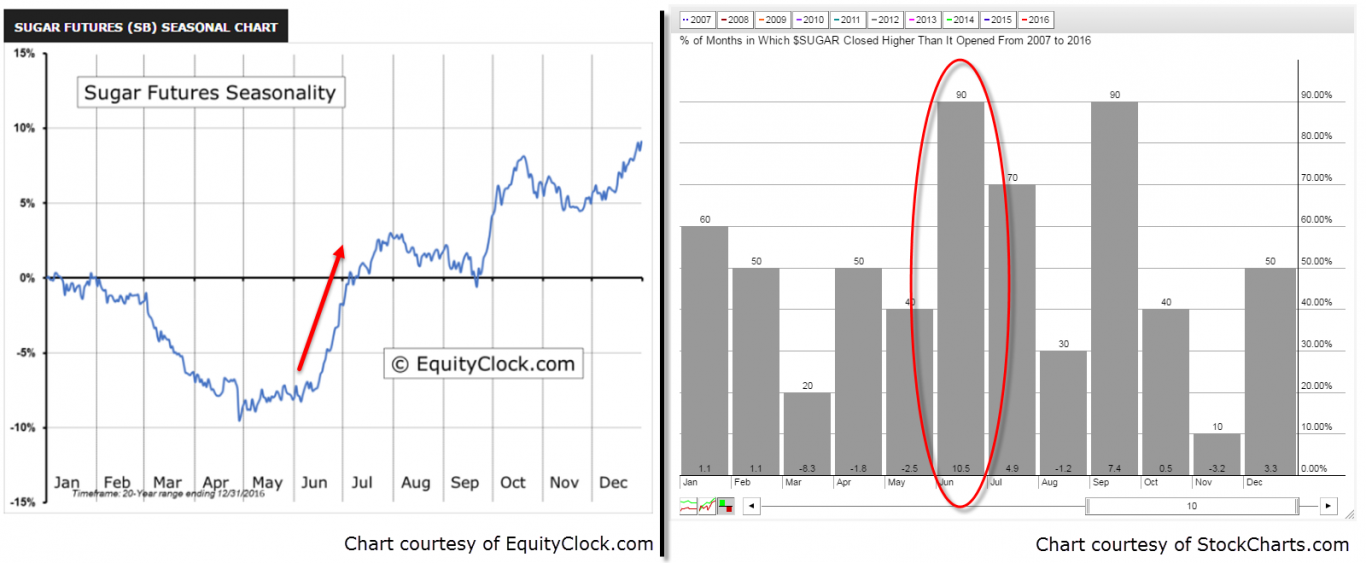
As a further weighty argument for a mid-term long position in the futures market, I would like to cite the seasonals of the sugar price. Image 3 shows, on the left-hand side, the seasonalities of sugar over the last 20 years. There, one can clearly see that June normally provides the starting signal for a larger upward movement. The right half of the image shows the monthly development of the sugar price over the last ten years.
In 9 out of 10 years, the price of sugar increased in June. If this tendency is to be kept, the price would still have to reconquer the 15 cent mark by the end of the month. On average, the price even reached an increase of 10.5 percent in June. This would be equivalent to a price of over 17 cents by the end of June. But we are not so likely to see this, although the time of year seems to be good for a mid-term correction.

Simply opening a position based on extreme COT positions or positive seasonalities in a commodities market is less likely to be a success.
The great art in using the COT data, however, alongside interpreting the data itself, is identifying the right entry point. For this, I use a combination of various indicators derived from prices, price levels and chart formations.
As always, I wish you successful trades and a wonderful rest of the week!
Disclaimer:
Exchange transactions are associated with significant risks. Those who trade on the financial and commodity markets must familiarize themselves with these risks. Possible analyses, techniques and methods presented here are not an invitation to trade on the financial and commodity markets. They serve only for illustration, further education, and information purposes, and do not constitute investment advice or personal recommendations in any way. They are intended only to facilitate the customer’s investment decision, and do not replace the advice of an investor or specific investment advice. The customer trades completely at his or her own risk.
