I should wash my mouth out with soap for penning this headline – nobody should put any faith in surveys. But for the last three months, the surveys have been consistently and unanimously telling us the economy is now expanding.
First looking at manufacturing, the graphic below sums up the situation. Note that values above zero show expansion.
Figure 1 – Long Bars are Actual Data from Federal Reserve and US Census, Short Bars Various Surveys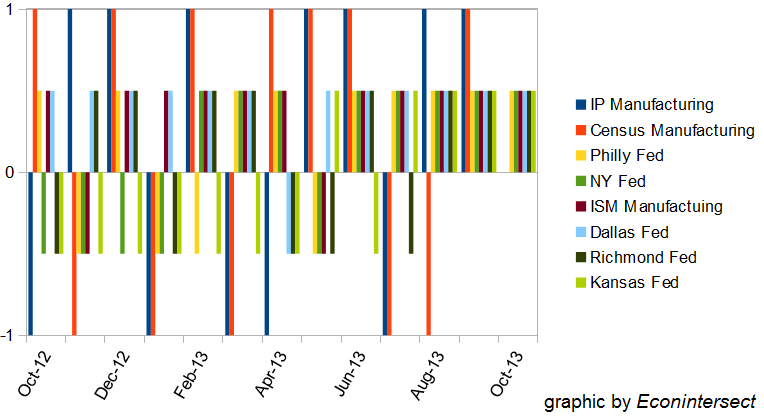
It is a very rare event recently that manufacturing surveys agree that expansion is occurring – and to have this going on for three months in a row should have a shock value. Most surveys are very volatile anyway – expanding one month, contracting the next.
One can argue that manufacturing is a very small part of the USA service based economy – less than 10% of employment and 20% of money flows. Yet manufacturing has a reasonable correlation to economic growth if compared to GDP.
Figure 2 – Year-over-Year Change GDP (blue line, left axis) and ISM Manufacturing (red line, right axis)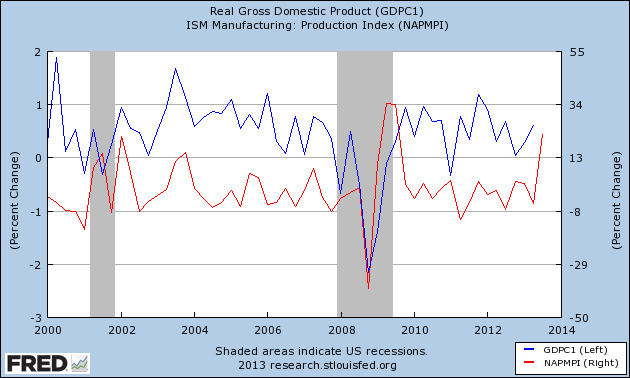
Big ISM movements usually foretell big GDP movements – this is now occurring (see red line).
An even higher correlation can be seen if GDP is compared to the ISM non-manufacturing business activity survey index – which represents 80% of the economy and 90% of employment.
Figure 3 – Year-over-Year Change GDP (blue line, left axis) and ISM Non-Manufacturing (green line, right axis)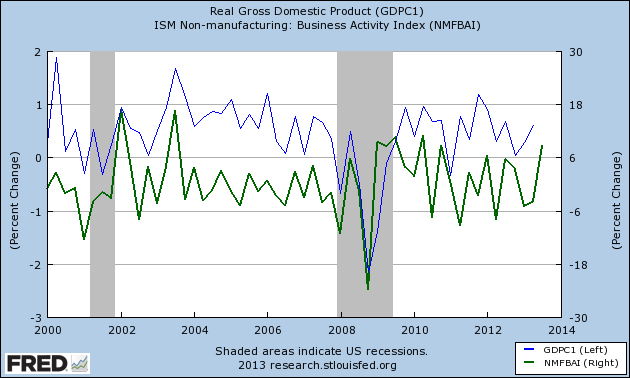
At one point in my past life, I was a purchasing manager and prepared input to these surveys – or rather I had my secretary do it. Really, I do not trust surveys as opinion varies depending on what side of the bed one wakes up on. In many organizations, the purchasing manager may not be in the proper loop to really understand what is going on in a company. But when all the surveys are in agreement, it is hard to discount the very positive message they are sending.
Other Economic News this Week:
The Econintersect economic forecast for November 2013 again improved . There is no indication the cycle is particularly strong, as our concern remains that consumers are spending a historically high amount of their income, and the rate of gain on the economic elements we watch are not very strong.
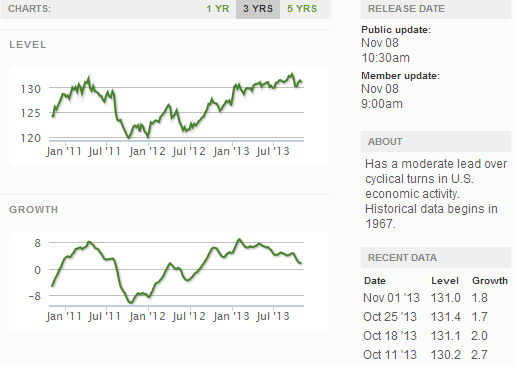
The ECRI WLI growth index value has been weakly in positive territory for over four months – but in a noticeable improvement trend. The index is indicating the economy six month from today will be slightly better than it is today.
Current ECRI WLI Growth Index
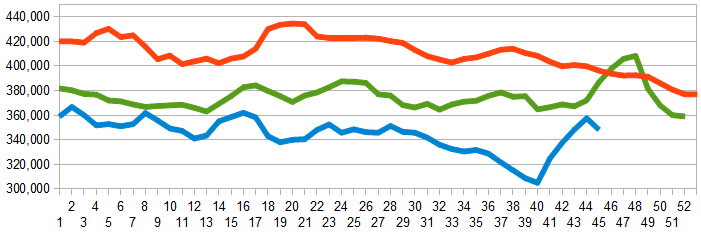
Initial unemployment claims went from 340,000 (reported last week) to 336,000 this week. Historically, claims exceeding 400,000 per week usually occur when employment gains are less than the workforce growth, resulting in an increasing unemployment rate.
The real gauge – the 4 week moving average – improved from 348,250 (reported last week but revised upward to 357,500) to 348,250. Because of the noise (week-to-week movements from abnormal events AND the backward revisions to previous weeks releases), the 4-week average remains the reliable gauge.
Weekly Initial Unemployment Claims – 4 Week Average – Seasonally Adjusted – 2011 (red line), 2012 (green line), 2013 (blue line)
Bankruptcies this Week: Privately-held EWGS Intermediary and Edwin Watts Golf Shops, Amarillo Biosciences, Privately-held Atlantic Express Transportation, Privately-held Simply Wheelz (aka Advantage Rent-A-Car)
Data released this week which contained economically intuitive components (forward looking) were:
- Rail movements growth trend is continuing to accelerate.
All other data released this week either does not have enough historical correlation to the economy to be considered intuitive, or is simply a coincident indicator to the economy.
Weekly Economic Release Scorecard:
Click here to view the scorecard table below with active hyperlinks

