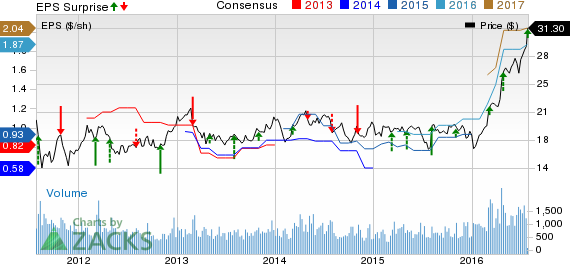
Superior Industries International, Inc. (NYSE:SUP) reported second-quarter 2016 earnings of 52 cents per share, which surpassed the Zacks Consensus Estimate of 45 cents. Moreover, earnings per share surged 85.7% from adjusted earnings of 28 cents recorded in the second quarter of 2015.
Earnings in the reported quarter benefited from higher shipment volume and better cost performance at the company’s manufacturing facilities, mainly driven by the new facility in Mexico which operated at higher utilization rates in the second quarter of 2016.
Revenues dipped 0.7% year over year to $182.7 million in the reported quarter but outpaced the Zacks Consensus Estimate of $176 million. The year-over-year decline in the top line was primarily due to lower aluminum price. Wheel unit shipments rose 13.2% to 3.1 million from 2.7 million units in the prior-year quarter.
Gross profit surged 48.3% to $29.5 million (16.2% of net sales) from $19.9 million (10.8%) in the prior-year quarter. Gross margin as of value added sales went up to 29.2% from 22.7% a year ago. The increase can be attributed to higher unit shipments and cost efficiency at the company’s manufacturing facilities, mainly driven by the new facility in Mexico which operated at higher utilization rates in the second quarter of 2016.
Selling, general and administrative expenses increased to $10 million in second-quarter 2016 from $8.9 million in the prior-year quarter. Operating income was $19.5 million (10.7% of sales) compared with $11 million (6% of sales) a year ago. Operating margin as a percentage of value added sales improved to 19.3% from 12.6% in the year-ago quarter.
Capital Deployment
In the second quarter of 2016, Superior Industries repurchased 51,186 shares for $1.2 million. From Dec 28, 2015 through Jul 26, 2016, the company repurchased 740,257 shares for $13.5 million. The company has $46.7 million remaining under its share repurchase authorization of $50 million.
In the reported quarter, the company paid a quarterly dividend of 18 cents per share.
Financial Details
For the first half of 2016, Superior Industries’ cash flow from operations was $24.5 million compared with $25.2 million in the year-ago period. The decrease in cash flow resulted from higher working capital, which offset the benefit from better earnings in the first half of the year.
Outlook
Superior Industries raised its 2016 outlook for unit shipment growth, net sales, value-added sales, and adjusted earnings before income tax depreciation and amortization (EBITDA). Management expects net sales in 2016 to range from $710–$725 million, up from the previous estimate of $690–$710 million.
Superior Industries expects value-added sales to be in the range of $395–$403 million, up from the previous forecast of $380–$395 million. Value-added sales will benefit from a 6%–8% rise in unit shipments as well as a favorable product mix. Value-added sales exclude the value of aluminum and outsourced process costs, which are passed on to customers.
The company expects adjusted EBITDA to increase to $102−$108 million from the prior forecast of $92−$98 million. Superior Industries anticipates adjusted EBITDA margin, as a percentage of value-added sales, to improve to 25.8%–26.8% from 24.1%–24.8%.
The company also projects capital expenditures of around $40 million. The effective tax rate is estimated to be in the range of 27%–29%. The company expects to pay a dividend of $20 million in 2016.
Superior Industries currently sports a Zacks Rank #1 (Strong Buy).
Stocks that Warrant a Look
Other well-ranked automobile stocks include Spartan Motors Inc. (NASDAQ:SPAR) , Johnson Controls Inc. (NYSE:JCI) and Gentex Corp. (NASDAQ:GNTX) , each carrying a Zacks Rank #2 (Buy).
Want the latest recommendations from Zacks Investment Research? Today, you can download 7 Best Stocks for the Next 30 Days.Click to get this free report >>
JOHNSON CONTROL (JCI): Free Stock Analysis Report
SUPERIOR INDS (SUP): Free Stock Analysis Report
GENTEX CORP (GNTX): Free Stock Analysis Report
SPARTAN MOTORS (SPAR): Free Stock Analysis Report
Original post
Zacks Investment Research

