⭐ Start off 2025 with a powerful boost to your portfolio: January’s freshest AI-picked stocksUnlock stocks

Dow Jones Composite: Will Prices Slip Below The Breakout?

Published 01/30/2017, 12:41 AM
Updated 07/09/2023, 06:31 AM
DJI
-
DJA
-
VIX
-

There’s not much going on the world right now (except for “lawyers rushing to airports” – yes, I just read that in an article) so I thought I’d just share a few words on this lazy Sunday about the historic breakout above 20,000 last week, particularly in the context of momentum.

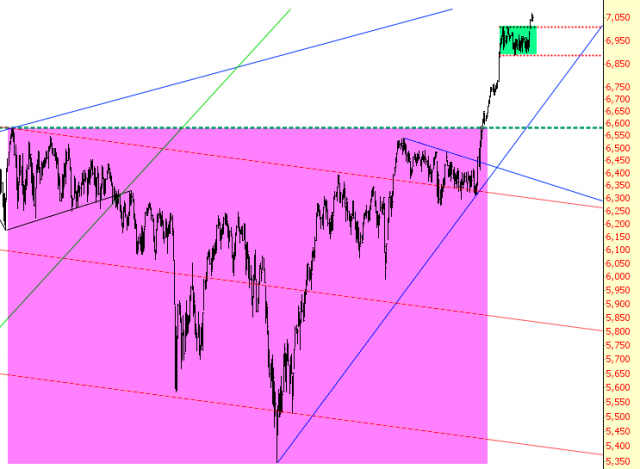
I offer to you the chart below, which is the Dow Jones Composite. As can be seen with the magenta tint, the index spend years forming a basing pattern. It began on the left with the “ichthus” pattern , and it finally broken above resistance after the election.
Dow Jones Composite Chart

What I want to emphasize about the chart above is the green zone. The range, as you can plainly see, is completely pipsqueak compared to the one before it. I would suggest that the energy from “escaping” that range will be quite muted, and the crucial thing to watch is to see whether or not prices slip below the breakout. Indeed, if 20,000 is such a huge deal psychologically, what happens when the 19-handle appears on the Dow again?

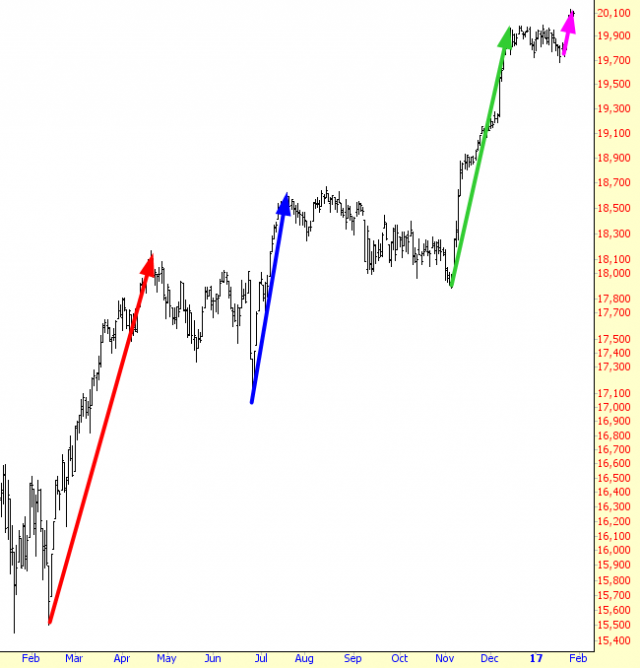
To drive this point home, below is the Dow itself (the Composite 65 contains the Dow Industrials, but also the 15 utilities and 20 transportation stocks). I suspect the ever-increasing population of bulls expects the latest thrust upward to be similar in power and force to the preceding it which I’ve highlighted below. At present valuations, and in the rapidly-souring political environment globally, I’m at a loss to suggest what would allow equities to soar, for the 4th time. If you’re not convinced of the giddy optimism, look no further than the “Dow 30,000” cover on Barron’s this week.
INDU Chart

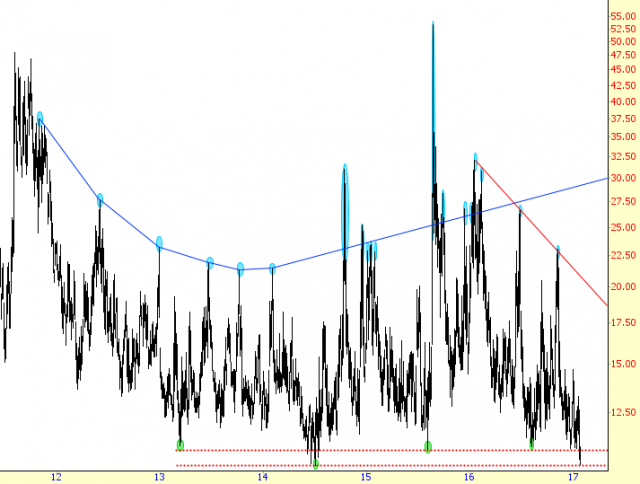
For me, the biggest clue about the market’s direction in the months ahead is the VIX, which has been smashed and beaten down to ONE FIFTH its value from August 2015. If you look closely, you’ll see the VIX is presently where it’s been only once before in the past decade, which is the summer of 2014.

No matter what one’s disposition, it must be clear to everyone that the present state of volatility is at an extreme low, and there’s only so long that the market can blind itself to the political insanity, which is only just now starting.
VIX Chart

Latest comments

Loading next article…
Risk Disclosure: Trading in financial instruments and/or cryptocurrencies involves high risks including the risk of losing some, or all, of your investment amount, and may not be suitable for all investors. Prices of cryptocurrencies are extremely volatile and may be affected by external factors such as financial, regulatory or political events. Trading on margin increases the financial risks.
Before deciding to trade in financial instrument or cryptocurrencies you should be fully informed of the risks and costs associated with trading the financial markets, carefully consider your investment objectives, level of experience, and risk appetite, and seek professional advice where needed.
Fusion Media would like to remind you that the data contained in this website is not necessarily real-time nor accurate. The data and prices on the website are not necessarily provided by any market or exchange, but may be provided by market makers, and so prices may not be accurate and may differ from the actual price at any given market, meaning prices are indicative and not appropriate for trading purposes. Fusion Media and any provider of the data contained in this website will not accept liability for any loss or damage as a result of your trading, or your reliance on the information contained within this website.
It is prohibited to use, store, reproduce, display, modify, transmit or distribute the data contained in this website without the explicit prior written permission of Fusion Media and/or the data provider. All intellectual property rights are reserved by the providers and/or the exchange providing the data contained in this website.
Fusion Media may be compensated by the advertisers that appear on the website, based on your interaction with the advertisements or advertisers.
© 2007-2025 - Fusion Media Limited. All Rights Reserved.