Black Friday Sale! Save huge on InvestingProGet up to 60% off

Illinois Tool (ITW) Tops Q3 Earnings & Sales, Ups '17 View

Published 10/22/2017, 10:39 PM
Updated 07/09/2023, 06:31 AM
ITW
-
HLIO
-
B
-
GGG
-

Industrial tool maker Illinois Tool Works Inc. (NYSE:ITW) kept its earnings streak alive in third-quarter 2017, pulling off a positive earnings surprise of 3.64%. Results were primarily driven by sales growth, benefits from enterprise initiatives and 2.7% fall in the diluted share count due to the company’s active share buyback activities.

Earnings in the quarter came in at $1.71 per share, above the Zacks Consensus Estimate of $1.65 and roughly 14% above the year-ago tally of $1.50. As noted, the bottom-line results excluded roughly 14 cents benefit accrued from a legal settlement.

Organic and Forex Gains Drove Top-Line Results

The quarter’s revenues totaled $3,615 million, reflecting growth of 4% from the year-ago tally. The improvement was driven by 2% organic gains and 2% positive impact of foreign currency movements.

Also, the top-line result surpassed the Zacks Consensus Estimate of $3.58 billion.

Illinois Tool Works reports its revenues under the segments discussed below:

Test & Measurement and Electronics’ revenues increased 1.8% year over year to $525 million. Revenues from Automotive OEM (Original Equipment Manufacturer) grew 4.1% to $795 million. Food Equipment generated revenues of $549 million, increasing 1.1% year over year.

Welding revenues came in at $378 million, growing 4.8% year over year. Construction Products’ revenues were up 6% to $440 million while revenues of $498 million from Specialty Products reflected growth of 4.6%. Polymers & Fluids’ revenues of $434 million increased 2.6% year over year.

Margin Profile Improves

In the quarter, Illinois Tool Works’ cost of sales increased 3.3% year over year, representing 57.9% of total revenues compared with 58% in the year-ago quarter. Selling, administrative, and research and development expenses, as a percentage of total revenues, came in at 16.3%.

Operating margin improved 130 basis points (bps) year over year to 24.4%, driven by roughly 110 bps contributions from enterprise initiatives. The margin excluded the impact from the legal settlement.

Cash Position Strong, Debt Increases

Exiting the third quarter, Illinois Tool Works had cash and cash equivalents of approximately $2,785 million, up from $2,496 million recorded in the previous quarter. Also, the company generated net cash of $780 million from its operating activities in the quarter, up 25% year over year. Capital expenditure on purchase of plant and equipment totaled $78 million. Adjusted free cash flow was $702 million, reflecting a conversion rate (as a percentage of net income) of 110%.

The company’s long-term debt balance increased 1.1% sequentially to $7,439 million.

Outlook

Illinois Tool Works increased its GAAP earnings guidance to $6.62-$6.72 per share, reflecting 25 cents growth at mid-point.

Organic revenue growth is expected to be 2-3% while operating margin is projected to be 24.5%. Full-year free cash flow is anticipated to be in excess of 100% of net income.

For fourth-quarter 2017, GAAP earnings per share are expected within $1.55-$1.65. Organic revenues are expected to be 2-3%.

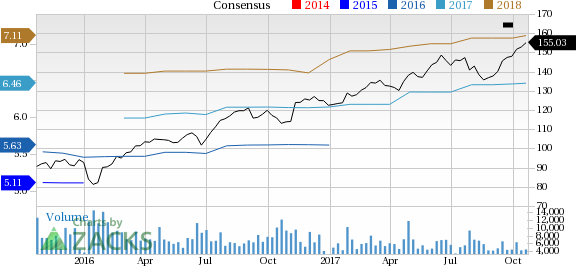
Illinois Tool Works Inc. Price and Consensus

Illinois Tool Works Inc. Price and Consensus | Illinois Tool Works Inc. Quote

Zacks Rank & Key Picks

With a market capitalization of $53.4 billion, Illinois Tool Works carries a Zacks Rank #2 (Buy). Some other stocks worth considering in the industry are Barnes Group Inc. (NYSE:B) , Graco Inc. (NYSE:GGG) and Sun Hydraulics Corporation (NASDAQ:SNHY) . All these stocks sport a Zacks Rank #1 (Strong Buy). You can see the complete list of today’s Zacks #1 Rank stocks here.

Barnes Group pulled off an average positive earnings surprise of 11.60% over the last four quarters. Also, its earnings estimates for 2018 were revised upward over the last 60 days.

Graco delivered an average positive earnings surprise of 23.95% over the last four quarters. Also, earnings estimates for 2018 improved over the past 60 days.

Sun Hydraulics’ financial performance was impressive, with an average positive earnings surprise of 3.47% over the last four quarters. Also, earnings estimates for 2017 and 2018 were revised upward over the last 60 days.

Will You Make a Fortune on the Shift to Electric Cars?

Here's another stock idea to consider. Much like petroleum 150 years ago, lithium power may soon shake the world, creating millionaires and reshaping geo-politics. Soon electric vehicles (EVs) may be cheaper than gas guzzlers. Some are already reaching 265 miles on a single charge.

With battery prices plummeting and charging stations set to multiply, one company stands out as the #1 stock to buy according to Zacks research.

It's not the one you think.

See This Ticker Free >>


Graco Inc. (GGG): Free Stock Analysis Report

Illinois Tool Works Inc. (ITW): Free Stock Analysis Report

Barnes Group, Inc. (B): Free Stock Analysis Report

Sun Hydraulics Corporation (SNHY): Free Stock Analysis Report

Original post

Zacks Investment Research

Latest comments

Loading next article…
Risk Disclosure: Trading in financial instruments and/or cryptocurrencies involves high risks including the risk of losing some, or all, of your investment amount, and may not be suitable for all investors. Prices of cryptocurrencies are extremely volatile and may be affected by external factors such as financial, regulatory or political events. Trading on margin increases the financial risks.
Before deciding to trade in financial instrument or cryptocurrencies you should be fully informed of the risks and costs associated with trading the financial markets, carefully consider your investment objectives, level of experience, and risk appetite, and seek professional advice where needed.
Fusion Media would like to remind you that the data contained in this website is not necessarily real-time nor accurate. The data and prices on the website are not necessarily provided by any market or exchange, but may be provided by market makers, and so prices may not be accurate and may differ from the actual price at any given market, meaning prices are indicative and not appropriate for trading purposes. Fusion Media and any provider of the data contained in this website will not accept liability for any loss or damage as a result of your trading, or your reliance on the information contained within this website.
It is prohibited to use, store, reproduce, display, modify, transmit or distribute the data contained in this website without the explicit prior written permission of Fusion Media and/or the data provider. All intellectual property rights are reserved by the providers and/or the exchange providing the data contained in this website.
Fusion Media may be compensated by the advertisers that appear on the website, based on your interaction with the advertisements or advertisers.
© 2007-2024 - Fusion Media Limited. All Rights Reserved.