Selloff or Market Correction? Either Way, Here's What to Do NextSee Overvalued Stocks

Sugar Looking To Reverse?

Published 05/06/2016, 11:54 AM
Updated 07/09/2023, 06:31 AM
SB
-

OK, I understand that the sugar market is not top of mind for a lot of people. But if you ate as much of it as I do you would better understand my fixation. Beyond that, one the keys to success for a trader is to identify potential opportunities wherever they may lie.

A Potential Reversal in Sugar?

A glance at Figure 1 below reveals a classic (potential) “key reversal” pattern for the October 2016 sugar futures contract. As you can see, sugar has a history of forming multiple tops and/or bottoms and then reversing.Potential Key Reversal In October Sugar
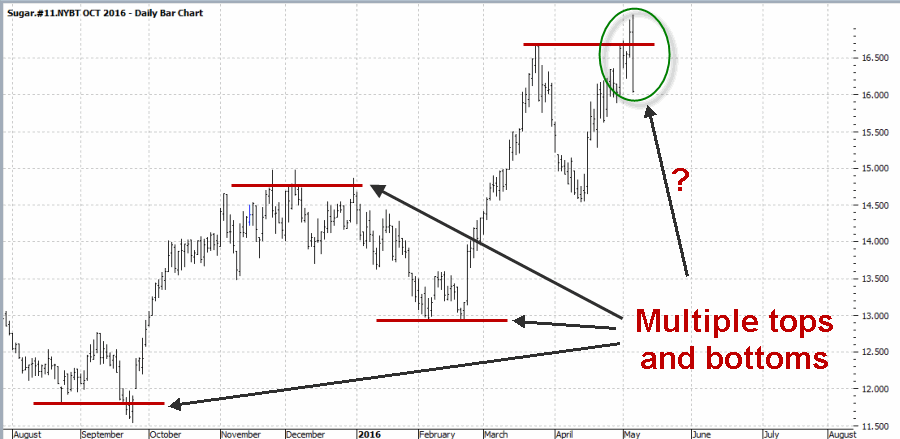
Figure 1: (Courtesy ProfitSource by HUBB)

In the last several days:

*Price broke out to a new high (for the move) for one day

*Tried to trade higher the next day

*Then collapsed like, um, a rotten tooth(?)

Is this a tradable event? Some technical analysts might say “yes”, while others might say “no”, or more likely, “maybe”. Now look at Figure 2, which displays the weekly Elliott Wave count for October sugar as calculated by ProfitSource from HUBB.Sugar's Weekly Elliott Wave Count May Be Bearish
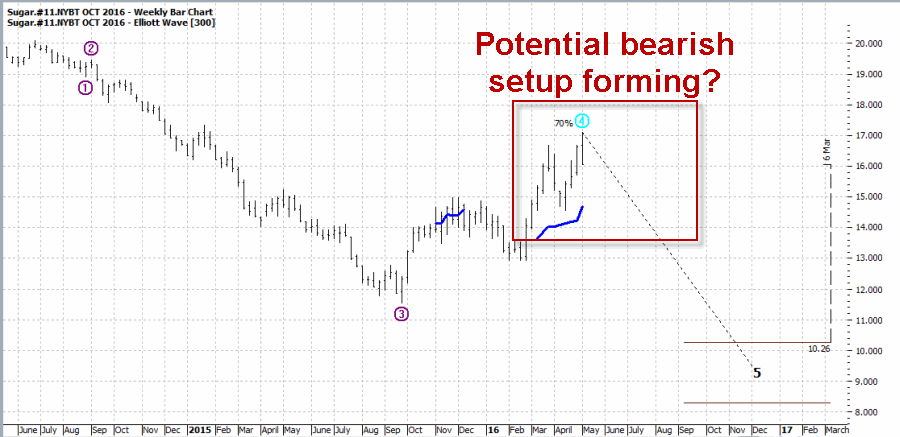
Figure 2: (Courtesy ProfitSource by HUBB)

As you can see in Figure 2, the weekly EW count for October sugar is projecting the potential for sharply lower prices if there is a breakout to the downside below the rising blue line. A word of caution: Elliott Wave counts have a way of shifting over time so this is simply a “projection” based on the current chart configuration, and NOT a prediction.

Summary

So is the seven month rally in sugar over? Are we headed back down to 10 or 11 cents a pound? Is now the exact right moment to sell short?

Sorry folks, but I have to go with my stock answer – “it beats me.”

The only thing I do know is that I will be keeping an eye on the weekly chart and if:

*The current Elliott Wave count (i.e., setting up a Wave 4 sell) holds, AND

*October sugar breaks below the rising EW blue line (see Figure 2);

*There may be an opportunity to play the short side in sugar.

Latest comments

Loading next article…
Risk Disclosure: Trading in financial instruments and/or cryptocurrencies involves high risks including the risk of losing some, or all, of your investment amount, and may not be suitable for all investors. Prices of cryptocurrencies are extremely volatile and may be affected by external factors such as financial, regulatory or political events. Trading on margin increases the financial risks.
Before deciding to trade in financial instrument or cryptocurrencies you should be fully informed of the risks and costs associated with trading the financial markets, carefully consider your investment objectives, level of experience, and risk appetite, and seek professional advice where needed.
Fusion Media would like to remind you that the data contained in this website is not necessarily real-time nor accurate. The data and prices on the website are not necessarily provided by any market or exchange, but may be provided by market makers, and so prices may not be accurate and may differ from the actual price at any given market, meaning prices are indicative and not appropriate for trading purposes. Fusion Media and any provider of the data contained in this website will not accept liability for any loss or damage as a result of your trading, or your reliance on the information contained within this website.
It is prohibited to use, store, reproduce, display, modify, transmit or distribute the data contained in this website without the explicit prior written permission of Fusion Media and/or the data provider. All intellectual property rights are reserved by the providers and/or the exchange providing the data contained in this website.
Fusion Media may be compensated by the advertisers that appear on the website, based on your interaction with the advertisements or advertisers.
© 2007-2024 - Fusion Media Limited. All Rights Reserved.