S&U’s FY19 results were close to expectations and changes to our prospective numbers are limited. The tightening of motor finance lending criteria and more modest receivables growth are prudent and should help protect prospective profitability at a point where there is considerable macro uncertainty. Small as yet, the property bridging business is developing well and has the potential to augment growth usefully in future.
FY19 results
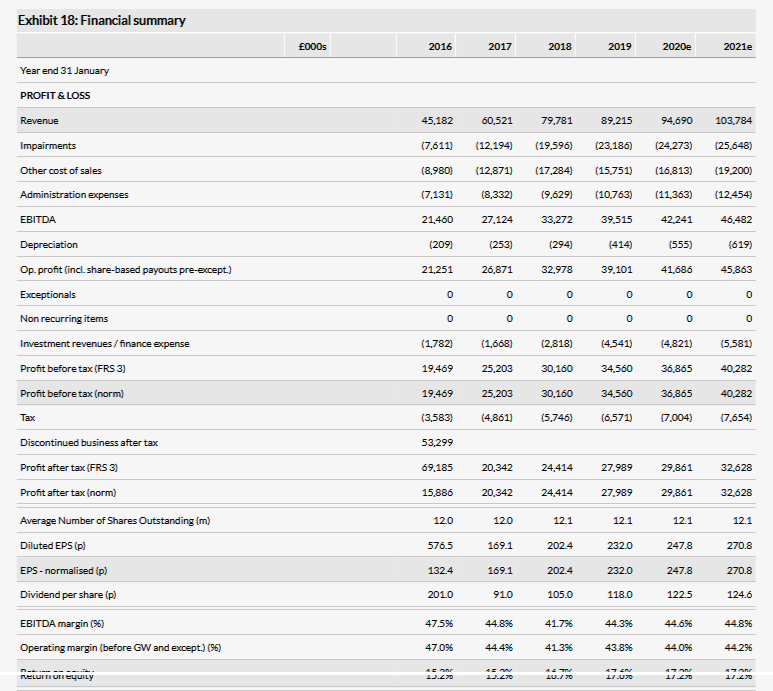
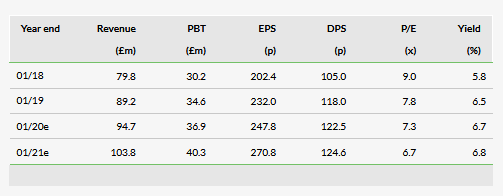
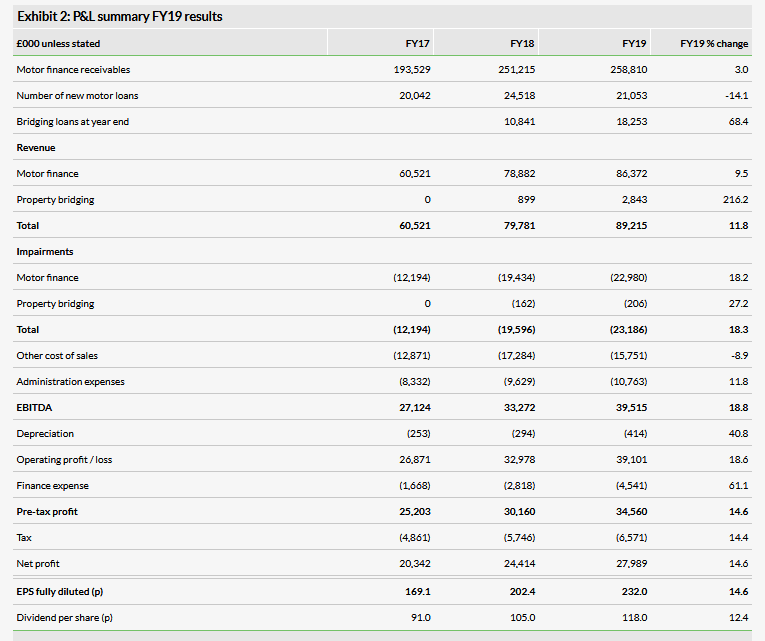
S&U reported full year results broadly in line with our estimates. Revenue of £89.2m and pre-tax profit of £34.6m were up12% and 15% vs FY18. Fully diluted EPS increased by a similar amount to 232p. With a final payment of 51p vs 45p the full year dividend is 12% ahead at 118p. As foreshadowed in previous updates from the company, loan growth at the main Advantage motor finance business has slowed as a result of tightening of credit criteria to address increased impairment and a higher level of competition. The number of transactions was 14% lower than the prior year and motor finance receivables ended the year at £259m (+4% y-o-y but below the H1 and December levels). The Aspen property bridging business is making good progress and had a loan book of over £18m vs £11m at the beginning of the year. It made a pre-tax profit contribution of £0.8m vs a loss of £0.3m.
Background and outlook
The market for used cars has historically been more stable than new car registrations and used car finance has grown above the rate of used car transactions. Prospectively the market may well grow at a slower rate but Advantage has a small market share and still receives a high and growing level of applications. It has tightened its credit criteria and over time this should contain the level of impairments defending/improving the risk-adjusted yield. Greater competition has also contributed to tempered growth expectations, but Advantage is maintaining pricing discipline and given its experience in the market is well-placed to respond by finetuning its offering and focusing on segments offering favourable risk-adjusted returns. Aspen meanwhile continues to develop strongly from a small base but with a conservative approach to credit risk.
Valuation: Opportunity provided by price weakness
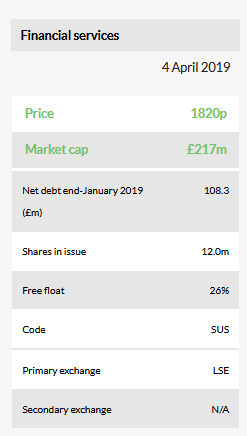
Our estimates for FY20 are little changed and we look for S&U to generate a return on equity of over 17%. An ROE/COE model suggests the market is factoring in a return of only 12% at the current price, while, following price weakness, the prospective P/E is below average compared with our selected peers (see page 9).
Business description
S&U’s Advantage motor finance business lends on a simple hire-purchase basis to lower and middle income groups that may have impaired credit records that restrict their access to mainstream products. It has just over 59,000 customers. The Aspen property bridging business has moved beyond the pilot stage and is expanding its loan book (just over £18m at end-January 2019).
A tried and tested company with a new venture
S&U’s origins lie in a business founded by the chairman’s grandfather. That evolved into a home collected credit company and, nearly 20 years ago, this was joined by Advantage Finance, a nonprime motor finance business. The sale of the home collected credit business to Non Standard Finance in 2015 for £82.5m represented a significant change for the group and provided the means to finance a £15m special dividend and to invest in the continued strong growth at Advantage and subsequently the pilot stage of a new property bridging business (Aspen Bridging).
Sustained profitable growth in non-prime motor finance
Advantage Finance was formed in 1999 and is based in Grimsby with c 150 employees. The majority of the management team has been with the company since launch. Advantage has a strong growth record and even after FY19, which saw more muted growth, the five-year compound growth in net customer receivables has been 29% to £259m at the end of January 2019. It has over 59,000 live customers and recorded more than 21,000 new transactions in FY19. Advantage focuses on the non-prime area of the market and 90% of its lending is through over 40 brokers, with 5% each from dealerships and existing customers. The broker sourced business divides 50/40 between internet and dealership brokers. S&U has relationships with the largest UK brokers including names such as Carfinance247, Zuto, Evolution Funding, Jigsaw and Auto Union Finance. This gives access to both large dealership networks and smaller local dealers.
Almost all the loan applications are submitted to the Advantage web-based system, which provides immediate in-principle lending decisions. The in-house IT capability at Advantage (about 10% of the staff) is an important enabler for the business as it helps maintain a high-speed response to loan applications and rapid adjustments to systems in response to business requirements. A recent example is the integration of credit data from a new provider that will allow Advantage to respond better to the increased risk posed by relatively new high-cost short-term credit products.
Most loans range from £5,000 to £7,000, with a maximum loan amount of £12,000; the average advance in FY19 was c £6,100. The average original term was 50 months with a flat interest rate of 17.9% (c £11,000 repayable including interest). The provisional approval rate for loan applications in the last financial year was approximately 23%, with c 230,000 out of one million applications approved. The 21,000 that actually signed up were therefore equivalent to about 9% of approvals or 2% of original applications. The small ratio of deals signed in part reflects buyers’ increased use of the internet to source finance before shopping for a car and is not onerous for Advantage given the automation of responses to applications. Advantage’s Dealflo e-signature system has helped to support the sign-up rate following approval, by guiding customers through terms and conditions and verifying their digital signatures.
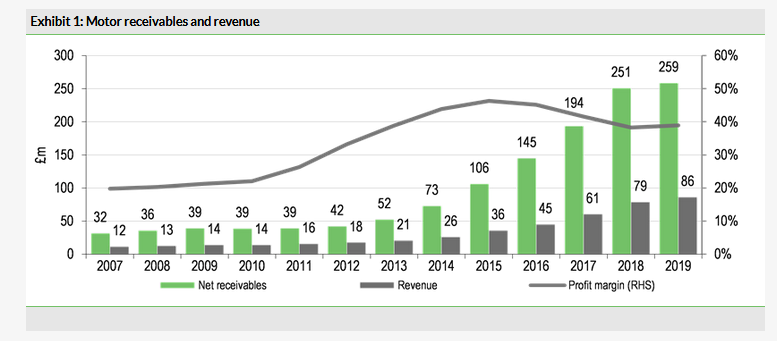
Advantage has achieved 19 years of consecutive profit growth, reflecting growth in the loan book paired with successful credit control, underpinned by the continuous refinement of a bespoke underwriting and scoring system, developed in conjunction with Experian and referencing a range of data sources. Exhibit 1 shows the development in receivables, revenue and profit margin at Advantage since 2007. As can be seen, growth accelerated in the post financial crisis period (notably from 2013) when limited availability of credit created a particularly favourable environment with customers who might previously have been served by the incumbent banks migrating to specialist providers such as Advantage. Revenue and margin benefited subsequently with the latter rising to more than 40% for four years followed by a moderation more recently as a result of rising broker commission and impairments, and, to a lesser extent, the withdrawal from the sale of gap insurance (2015). Not shown, the return on capital for Advantage has followed a similar pattern, peaking at over 20% and then contracting to a still healthy level just above 15% in FY19.
Property bridging finance: A diversifying source of growth
Aspen Bridging launched as a pilot project in February 2017 to test the viability of developing property bridging finance as a diversifying activity and alternative source of growth for the group. In November 2018 S&U announced that it would move on from the pilot stage and invest further in the business to take its loan book to c £30m during 2019.
Loans are made for home refurbishment or investment with an original term of nine months; facilities have an option for Aspen to extend the term by two months and repayment is financed by sale or remortgaging. Loans are all unregulated (not owner-occupier) and are secured with a first charge. S&U notes that it is addressing a market niche financing projects that larger institutions would find difficult to service with the speed and flexibility Aspen can offer.
Aspen follows a cautious underwriting approach with a process that includes third-party legal and valuation input, together with a site meeting with each customer by a member of the 11-strong Aspen team. Since launch the average maximum loan to value has been 71%. At end FY19 the loan book stood at £18.3m and during the year there were 62 transactions with a gross average loan size of £375,000.
FY19 results commentary
S&U’s overall results were similar to our expectations with revenue and pre-tax profit slightly above and slightly below our forecast figures respectively. Prominent features included the expected slowdown in receivables growth at Advantage and a further tick up in the level of impairments relative to revenues and receivables while Aspen has continued to grow rapidly following its move beyond the pilot stage. Exhibit 2 sets out a summary profit and loss comparison with prior years. Key points from the results are noted below with percentage changes versus FY18 unless stated.
Year-end motor finance receivables increased by 3% while the average level of receivables was up 15%, reflecting the growth that took place in FY18. The property bridging loan book increased by 68%.
At a group level revenue was up 12%, but this would have been 15% if adjusted for the introduction of IFRS 16. Advantage revenue increased by nearly 10%.
Impairments increased 18% reflecting pressure on some customer incomes and the impact of newer high-cost short-term credit (HCSTC) products in some cases. At Advantage the impairment charge was equivalent to 26.6% of revenue versus 24.6%. Aspen has experienced one default loss so far, which was of default interest only (not capital or term interest), and the impairment provision remains low at 7.2% of revenue.
The 9% reduction in cost of sales reflected a lower number of Advantage transactions (14%) partly offset by a higher average commission payment.
Administrative expenses increased at a similar rate to revenue (+12%) leaving a pre-tax profit increase of nearly 15% to £34.6m.
Segmentally, Advantage pre-tax profit was 11% higher at £33.6m (£30.2m), while, as noted earlier, Aspen moved from a loss of £0.3m to a profit of £0.8m. There was a marginal central profit contribution reflecting finance income net of costs.
Earnings per share increased by nearly 15% to 232p (fully diluted basis) and a final dividend of 51p was proposed, giving a total for the year of 118p (+12%).
Looking more closely at the Advantage result, Exhibit 3 shows the evolution of revenues and impairments as a percentage of receivables since 2007. As noted earlier there was a period of higher yields following the financial crisis followed by some erosion as competitive pressures increased in response to the attractive returns available. The revenue yield in FY19 was lower at 33.3% compared with 35.1% for FY18, in part reflecting changes in mix between customer/vehicle risk categories. Advantage has indicated that the flat interest rate charged ranges between approximately 12% and 25% for its top and bottom categories corresponding to the risk exposure for each. The target return on capital for all categories is the same at 16–18%, although in practice the outcome will vary positively and negatively subject to the performance of the loans once issued. Impairments as a percentage of receivables were slightly higher at 8.7% versus 9.0%. The level of impairments is higher than the group hoped at this stage with the difference primarily reflecting the impact of loans taken on before credit criteria were tightened, including the adverse effect on some customers of HCSTC products, as noted earlier. The combination of lower revenue yield and a higher impairment percentage reduced the risk-adjusted yield (revenue less impairments as a percentage of average receivables) and this is shown in Exhibit 4. On the same chart we can see that the profit margin was slightly higher, with the lower cost of sales resulting from the reduction in number of transactions being the driver here.
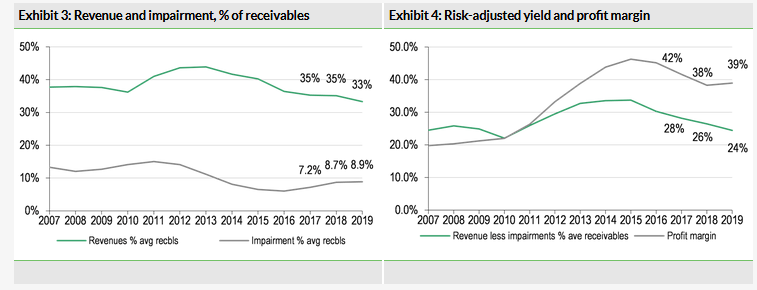
Exhibit 5 shows how Advantage’s average internal customer credit score and the flat interest rate by period of origination has moved since FY12. This shows an offset between pricing and risk with rates rising as the mix was adjusted towards lower credit scores. The reduction in average credit score shown here also reflects the settlement of most of the high-scoring FY12–14 originations. Prospectively we would expect the score to increase following the tightening of credit criteria and a deliberate shift away from the lower end of highest-risk category (these applicants are also seen as more likely to be vulnerable to economic disruption). The arrears profile (not shown) saw a decline in the percentage of receivables where payments are up to date (down from 83.3% to 79.2%) much of which is attributable to the lower level of new business (new loans start up to date). While the impairment and arrears trends are less favourable than hoped last year, there are signs that the implementation of tighter criteria is beginning to take effect. One of the metrics Advantage monitors is the percentage of borrowers paying their first repayment on time and this began to improve in mid-2017. The measure has a good correlation with outcomes (for example the level of eventual write offs), which, if maintained, should signal a progressive improvement in Advantage’s rate of impairment.
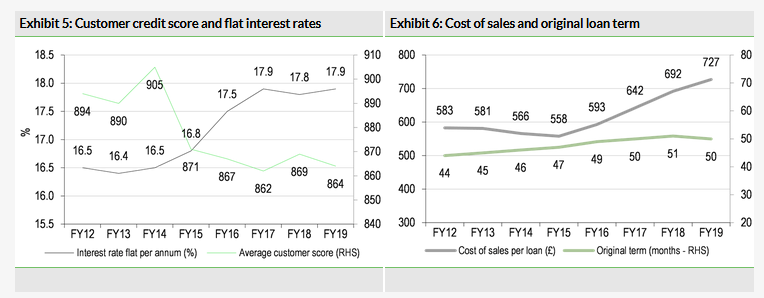
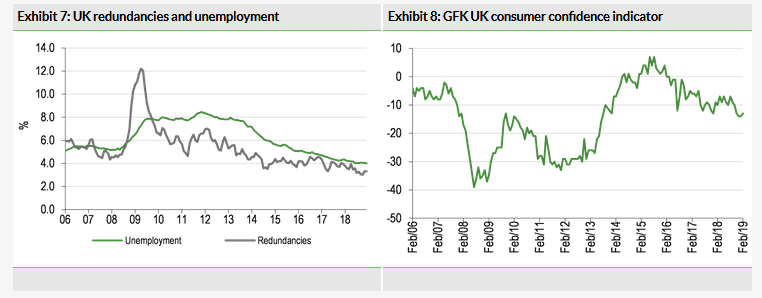
Exhibit 6 illustrates the post-financial crisis normalisation of competitive pressure and the increasing importance of internet broking. The original duration of loans has increased over the period shown, which helps attract customers as it reduces the monthly payments but does imply some increase in risk for the lender (potentially compensated for by the interest rate). The small reduction last year suggests that this trend may have run its course. The chart also shows a rise in the cost of sales per loan. After falling between FY12 and FY15, this has now increased, largely reflecting the increase in payments to the brokers that originate most of the loans. The increasing role of the larger internet brokers and competitor behaviour contribute to this trend and S&U has signalled that it may increase commission payments further in order to generate renewed growth in receivables.
Market background and outlook
Macroeconomic and political uncertainty remains a prominent feature of the UK backdrop. As an illustration of recent changes in economic expectations, the Office of Budget Responsibility (OBR) in its March report reduced its 2019 UK GDP forecast by 0.4 points to 1.2% followed by an unchanged 1.4% for 2020 (assuming an orderly Brexit). Unemployment is an important indicator for the health of consumer lending and tends to lag GDP changes. Given its assumptions the OBR does not flag a rise in unemployment in its 2019–23 forecast period (stable at c 4%). The level of redundancies, which has trended down since the financial crisis, remains at a relatively low level (see Exhibit 7) although all key economic metrics could be at risk if Brexit-related disruption did become a significant factor. Consumer confidence, as measured by the GFK index (Exhibit 8), has declined since 2015 although this trend has been less marked recently despite the lack of a resolution of the political impasse over Brexit.
The overall number of transactions in the used car market has fallen modestly from a peak level in 2016 (Exhibit 9) but the number of transactions financed through dealerships, as reported by the Finance and Leasing Association (FLA), has increased significantly. The average finance per transaction has also risen at a compound rate of 3% since 2009. The combination of a rising share of transactions financed and the increase in the average level of finance per transaction has generated 14% compound growth in used-car finance through dealerships between 2009 and 2018 (Exhibit 10).
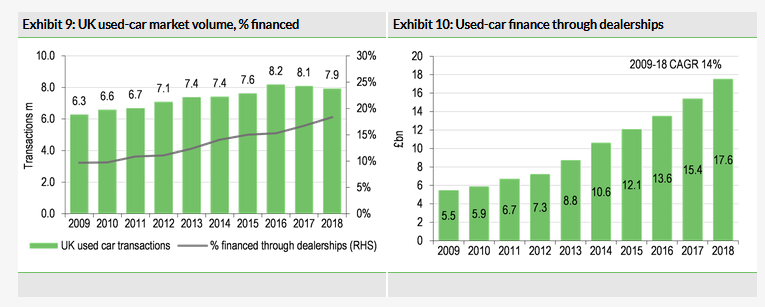
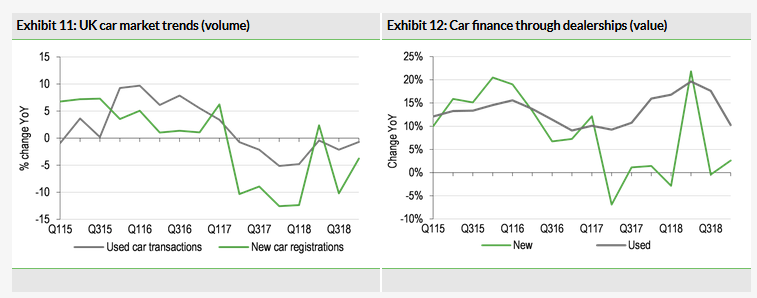
Exhibit 11 shows the recent trend in used car transactions and new car registrations, illustrating the point that the new market tends to be more volatile than used transactions. The same is true for car finance as illustrated by FLA data in Exhibit 12
S&U notes that the level of prices achieved on cars it sends to auction has been resilient and this is in line with figures published by BCA Marketplace on its auction prices. For Advantage, a reduction in prices would be a negative (potentially triggering higher early redemptions and lower realisations on repossessed vehicles), but the level of depreciation that has already been incurred on the cars for which Advantage is providing finance reduces the sensitivity to a weakening in prices. In the event of a marked economic slowdown, a more relevant risk would be rising redundancies that could prompt an increase in defaults.
On a regulatory front, the Financial Conduct Authority (FCA) published its final report on its work on the motor finance market in March, following an update report a year earlier. Since the first report the FCA’s focus has been on the areas of greatest potential harm identified: (1) risks associated with the structure of commissions paid to brokers, in particular where this is related to the rate of interest charged; (2) the nature and timing of information given to customers; and (3) the efficacy of affordability assessments. As part of its work the FCA analysed loan data from 20 providers and carried out a mystery shopping exercise; S&U was one of these providers.
On commissions, Advantage operates a flat fee policy and is therefore not involved in the arrangements about which the FCA is concerned. On information provided to customers, Advantage has secured a Crystal Mark for its communications and notes that customers have to view an explanatory video prior to proceeding with a loan. Advantage’s affordability assessment has for some time been separate from the credit scoring process and uses online information in the first instance, which is then checked before a loan is made. Following the report, Advantage indicated that it was very comfortable with the conclusions reached by the FCA.
For Advantage the resilience of volumes in the used car finance market, while subject to economic risks, seems likely to sustain a high level of loan applications. The continuing work finetuning credit criteria and identifying an appropriate risk profile to achieve attractive returns should help the company to contribute to management’s aim of achieving steady sustainable earnings growth for the group. At Aspen the business is still at an early stage addressing a niche within a large and growing market. S&U points to a MINTEL survey that suggests bridging lending may grow from c £7.5bn per annum currently to over £10bn by 2021. The group’s conservative approach should ensure that growth is balanced, with a controlled approach to pricing and risk exposure in a market in which the level of competition can ebb and flow.
In the next section we set out changes in our estimates and the group’s financial position.
Financials
Changes in the headline numbers for FY20 together with new numbers for FY21 are shown below. The FY19 result was close to expectations and the changes in our FY20 forecasts are small. On our estimates, earnings per share growth would be 7% and 9% for the two forecast years.

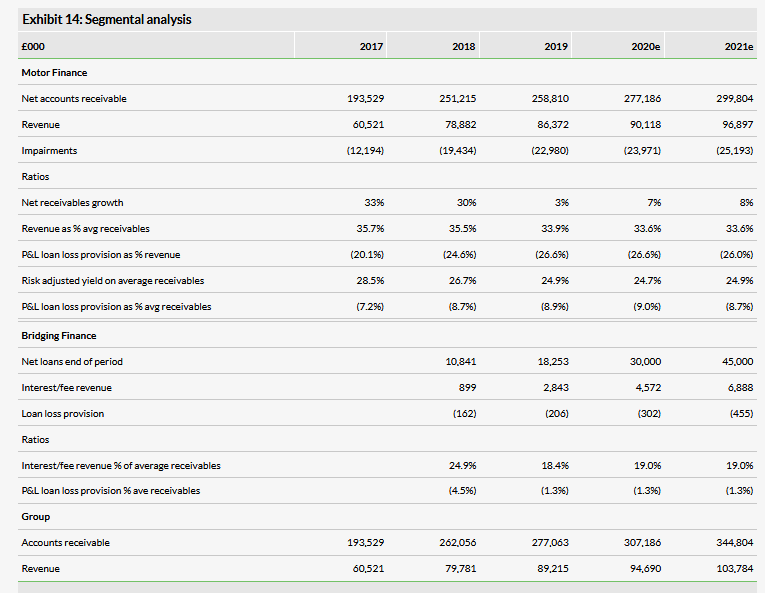
The next table gives details of our assumptions for the Advantage and Aspen businesses. In the motor business we have allowed for receivables growth of 7% and 8% for FY20 and FY21, respectively, and look for a similar percentage level of impairments followed by a decline. Bridging receivables are assumed to reach £30m in the current year followed by £45m.
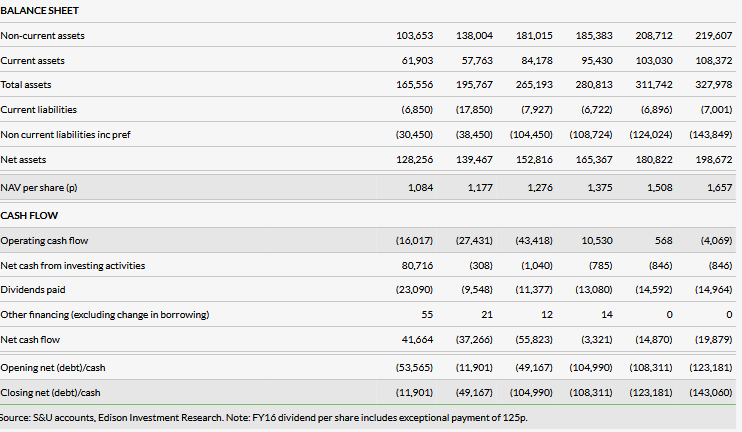
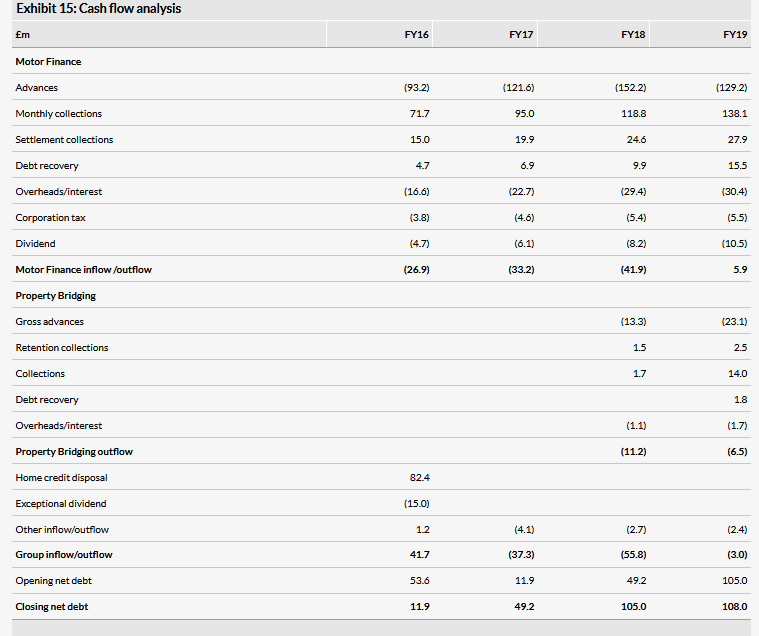
The segmental cash flow analysis below highlights the major turnaround in cash flow at Advantage as growth has slowed. The business has therefore performed exactly as would be expected, with collections rising strongly from receivables growth in earlier periods and lower advances resulting in the FY18 cash outflow of £42m turning into an inflow of £6m for FY19. Aspen property bridging absorbed £6.5m, which was down on the prior year’s £11m as collections built from a low level. At the group level this left net debt only modestly higher at £108m compared with £105m. Following the year end, committed funding facilities have increased from £135m to £160m through a £25m five-year revolving facility from RBS (LON:RBS), which provides additional headroom. On our estimates, net debt could rise to c £143m by end FY21 with net debt/equity at 72%.
Valuation
We have updated our peer comparison table, which includes a selection of companies that are involved in non-standard lending or have motor lending as one of their activities. This shows S&U trading on below-average prospective P/E multiples, while the price to book ratio is just below the average despite a return on equity noticeably above the average. The yield is also above average.
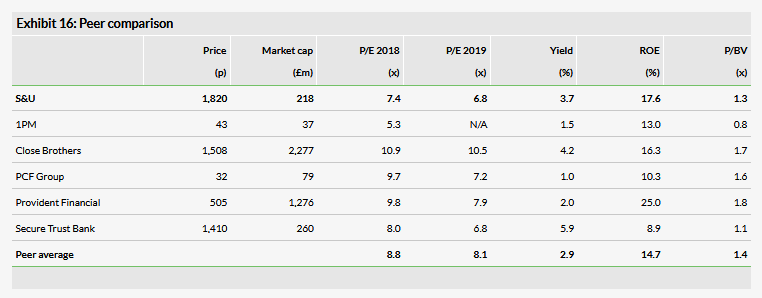
Turning to our ROE/COE model (with unchanged assumptions of a cost of equity of 10% and growth of 4%) and using it to deduce the return on equity assumed by the market at a share price of 1,820p gives a value of 12%. This appears cautious in the context of the return of 17.6% recorded last year and our estimates, which are above 17% for both FY20 and FY21. Factoring in a return on equity of 17%, as in our last note, would give a value of 2,980p compared with 2,800p previously (reflecting the NAV increase of 6.4% since the end of H119). This value would give a prospective P/E of 12x, which would seem ambitious in the context of the peer multiples shown above, but even putting S&U on the average 2019 P/E multiple would still point to c 13% upside.
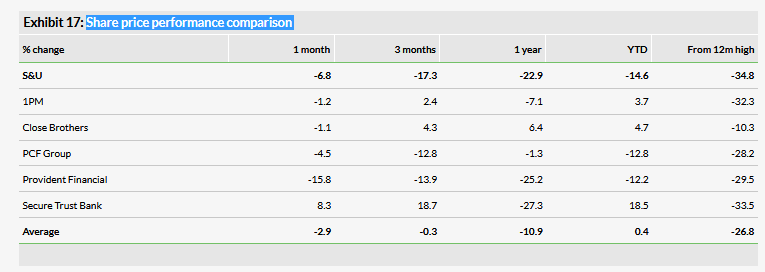
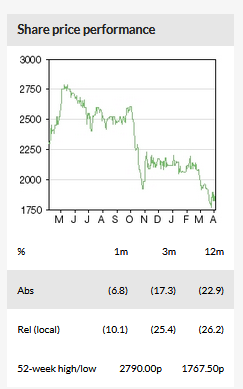
For reference we include a table showing the recent share price performance for the same peer group in Exhibit 17. This shows that S&U shares have underperformed the peers over all the periods shown. We acknowledge that new business expectations for Advantage have been tempered (we reduced our FY20e EPS by 4.7% in February), but the still-healthy ROE in prospect on our estimates and the valuation comparison above suggest that the relative price weakness may provide an interesting opportunity.
