In our exploration of the recent U.S. dollar rally and what it may be reacting to in relation to the current U.S. stock market highs and continued rally, we explore some of the underlying factors that are translating into U.S. dollar strength while the U.S. stock market continues to push higher.
In the first part of this research article, we highlighted the U.S. dollar reaction to the 2008-09 credit market crisis and how the U.S. dollar actually started to bottom/rally in early 2008 – just as the rollover top in the U.S. stock markets continued to setup. The way the U.S. dollar reacts to stress factors in the global markets is to strengthen as a safe haven, as capital is constantly seeking the best environment for investment and profits. When the markets enter a period of turmoil, the U.S. dollar typically begins to strengthen before the global markets really begin to react to the fear or turmoil.
The recent news of large financial institutions and hedge funds taking large losses and closing operations is somewhat similar to the Lehman event of 2008. These types of larger corporate debt collapses have wide-range global market effects. Sometimes, these events can ripple into other global corporations that engaged in this level of financing or credit functions. For example, Credit Suisse (SIX:CSGN)'s attempt to recoup potential losses from the Greensill collapse may be a very complicated and fruitless process, according to a recent Wall Street Journal article.
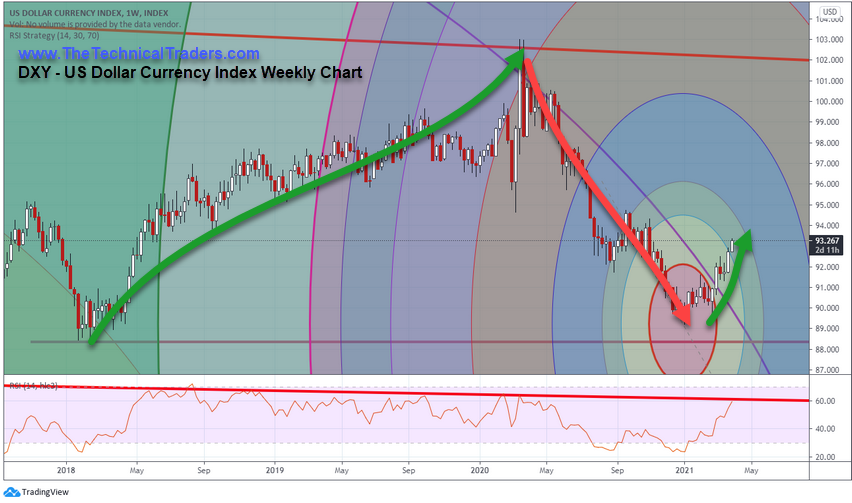
Weekly U.S .Dollar Shows Uptrend Starting
The current U.S. dollar weekly chart, below, shows how the U.S. dollar has strengthened over the past three months and how this current uptrend aligns with the $89 lows from early 2018. One of the most interesting aspects of this chart is the peak in early 2020, as the COVID-19 virus market collapse bottomed, which was followed by an extended decline. As mentioned earlier, the U.S. dollar acts as a safe haven during times of uncertainty and chaos. Obviously, the initial COVID-19 market selloff prompted quite a bit of uncertainty and chaos, prompting the U.S. dollar to rise nearly 9% in just two weeks. Does the current upside trending in the U.S. dollar translate into more uncertainty and chaos in the markets?
The recent bottom on this weekly U.S. dollar chart happened on Jan. 6, 2021. This was the day Congress certified the U.S. state electors. It was also the day that chaos took place in Washington, DC. From that point onward, the U.S. dollar began a decidedly upward price trend. Since that low on Jan. 6, the U.S. dollar has risen more than 4.60%. Over that same time, the SPDR® S&P 500 (NYSE:SPY) has rallied more than 7.5%, which obviously fails to show any U.S. or global market concerns.

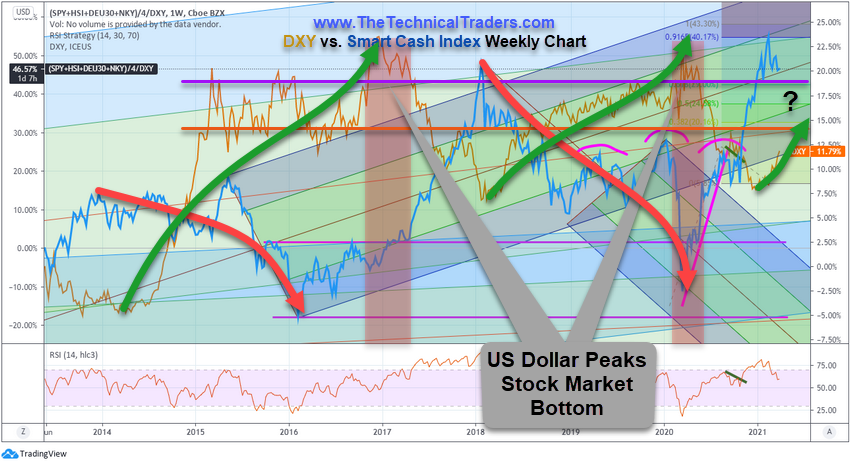
Weekly Smart Cash Versus U.S. Dollar Correlations
The following chart shows the U.S. dollar (as a GOLD line) and our Custom Smart Cash Index (as a BLUE line) and highlights the threshold of the U.S. dollar that usually prompts a breakdown in price in the stock market. The ORANGE threshold level on this chart for the U.S. dollar is 94.10 and the PURPLE threshold level on this chart 99.50. Once the U.S. dollar reaches levels above the ORANGE threshold, the SPY becomes much more volatile and tends to retrace lower over time. Once the U.S. dollar reaches above the PURPLE threshold, it appears the U.S. dollar reaches major resistance, stalls, and contracts, which prompts a fairly large upside price trend in the SPY.

Currently, the U.S. Dollar Index is trading just above 93.00 and it just 1.1 away from the ORANGE threshold. Should the U.S. dollar continue to rally over the next few weeks and months, our research suggests the U.S. stock market will enter a period of increased volatility with broad sector trending/rotation. As you can see on this chart, near the end of 2018, the U.S. Dollar Index rallied above the ORANGE threshold, while the Custom Smart Cash Index entered a period of extended price volatility (2019 through the COVID-19 bottom in 2020). Once the U.S. Dollar Index fell back below the ORANGE threshold (July/August 2020), the Custom Smart Cash Index began to rally extensively.
The current rally in the U.S. stock market will likely continue until the U.S. Dollar Index moves comfortably over the ORANGE threshold, there is a strong possibility the U.S. stock market will enter a period of extended volatility and trending. That means that the current bullish price trend may enter a broader rally phase – targeting a new excess phase peak. Or, it may shift into more of a sideways price trend with a broad range of price rotation – like what happen in 2015 to 2016.
Interestingly enough, near the end of 2016, as the U.S. stock market bottomed and began to rally, the sectors that lead that rally included precious metals, miners, utilities, regional banking, and technology (later in 2017). This suggests we need to watch metals and miners as well as utilities and regional banking sectors later in 2021.
Currently, the leading sector trends are Real Estate, REITs, U.S. Financials, Global Infrastructure, Global Natural Resources, Technology, Consumer Services, and Aerospace and Defense. These leading sectors suggest many traders/investors believe the next few years will be filled with various advantages in technology, raw materials, consumer activities and infrastructure/defense spending. Get ready for some really big trends in various sectors and be prepared to jump into some of these bigger trends.
