134,000. The September job gains disappointed. But the unemployment rate dropped to 3.7 percent. And there was a sharp sell-off in China’s stock market. What does it all mean for the gold market?
Job Creation Disappoints, but Unemployment Rate Sinks to Record Low
U.S. nonfarm payrolls slowed down in September. The economy added just 134,000 jobs last month, following a rise of 270,000 in August (after an upward revision). However, the weak headline number was accompanied by hugely positive revisions in July and August. With those, employment gains in these two months combined were 87,000 higher than previously reported. In consequence, after revisions, job gains have averaged 190,000 per month over the last three months, or 208,000 through the first nine months of 2018, still significantly above the level needed for a gradual tightening of the labor market.
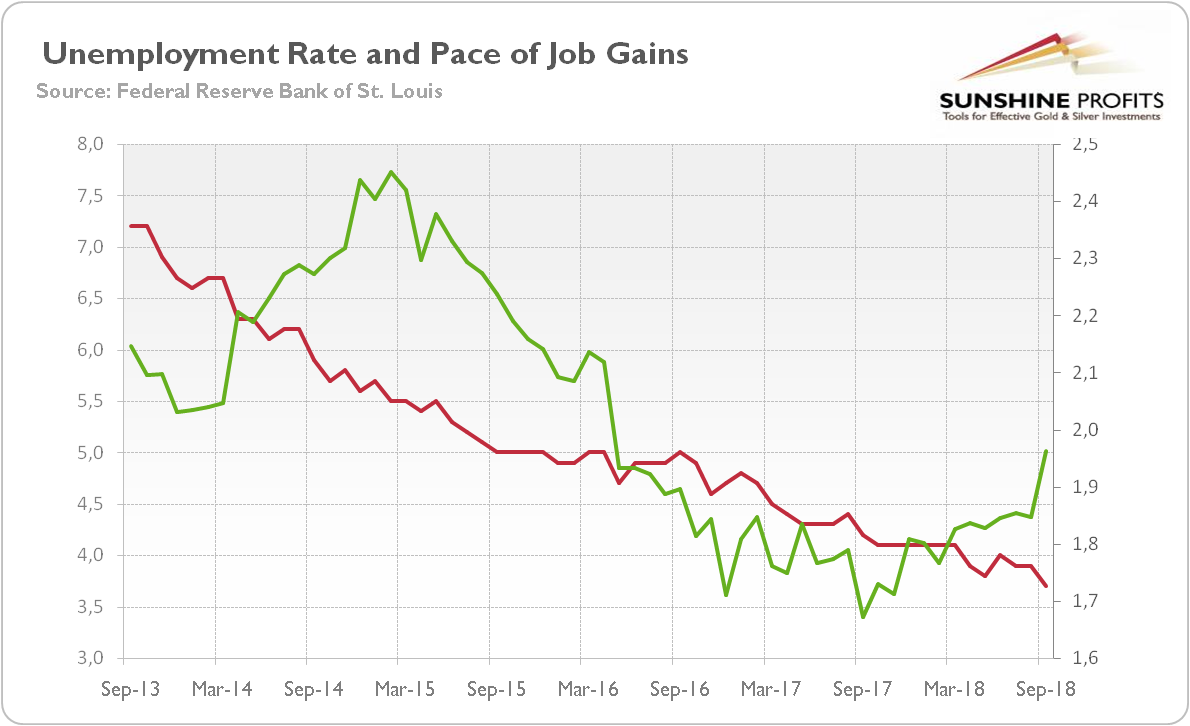
The gains were significantly below the expectations, perhaps reflecting the effects of Hurricane Florence, which affected parts of the East Coast in September. The job creation was widespread, but the most impressive gains occurred in professional and business services (+54,000), and in transportation and warehousing (+24,000). On the contrary, retail trade (-20,000) and leisure and hospitality (-17,000) cut jobs in September. Although the job creation disappointed in September, the annual pace of job creations increased actually in September, as the chart below shows.
Chart 1: U.S. unemployment rate (red line, left axis, U-3, in %) and total nonfarm payrolls percent change from year ago (green line, right axis, % change from year ago) from September 2013 to September 2018.

The chart also displays the unemployment rate. As one can see, it sank by 0.2 percentage point to 3.7 percent, the lowest level in 48 years. Importantly, both the labor force participation rate and the employment-population ratio were little changed, so the decline in the jobless rate did not result from the discouragement of the jobseekers. The average hourly earnings for all employees on private nonfarm payrolls rose by 8 cents to $27.24. It implies that they increased 2.8 percent over the year, slightly slower than last month. However, the economists expect that the growing competition for a shrinking pool of available workers will finally boost wages in the near future.
Implications for Gold
Despite the weak headline job gains, the September edition of the Employment Situation Report was strong. The payrolls were probably affected by the hurricane, while the last time the unemployment rate was lower was in December 1969. All that means that the US labor market remains solid, driving the whole economy. Thus, the FOMC should stay on track to continue gradually raising interest rates, with the next hike in the federal funds rate likely to come in December.
Hence, gold should remain under downward pressure, especially given the current developments in Europe. Yesterday, Italy’s Deputy Prime Minister Matteo Salvini said that the government would not cave in to market pressure and backtrack on its plans to increase deficit spending next year. Italy’s turmoil should strengthen the US dollar against the euro. Similarly, a sharp sell-off in China’s stock market helped the greenback to appreciate against its major peers. In a response, the PBOC eased its monetary policy. The widening divergence between the yuan and the US dollar is bearish for gold.
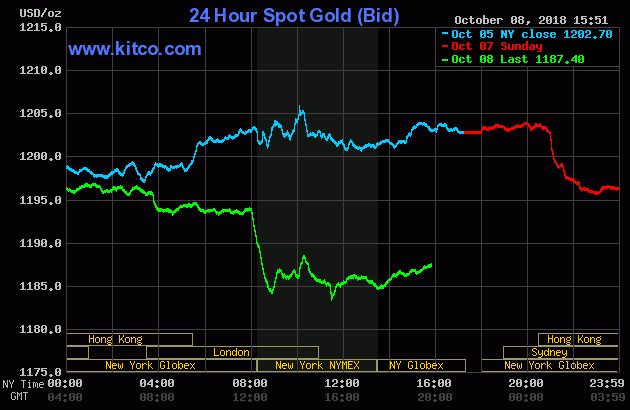
Chart 2: Gold prices from October 5 to October 8, 2018.

Indeed, as the chart above shows, the price of the yellow metal declined yesterday from about $1,195 to $1,185. The fact that the yellow metal, which is considered as the ultimate safe-haven asset, did not benefited from an uptick in risk aversion, is rather worrisome for the gold bulls.
Disclaimer: Please note that the aim of the above analysis is to discuss the likely long-term impact of the featured phenomenon on the price of gold and this analysis does not indicate (nor does it aim to do so) whether gold is likely to move higher or lower in the short- or medium term. In order to determine the latter, many additional factors need to be considered (i.e. sentiment, chart patterns, cycles, indicators, ratios, self-similar patterns and more) and we are taking them into account (and discussing the short- and medium-term outlook) in our trading alerts.
