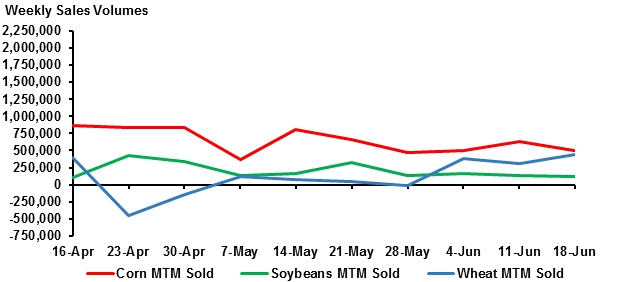
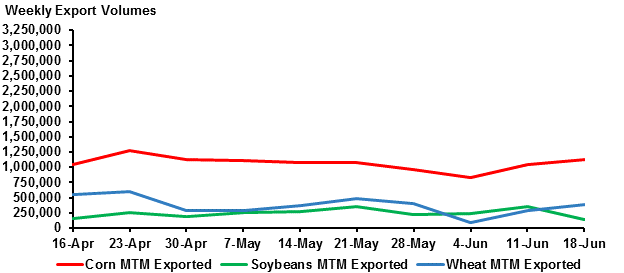
Corn exports continued to rise this week behind greater demand from Japan, receiving more than 40% of the total corn exported last week. Soybean exports decreased significantly as Chinese demand for U.S. soybeans has softened. The strong U.S. dollar has made Brazilian and Argentine soybeans more attractive to importers. Corn sales decreased due to significant returns from unknown destinations. Soybean sales also decreased behind heavy Chinese returns. Wheat sales increased.
Crop traders and farmers are anxiously awaiting the release of the USDA Stocks and Acreage report on June 30. Analysts have reported both bearish and bullish expectations for the report. The bears are leaning on the expectation that corn stocks will be very high, while the bulls are hoping that the acreage information will reflect lower planted area than what was released in the March 31st report. The acreage surveys conducted require entries to be submitted by June 1, so all of the Prevent Plant acres elected in June will not be reflected in the report.
Weekly net corn sales for the 2014/15 marketing year were 496,900 metric tons (MT), a 21% decrease from last week and a 24% decrease from the prior 10-week average. Increases were reported from Japan, South Korea, Colombia, and Taiwan. Decreases were reported from unknown destinations, the French West Indies, New Zealand, and Jamaica. Exports were 1,126,000 MT, an 8% increase from last week and an 8% increase from the prior 10-week average. The primary destinations were Japan, Mexico, South Korea, Colombia, and Taiwan.
Weekly net soybean sales for the 2014/15 marketing year were 118,800 MT, an 11% decrease from last week and a 40% decrease from the prior 10-week average. Increases were reported from Mexico, unknown destinations, Japan, and Pakistan. Decreases were reported from China, Israel, Costa Rica, Taiwan, and Cuba. Exports were 150,000 MT, a 58% decrease from last week and a 48% decrease from the prior 10-week average. Primary destinations were Mexico, Japan, and Taiwan.
Weekly net wheat sales for the 2015/16 marketing year were 434,300 MT, a 38% increase from last week. Increases were reported from Taiwan, Mexico, Japan, Nigeria, and Italy. Decreases were reported from Barbados and South Korea. Exports were 388,300 MT, a 36% increase from last week. Primary destinations were Italy, South Korea, Taiwan, Mexico, Peru, and Nigeria.

Source: USDA Foreign Agricultural Service

Source: USDA Foreign Agricultural Service
The data for the report was taken from the June 25, 2015 USDA Export Sales report for the week ending June 18, 2015. The information reported is an aggregate of sales and exports data reported to the USDA Foreign Agriculture Service.
