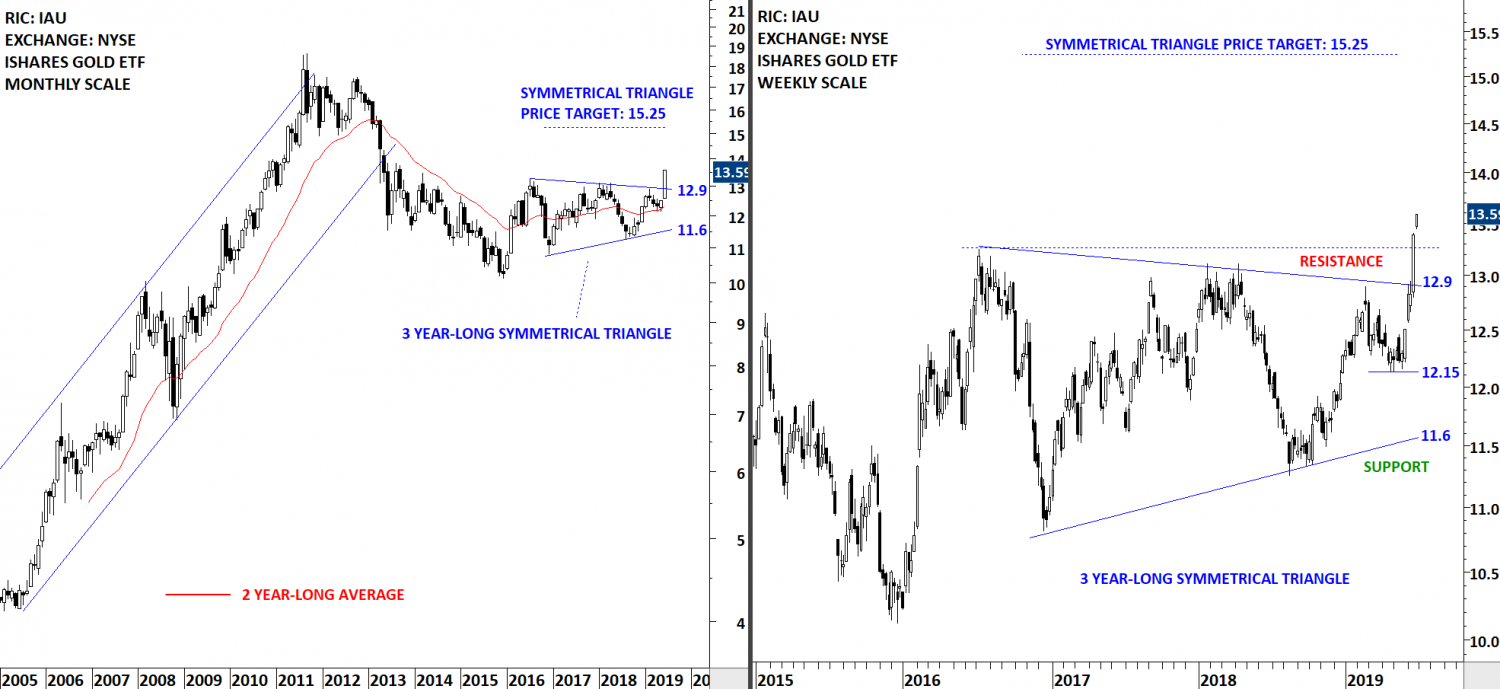
Every week Tech Charts Global Equity Markets report features some of the well-defined, mature classical chart patterns under a lengthy watchlist and the chart pattern breakout signals that took place during that week. Global Equity Markets report covers single stocks from developed, emerging and frontier markets, ETF’s and global equity indices. The report starts with a review section that highlights the important chart developments on global equity benchmarks. This blog post features from the review section the iShares GOLD ETF (NYSE:IAU), listed on the New York Stock Exchange.
The IAU, listed on the NYSE, had a strong breakout from its 3 year-long consolidation, possibly a symmetrical triangle. Upper boundary of the consolidation was acting as resistance at 12.9 levels. Previous resistance becomes the new support. During any pullback the upper boundary at 12.9 levels will act as support. Possible chart pattern price target stands at 15.25 levels. (Data as of 24/06/2019 5:00pm EST)

