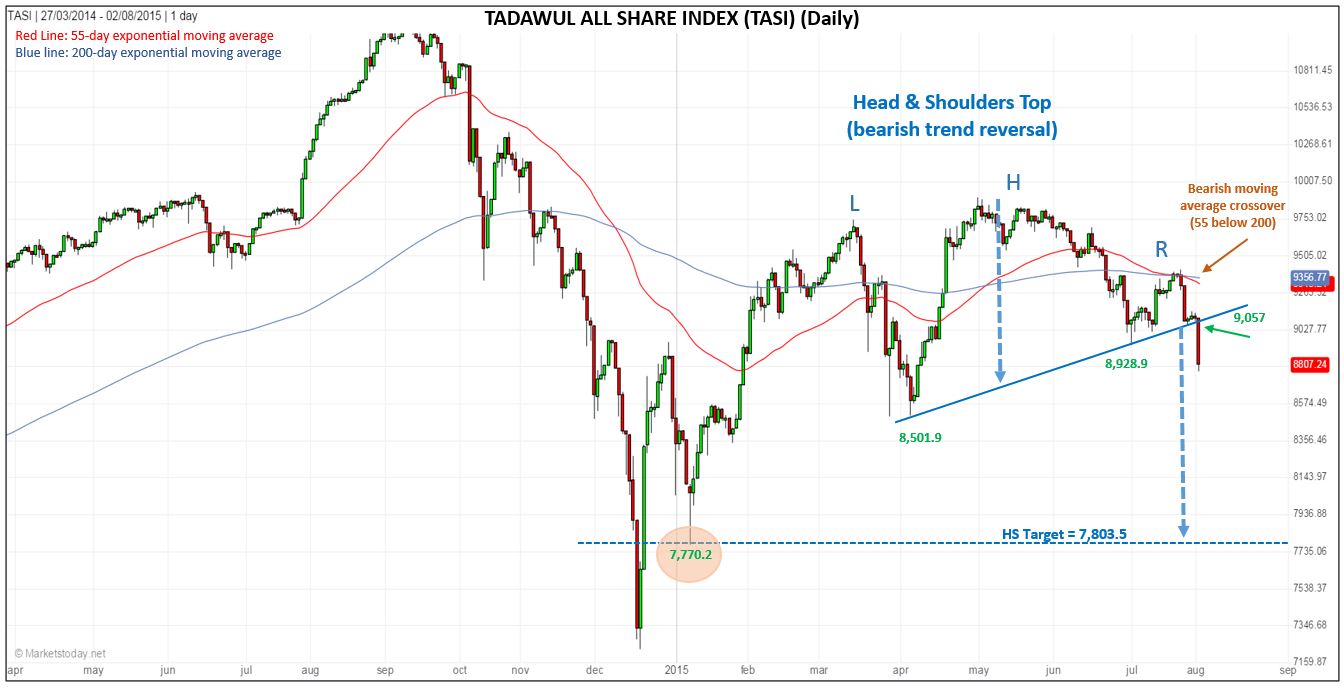
A bearish head and shoulders top formation (HS) was triggered today on the Tadawul All Share Index (TASI), with the index falling 3.20 percent to end the day at 8,807.24. The bearish trigger was on a move below the neckline at 9,057. Momentum picked up on the way down, with the index closing in the bottom quarter of the day’s range.

An additional bearish signal was given on today’s drop below previous support at 8,928.27, triggering a continuation of the short-term down trend. Last week, the shorter 55-day exponential moving average (ema) crossed below the longer 200-day ema, providing an early warning that selling pressure could intensify. The 55-day spent the past two months above the 200-day ema (bullish) after staying below it since mid-December 2014.
The target from the HS pattern is approximately 7,803.50, right in the area of support at 7,770.2 seen during a spike low on January 6th of this year. Together, this creates an eventual high probability target zone from around 7,803 to 7,770.

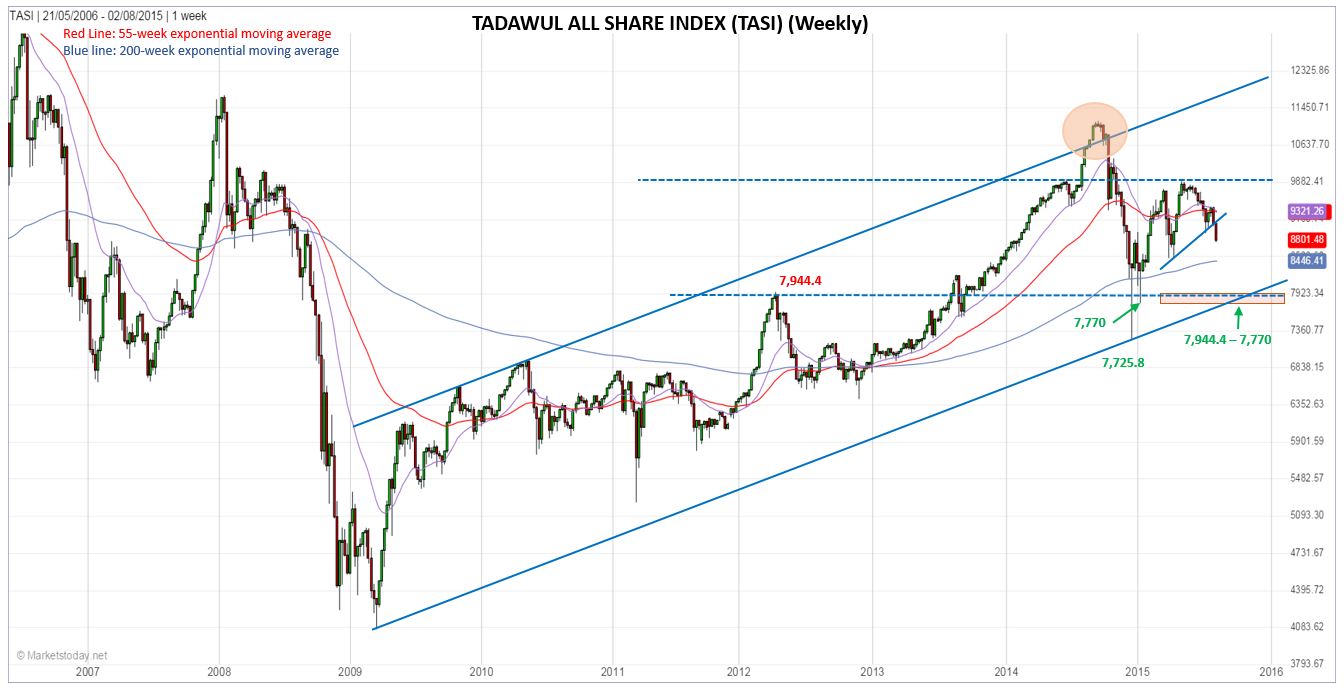
This target zone can be expanded slightly when taking into account the larger view as seen in the enclosed weekly chart. We can add in previous resistance (now potential support) from the swing high in 2012, which was at 7,944.4. In addition, the long-term uptrend channel line converges with the above price areas, giving further support to the chance that a decline will be held at or above the 7,944 to 7,770 price zone. (www.marketstoday.net)
