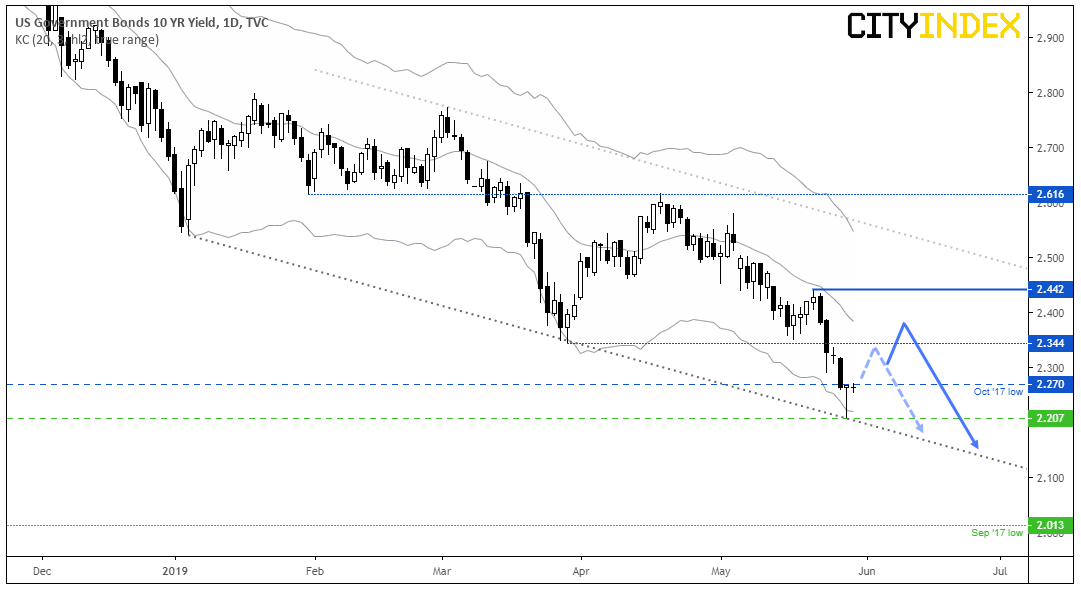
Risk-off has taken centre stage again this week, yet the U-turn reversal on yields suggests a corrective bounce could be due and provide a sympathy bounce for markets.

By yesterday’s low, the U.S. 10-Year had fallen to its lowest level since September 2017 whilst global equity markets fell in tandem and demand for safe-haven assets were on the rise. However, given the U-turn recovery late session there is clearly support at 2.2%. Furthermore, a bullish pinbar tested the lower bound of a bearish channel and has reversed back inside its lower Keltner band (3x ATR width) to suggest the US10Y could be in for a near-term technical bounce, before losses resume. Of course, we need to see prices confirm this, but if soured sentiment takes a breather there’s a couple of markets worth watching.

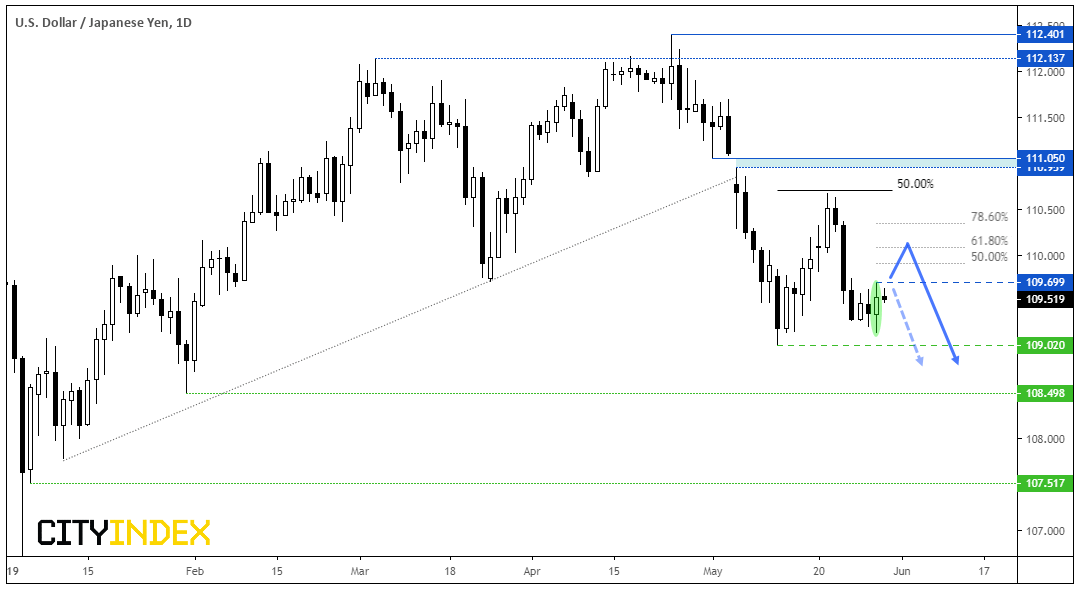
AUD/JPY and USD/JPY are the only two yen pairs that didn’t break to new lows this past week, which makes them both ripe for a bounce if yields rise.
- Of the two, USD/JPY appears the more technically compelling, given it failed to retest 109.02 and printed a bullish outside candle yesterday.
- Intraday traders could consider bullish setups with a break above 109.70 and consider Fibonacci retracement levels as targets.
- However, given bearish momentum remains dominant from the 112.40 high, bears could seek to fade into weakness below Fibonacci levels.

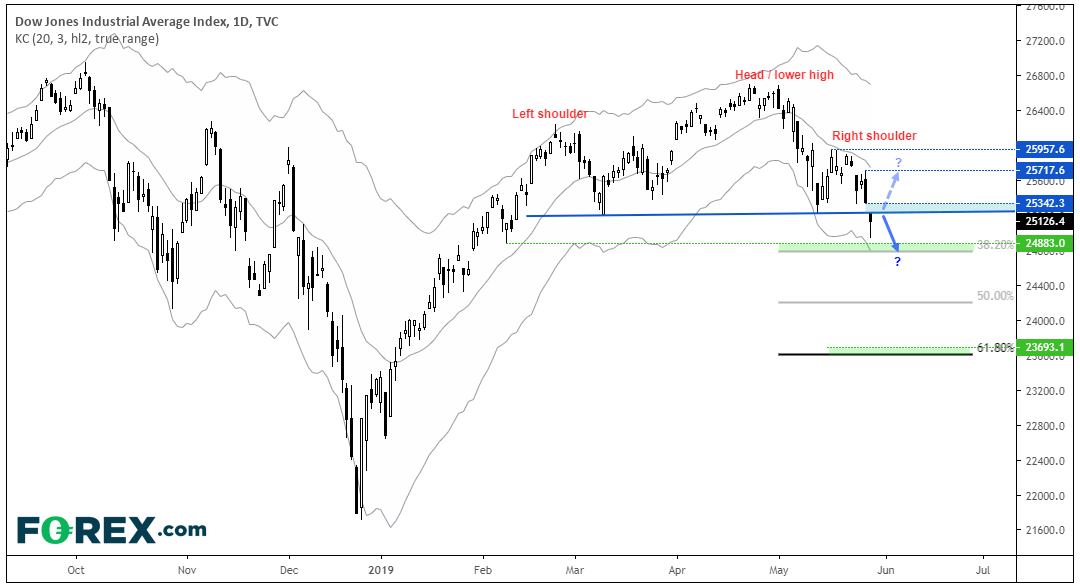
Yesterday,DJIA broken beneath its necklineto confirm a bearish head and shoulders reversal. Naturally, a bounce in yields could be supportive of stocks, so we should keep a close eye on how prices reaction around the neckline.
- If the neckline holds as resistance, bears could look to fade into moves below the neckline for a swing trade short. Bearish targets can be found near the Fibonacci levels, and the head and shoulders target is just above the 61.8% level.
- However, if we see prices break the neckline and trade above the gap, it warns to a fakeout and prices could rebound quite strongly. Bullish targets include the 25,718 and 29,958 highs.
- Obviously, for the bullish scenario to work we’d need to see some solid news surrounding the trade war along with domestic data (keep an eye on US GDP tonight).
