Gold moved visibly higher during the first session of the year and this time mining stocks accompanied it. In fact, it seems that they are back on the track after a short pause. What’s the likely reason behind this year’s rally and what does it imply going forward?
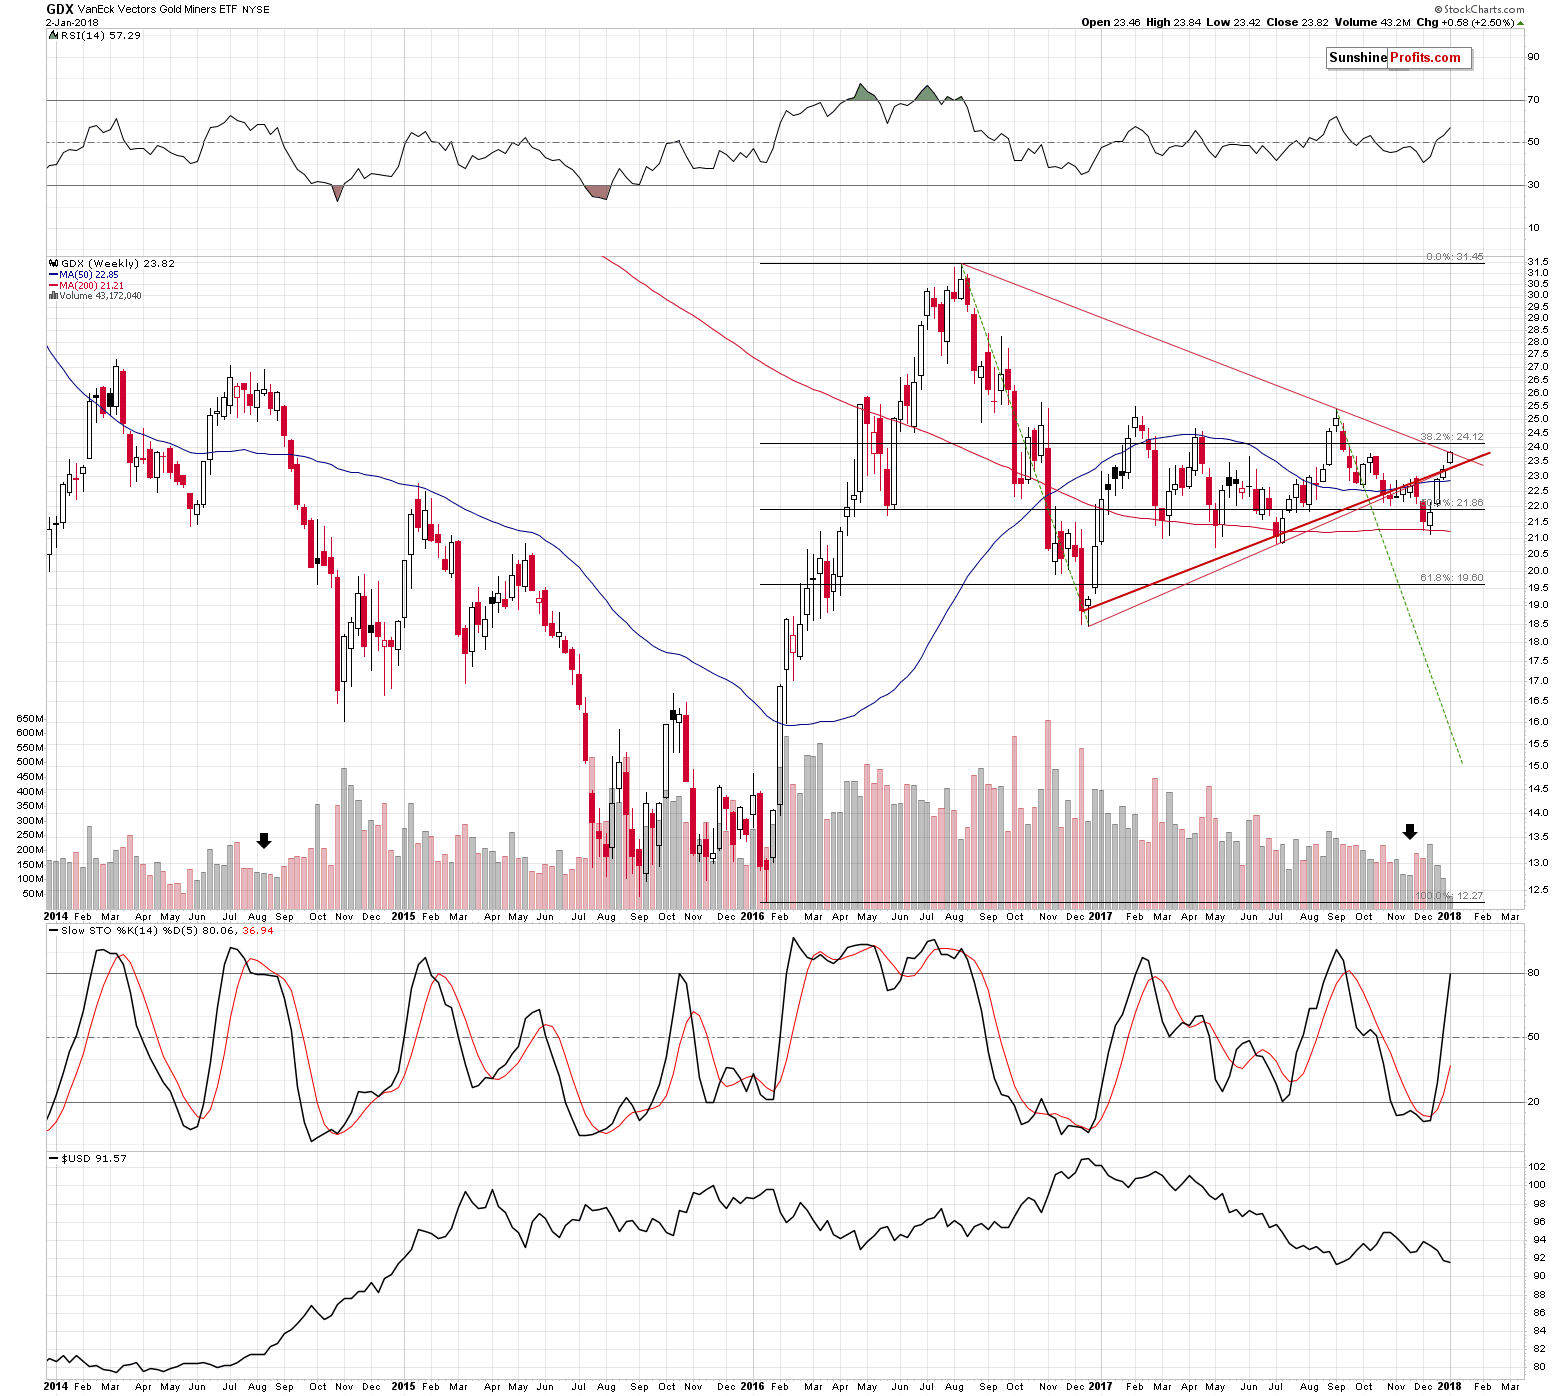
Let’s jump right into the mining stock charts (chart courtesy of http://stockcharts.com).

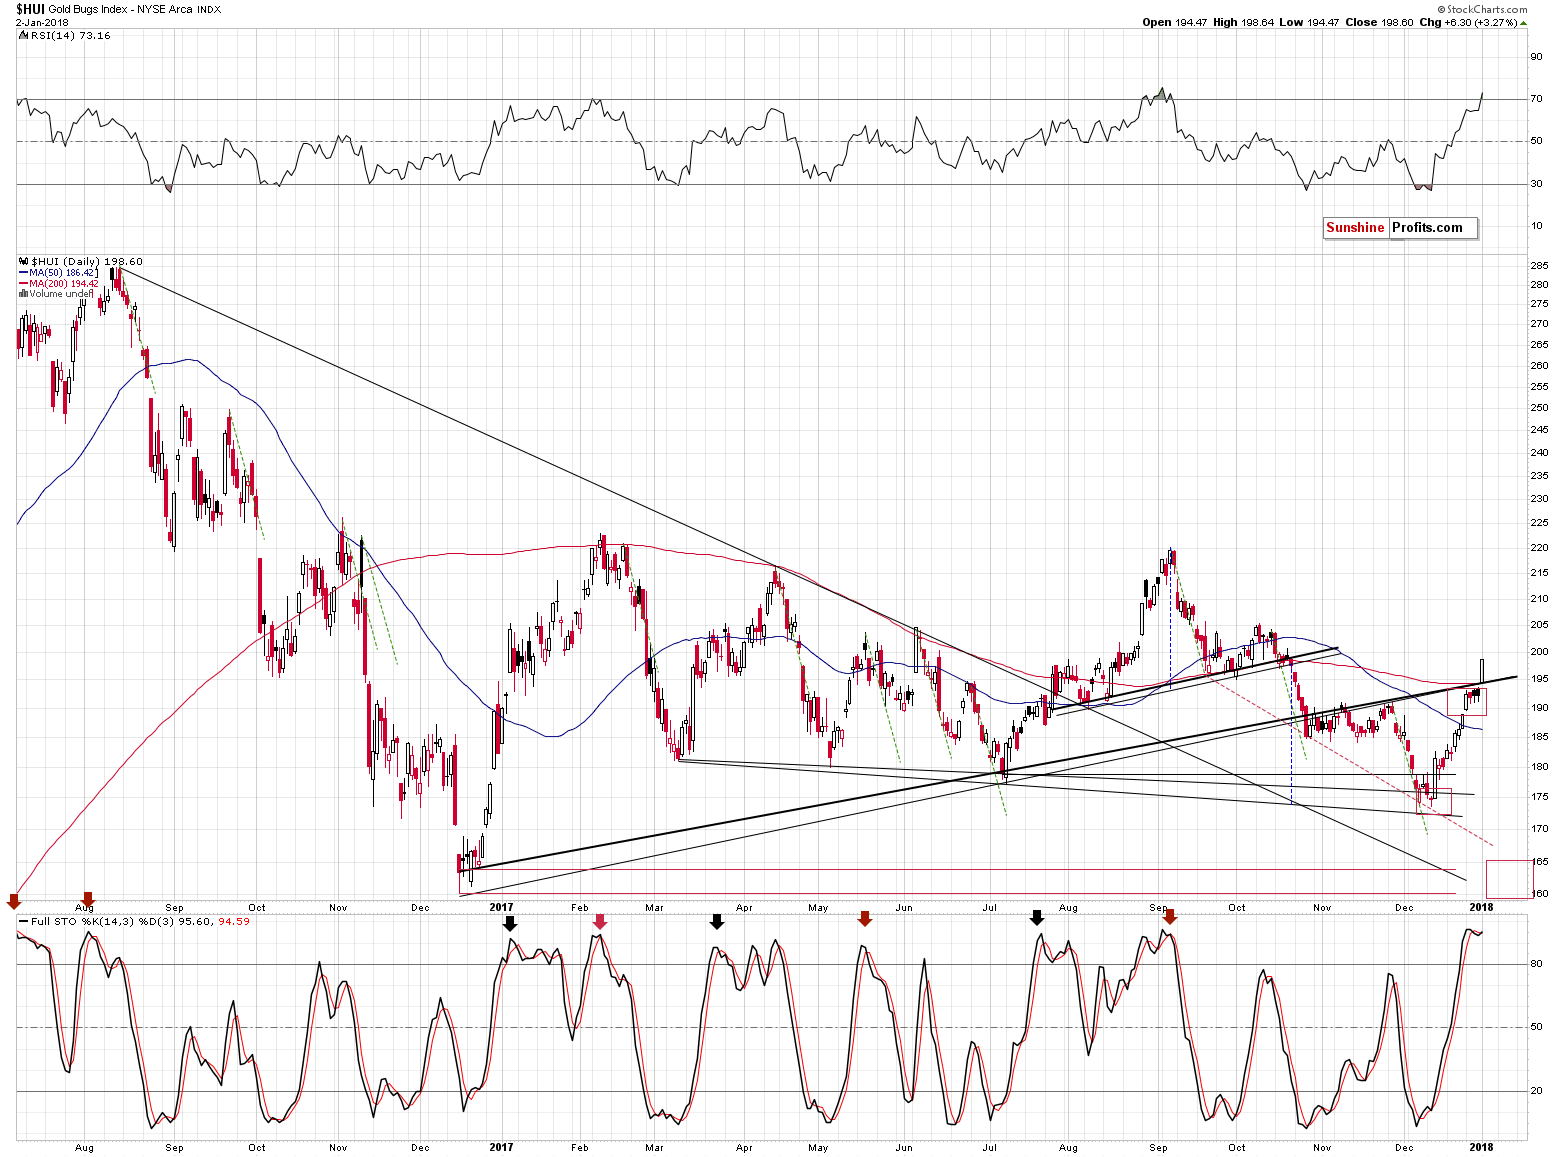
Gold stocks indeed broke above the rising support lines, but since that was only one close above them, the breakout is unconfirmed. There are several reasons to think that it will not be confirmed without even considering the apex-based reversal or gold’s cyclical turning point.
The two things that we would like to discuss with regard to the above chart are: the 200-day moving average, and the RSI above the 70 level.
The former was broken rather insignificantly and this doesn’t invalidate the bearish analogy to the previous similar patterns. For instance, in February, the day when the HUI Index closed above the 200-day MA was the day of the final top. In fact, higher HUI values have never been seen since that time. The June rally also ended above the MA, but the follow-up action was very bearish.
As far as the second factor is concerned, there was only one case in the previous months, when the RSI indicator moved as high as it did yesterday - in early September. Mining stocks started an almost 50-index point-decline shortly thereafter.
Moreover, the moments when the RSI moved only to 70 level, without breaking above it, were almost always times when it was a good idea to be short the precious metals market. July 2016, February 2017, and the August-September 2017 top were all confirmed by the RSI at or above the 70 level. Naturally, the implications are bearish.

Plus, while the rising support line was broken (again, the breakout was not confirmed), the declining, even more long-term line, held. So, did we really saw a major breakout yesterday that changed the outlook? Not necessarily.
The key reason why we shouldn’t trust yesterday’s move is not visible on the above charts.

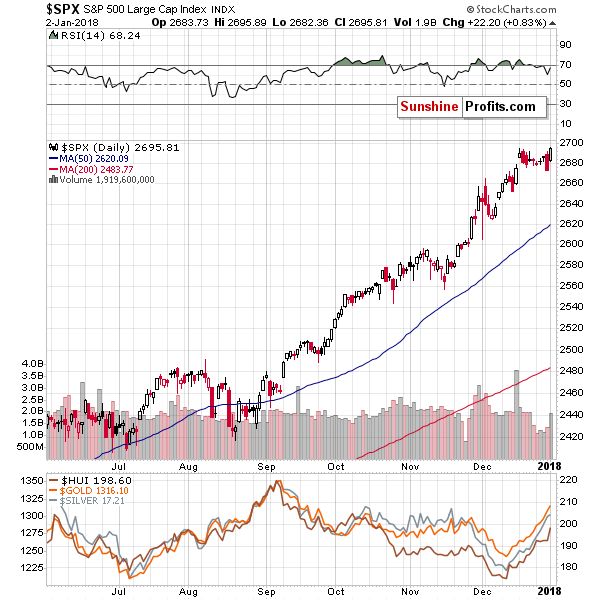
It’s partially visible on the general stock market chart. In fact, it’s the likely reason that all stocks soared yesterday, not just miners. The reason is selling during the year or at its end due to tax reasons and then buying back at the beginning of the year. In this way, investors are able to book the losses, which often leads to a decrease in one’s taxes on investments. Those who want to keep the exposure to a given stock, often buy back in the first day of the following year.
Consequently, yesterday’s “strength” in mining stocks is likely no strength at all – it’s likely just a result of applying one of the tax-optimizing investment ideas.

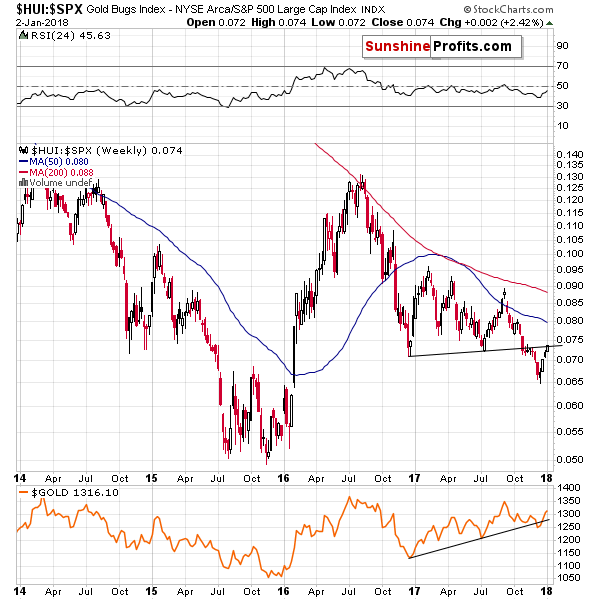
The above chart showing the golds stock ratio to the general stock market shows that there was no major breakout yesterday. Why? Because by looking at the ratio, we’re looking at the chart that “takes out” the factors that impact the entire stock market in the same way. In math, when we do the same multiplication for the numerator and the denominator of a faction, we are left with the same fraction. So, since there was no major move in the ratio, it seems that the same thing caused the rally in both markets and thus, what we saw yesterday was not a sign of strength in the precious metals sector.
Summing up, even though it seems that this year’s daily rally was a big deal, it most likely isn’t. There is a good explanation for mining stocks upswing in the form of the tax-optimizing technique. In other words, miners didn’t really show strength this week and the outlook for gold price in January didn’t really improve.
