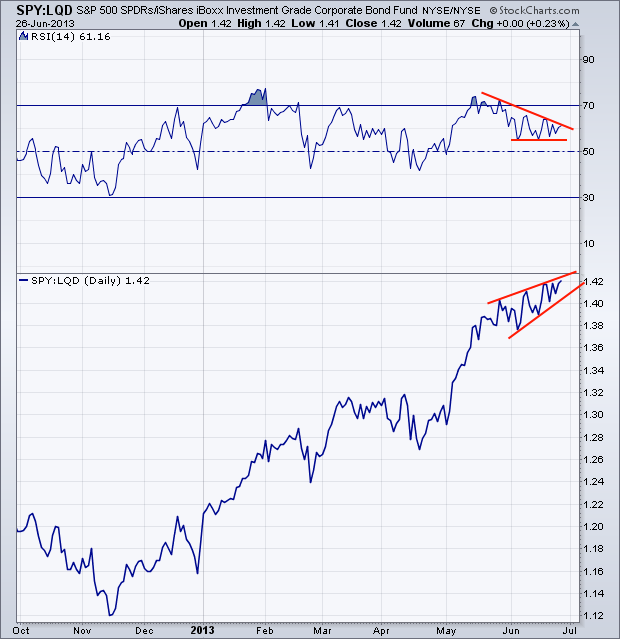
Well it seems Mr. Market has been able to regain the important 1600 level in the S&P (SPX), likely giving a little confidence boost to equity bulls. Things also appear to be fairly strong, this morning, as the e-minis hit higher highs before the opening bell. As stocks regain their footing I wanted to bring up this ratio chart of S&P 500 SPDRs (SPY) and the iShares Investment Grade Corp. Bond ETF (LQD). During the short correction we saw bonds tumble right alongside equities, which is something we don’t see happen very often. During the month of June we can see in the chart below, SPY has been trekking higher, slowly hitting higher highs in relative performance against its bond buddy LQD. However, it’s not all roses and sunshine as we can see in the top panel. The Relative Strength Index (tired of me talking about the RSI yet?) has been diverging -- hitting lower highs.
What's Different?
So we have an interesting setup taking place. I’ve put in some rough trend lines on both the momentum indicator as well as the ratio of stocks vs. investment grade bonds. Going forward, we'll see if RSI can breakout from its falling trend line, restoring confidence in equities outperformance of corp. bonds. In a ‘normal’ market, something like this would be a warning flag to a continued risk-on rally, but with the potential changes in Fed action, many traders are beginning to wonder -- is this time different? We shall see.
Disclaimer: Do not construe anything written in this post or this blog in its entirety as a recommendation, research, or an offer to buy or sell any securities. Everything in this post is meant for educational and entertainment purposes only. I or my affiliates may hold positions in securities mentioned in the blog. Please see my Disclosure page for full disclaimer. Connect with Andrew on Google+, Twitter, and StockTwits.
- English (UK)
- English (India)
- English (Canada)
- English (Australia)
- English (South Africa)
- English (Philippines)
- English (Nigeria)
- Deutsch
- Español (España)
- Español (México)
- Français
- Italiano
- Nederlands
- Polski
- Português (Portugal)
- Português (Brasil)
- Русский
- Türkçe
- العربية
- Ελληνικά
- Svenska
- Suomi
- עברית
- 日本語
- 한국어
- 简体中文
- 繁體中文
- Bahasa Indonesia
- Bahasa Melayu
- ไทย
- Tiếng Việt
- हिंदी
Stocks vs. Corporate Bonds
Latest comments
Loading next article…
Install Our App
Risk Disclosure: Trading in financial instruments and/or cryptocurrencies involves high risks including the risk of losing some, or all, of your investment amount, and may not be suitable for all investors. Prices of cryptocurrencies are extremely volatile and may be affected by external factors such as financial, regulatory or political events. Trading on margin increases the financial risks.
Before deciding to trade in financial instrument or cryptocurrencies you should be fully informed of the risks and costs associated with trading the financial markets, carefully consider your investment objectives, level of experience, and risk appetite, and seek professional advice where needed.
Fusion Media would like to remind you that the data contained in this website is not necessarily real-time nor accurate. The data and prices on the website are not necessarily provided by any market or exchange, but may be provided by market makers, and so prices may not be accurate and may differ from the actual price at any given market, meaning prices are indicative and not appropriate for trading purposes. Fusion Media and any provider of the data contained in this website will not accept liability for any loss or damage as a result of your trading, or your reliance on the information contained within this website.
It is prohibited to use, store, reproduce, display, modify, transmit or distribute the data contained in this website without the explicit prior written permission of Fusion Media and/or the data provider. All intellectual property rights are reserved by the providers and/or the exchange providing the data contained in this website.
Fusion Media may be compensated by the advertisers that appear on the website, based on your interaction with the advertisements or advertisers.
© 2007-2025 - Fusion Media Limited. All Rights Reserved.
