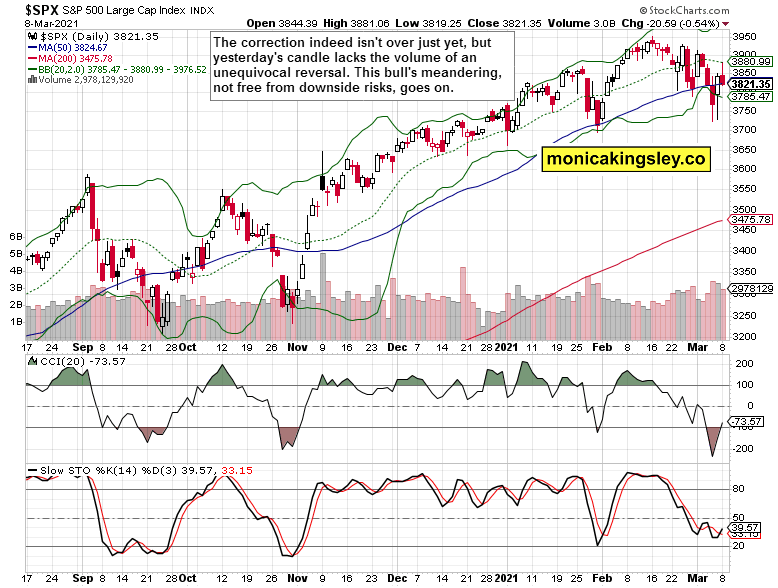
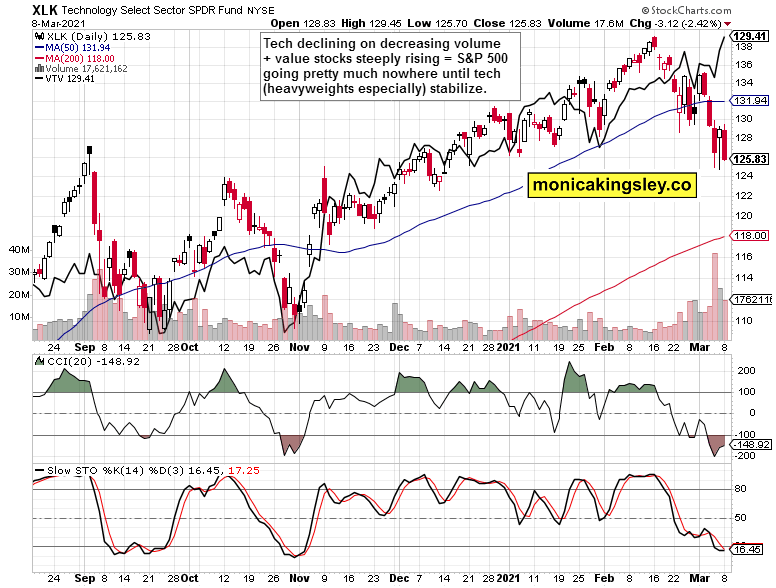
Stocks spiked higher, but not before going sideways then down on the day. Does it count as a reversal? In my view, we haven't seen one yesterday really, regardless of this correction not being over just yet. There are still some cracks, like the worrying corporate bonds performance, manifest in the HYG:SHY ratio, and the tech sector searching for the bottom.
Quoting from yesterday‘s extensive analysis spanning beyond stocks, metals and the Fed:
(…) Stocks have had a great run over the past four months, getting a bit ahead of themselves in some aspects such as valuations. Then, grappling with the rising long-term rates.
Inflation expectations are rising, but not galloping yet. What to make of the rising rates then? They're up for all the good reasons – the economy is growing strongly after the Q4 corona restrictions, while inflation expectations are lagging behind.
In other words, the reflation (of economic growth) is working and hasn't turned into inflation. We're more than a few quarters from that – I fully expect really biting inflation (supported by overheating in the job market) to be seen in 2022-3. As regards the S&P 500 sectors, would you really expect financials and energy do as greatly as they do if the prospects were darkening
Stocks are well positioned to keep absorbing the rising nominal rates. What has been the issue, was the extraordinarily steep pace of such move, leaving long-term Treasuries trading historically very extended compared with their 50-day moving averages. While they can snap back over the next one or two weeks, the 10-year Treasury bond yield, again breaking 1.50%, is a testament to the Fed not willing to do anything at the moment. Little does the central bank care about commodities moves, when it didn‘t consider any market moves thus far as unruly.
The gold market offered proof of being finally ready for a rebound, and it's visible in the closing prices of the yellow metal and its miners. Being more than a one-day occurrence, supported by yesterday presented big picture signals, the market confirmed my suggestion that gold will rise. It appears we‘ll get more than a few days to assess the legs this rally is made of, facilitating nimble charting of the waters ahead.
(…) Just as I was calling out gold as overheated in August 2020 and prone to a real soft patch, some signs of internal strength in the precious metals sector were present in February. And now as we have been testing for quite a few days the first support in my game plan, we're getting once again close to a bullish formation.
Flexibility and broad horizons result in accentuated, numerous other portfolio calls – such as long Bitcoin at $32,275 or long oil at $58. We're now on the doorstep of visible, positive price outperformance in the gold miners (VanEck Vectors Gold Miners ETF (NYSE:GDX) ETF) as gold prices didn't break the higher bullish trend by declining through March 4.
As I wrote yesterday, if prices move higher from here, they will simply bounce off support, especially given the accompanying signs presented, not the least of which is the dollar coming back under pressure. Make no mistake, the greenback isn't in a bull market – it's merely consolidation before plunging to new 2021 lows. I have not been presenting any USDX declining resistance lines and breakout arguments because prices can be both above such a line, and lower than at the moment of "breakout" at the same time. Ultimately, rising and declining supports and resistances are a play on the speed of the move, where pure inertia/deceleration/reprieve doesn't break the prior higher trend.
How does it tie in to commodities and stocks? We're not at extreme moves in either, and I see copper, iron, oil and agri-foods as benefiting from the reflationary efforts greatly. Similarly, and in spite of the FAANG travails, it would be ill-advised to search for stock market tops now. This is still the time to be running with the herd, and not against it. You can ignore the noise to the contrary for both the S&P 500 and commodities have a good year ahead. As for precious metals, we might have seen the bottom already.
Gold is in a secular bull market that started in 2018 (if not in late 2015), and what we're seeing since the August 2020 top is a soft patch. The name of the game now, is where the downside stops – and it's one of the scenarios that has just happened, especially if gold convincingly closes back above $1,720 without undue delay.
Let‘s move right into the charts (all courtesy of www.stockcharts.com).
S&P 500 Outlook

We have seen two intraday reversals to the downside yesterday, yet I think the effects would prove a temporary obstacle to the bulls only. Such candlestick patterns usually slow down the advance, but don't end it. Once the 3,900 zone is confidently passed, the bears would have missed the chance to reach below Thursday's lows.
Technology And Value

The big FAANG names are the biggest drag, and not until these carve out a sustainable bottom, I can declare this correction as getting close to over.
It's the cyclicals and value stocks that are pulling the 500-strong index ahead, with financials (Financial Select Sector SPDR® Fund (NYSE:XLF) ETF), industrials (Industrial Select Sector SPDR® Fund (NYSE:XLI) ETF) and energy (Energy Select Sector SPDR® Fund (NYSE:XLE) ETF) leading the charge.
Summary
Stocks did not see a real reversal yesterday, but there will be more backing and filling until the tech sector finds a bottom. The medium-term factors favor the bulls, but this correction isn't over yet.
