Investing.com’s stocks of the week
S&P 500 (SPY (NYSE:SPY))
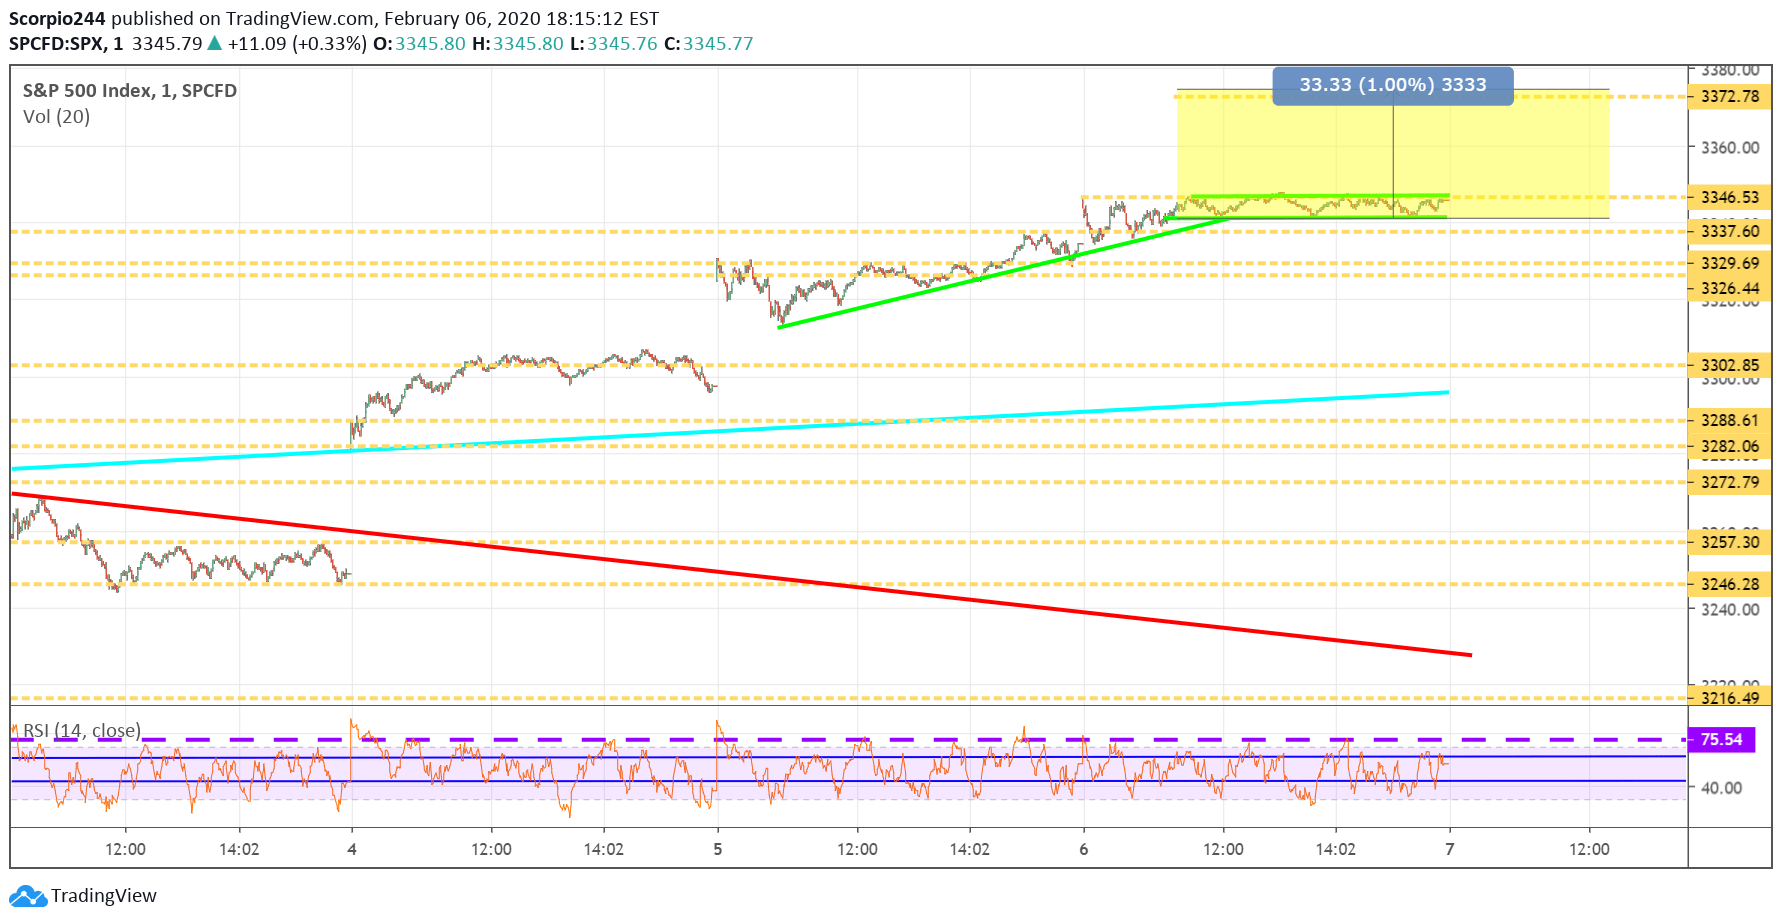
Stocks jumped once again but seemed to hit a brick wall at 3,346 and managed to find support 3,341, on the S&P 500 cash. It is creating what appears to be a bullish flag pattern that would suggest the index rises from its current levels, tomorrow.
I find it particularly interesting because other markets do not seem nearly as supportive of this increase, and I do not know what to make of it. But we have to follow the trends, and can’t fight it, I guess, there is no other explanation.
Based on the pattern and its projection, it amounts to about a 1% increase to around 3,375. So we can all wait overnight and hold our breath as to what the next major move in the market is.
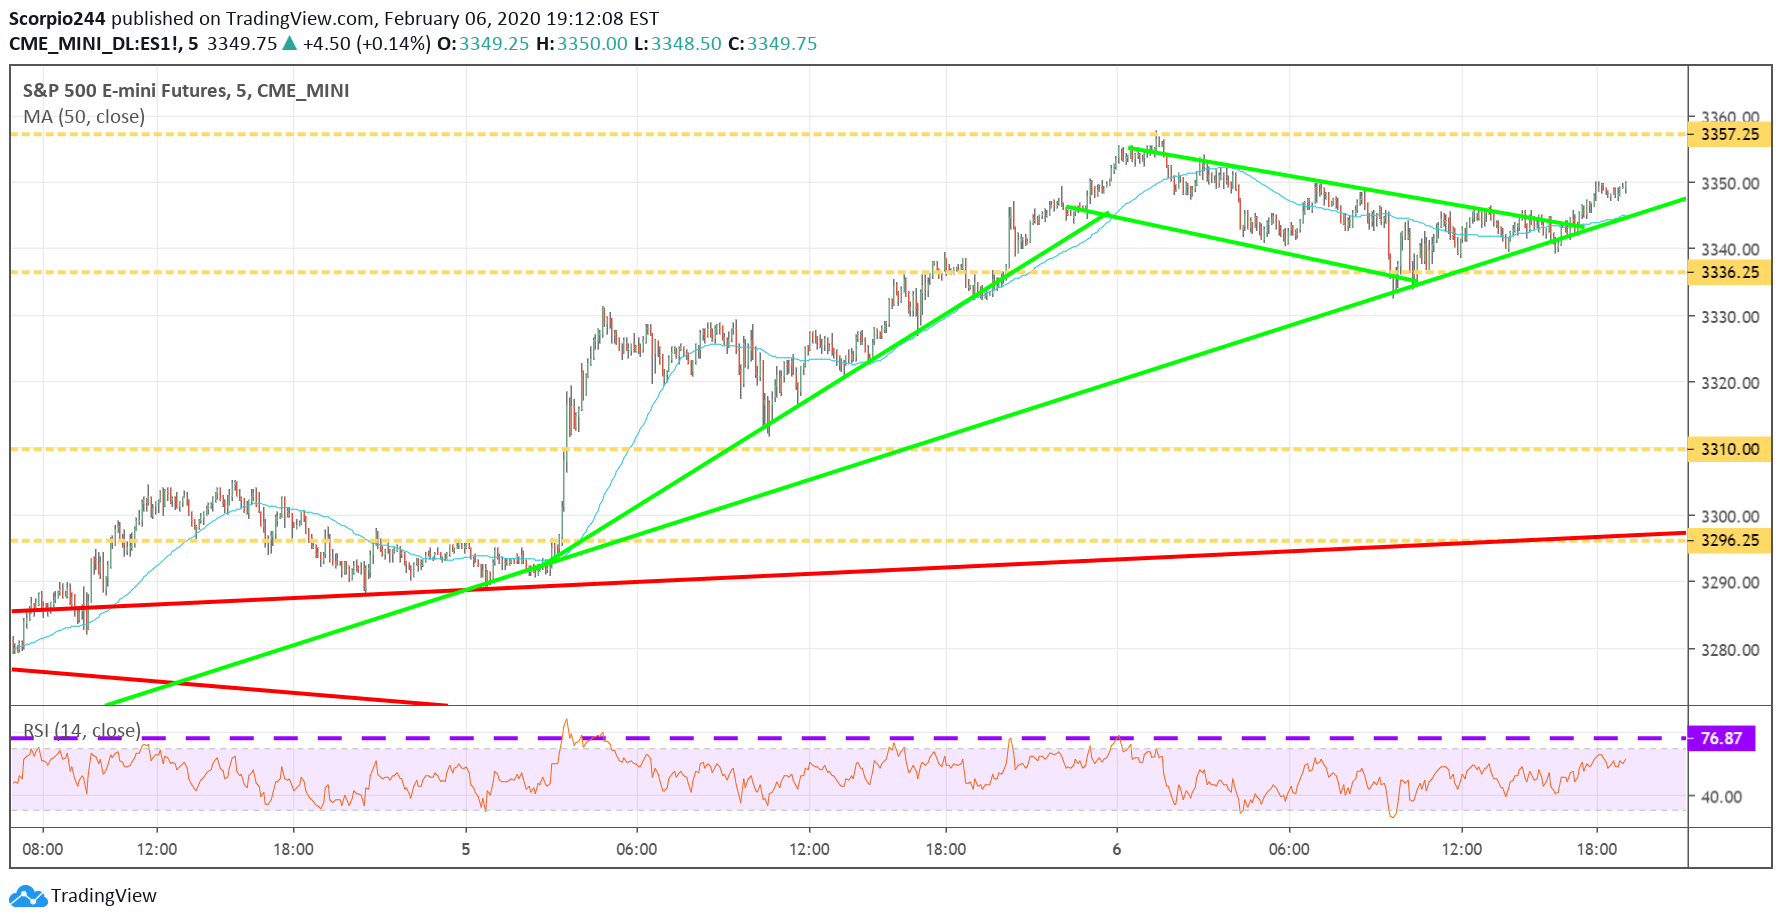
The nice thing about such a late write-up is that we get a head start on tomorrow because the S&P 500 futures are already breaking out of that pattern, as Japan trades higher by 25 bps, despite South Korea down 40 bps.
Tomorrow, of course, is the big job data and based on all of my extensive research, the number should be pretty healthy and likely better than expected. Jobless claims have fallen significantly on the 4-week moving average, and the ADP employment was much better than expected.
Based on my math, which isn’t always perfect, I came to a reading of around 320,000 jobs created in January. This number is a moving target, though, and nearly impossible to predict, because the numbers from previous months will be revised. I went through all most of the significant points in a video today, although I didn’t go through my secret formula for my guesstimate.
Tesla (NASDAQ:TSLA)
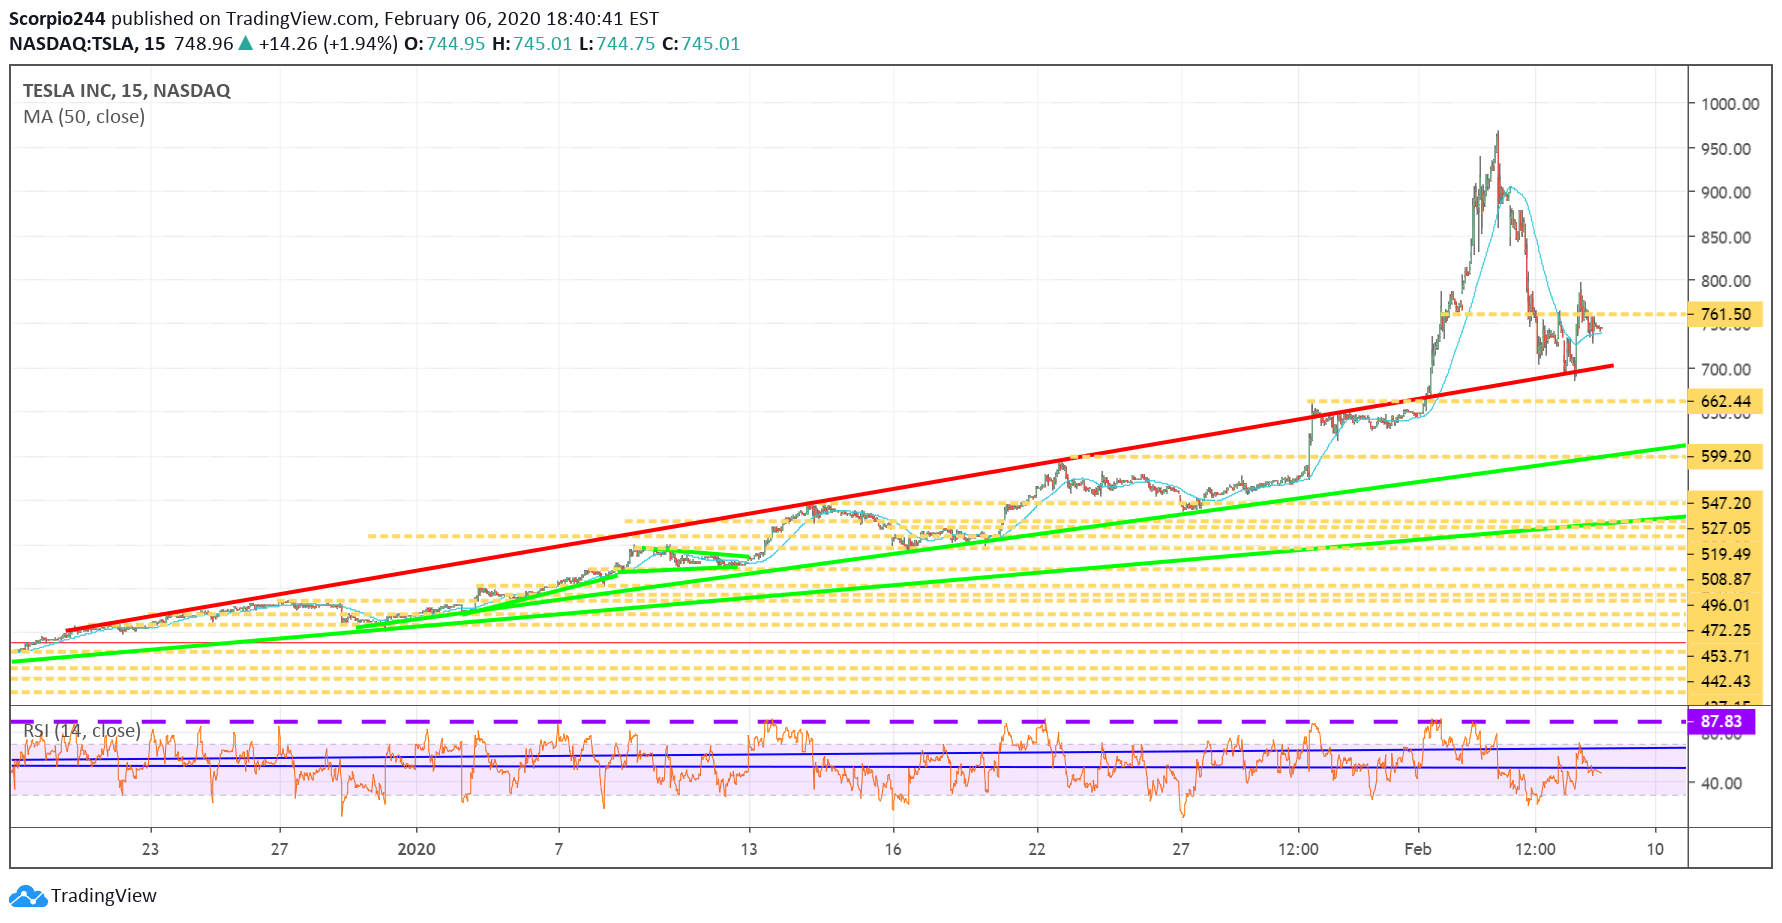
Tesla (NASDAQ:TSLA) almost had an average day of trading, rising by just 2%. But that doesn’t tell the whole tale, because shares fell as low as $687 and traded as high as $795. Just a typical day of trading, with a more than $100 point trading range. Anyway, the stock seemed to find some support at the uptrend around, that’s a plus.
Amgen (NASDAQ:AMGN)
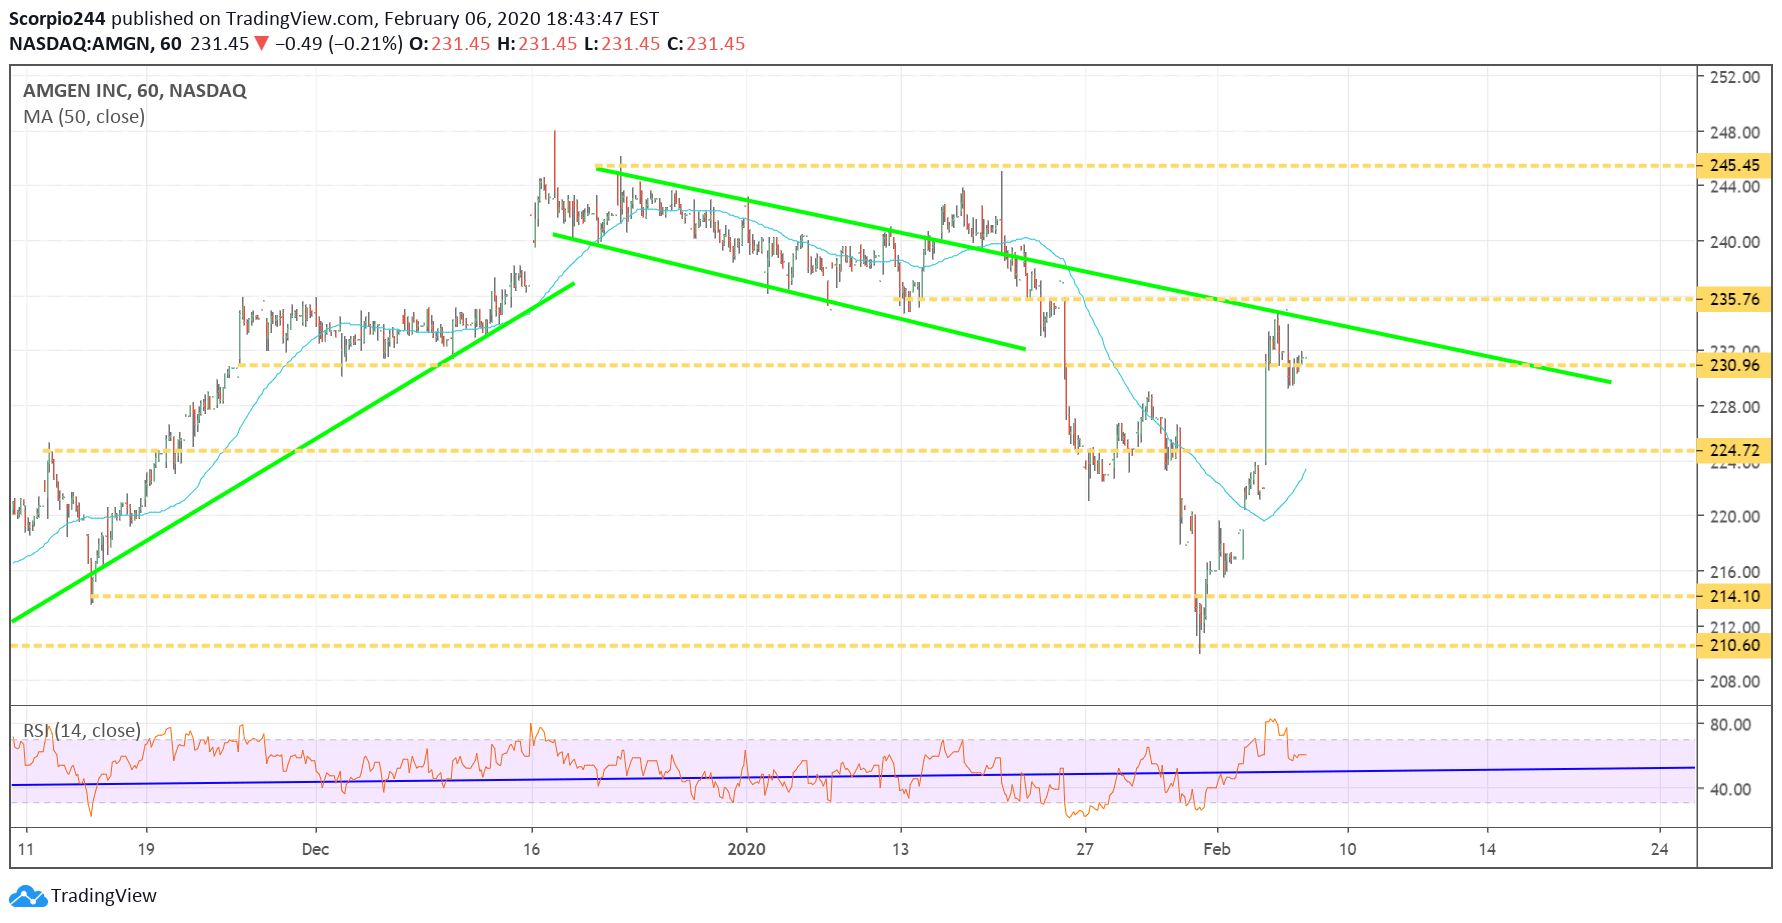
Another stock that has been trading all over the place is Amgen (NASDAQ:AMGN), and this one seems almost impossible to figure out. The one thing that seems clear is that resistance appears to be at the upper downtrend. I think there is a good chance it trades down to $225.
Disney (DIS)
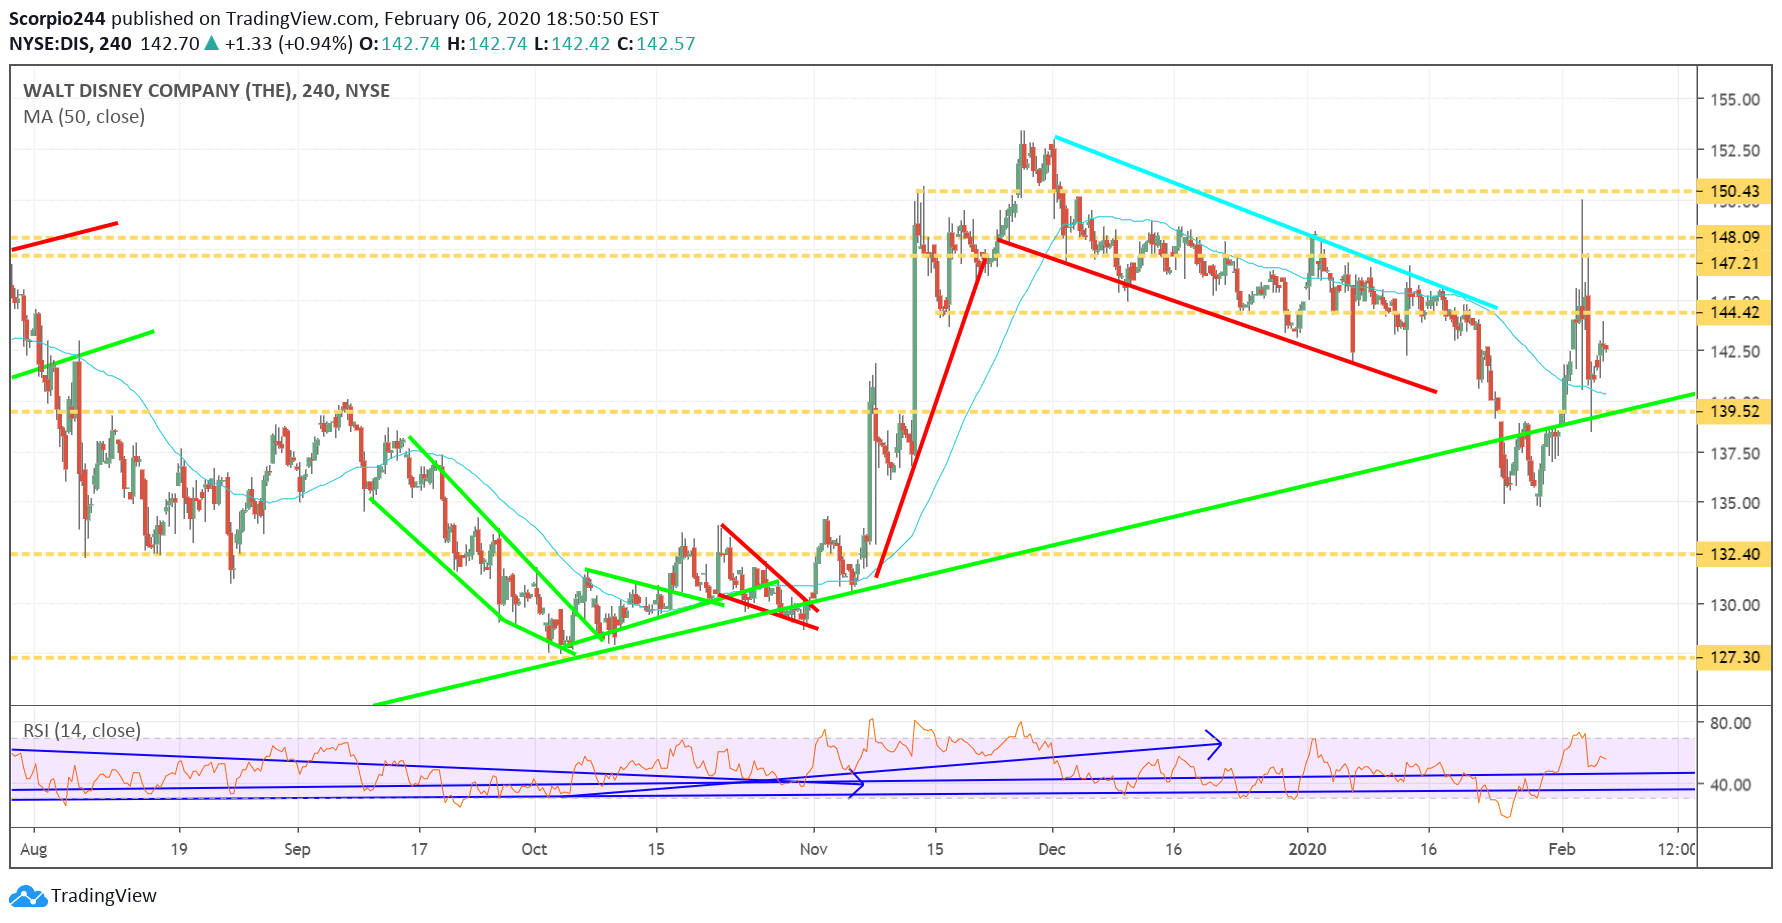
Disney seems like it is trending higher, and holding on to key support levels, but the stock doesn’t seem to be acting the way we expected. The stock does have a nice double bottom in the chart, but I do not see any clear patterns or directions at this point. We are going to have to give this a few days to see how it settles out, or at least until we get some clear sense of direction.
Alpahbet (GOOGL)
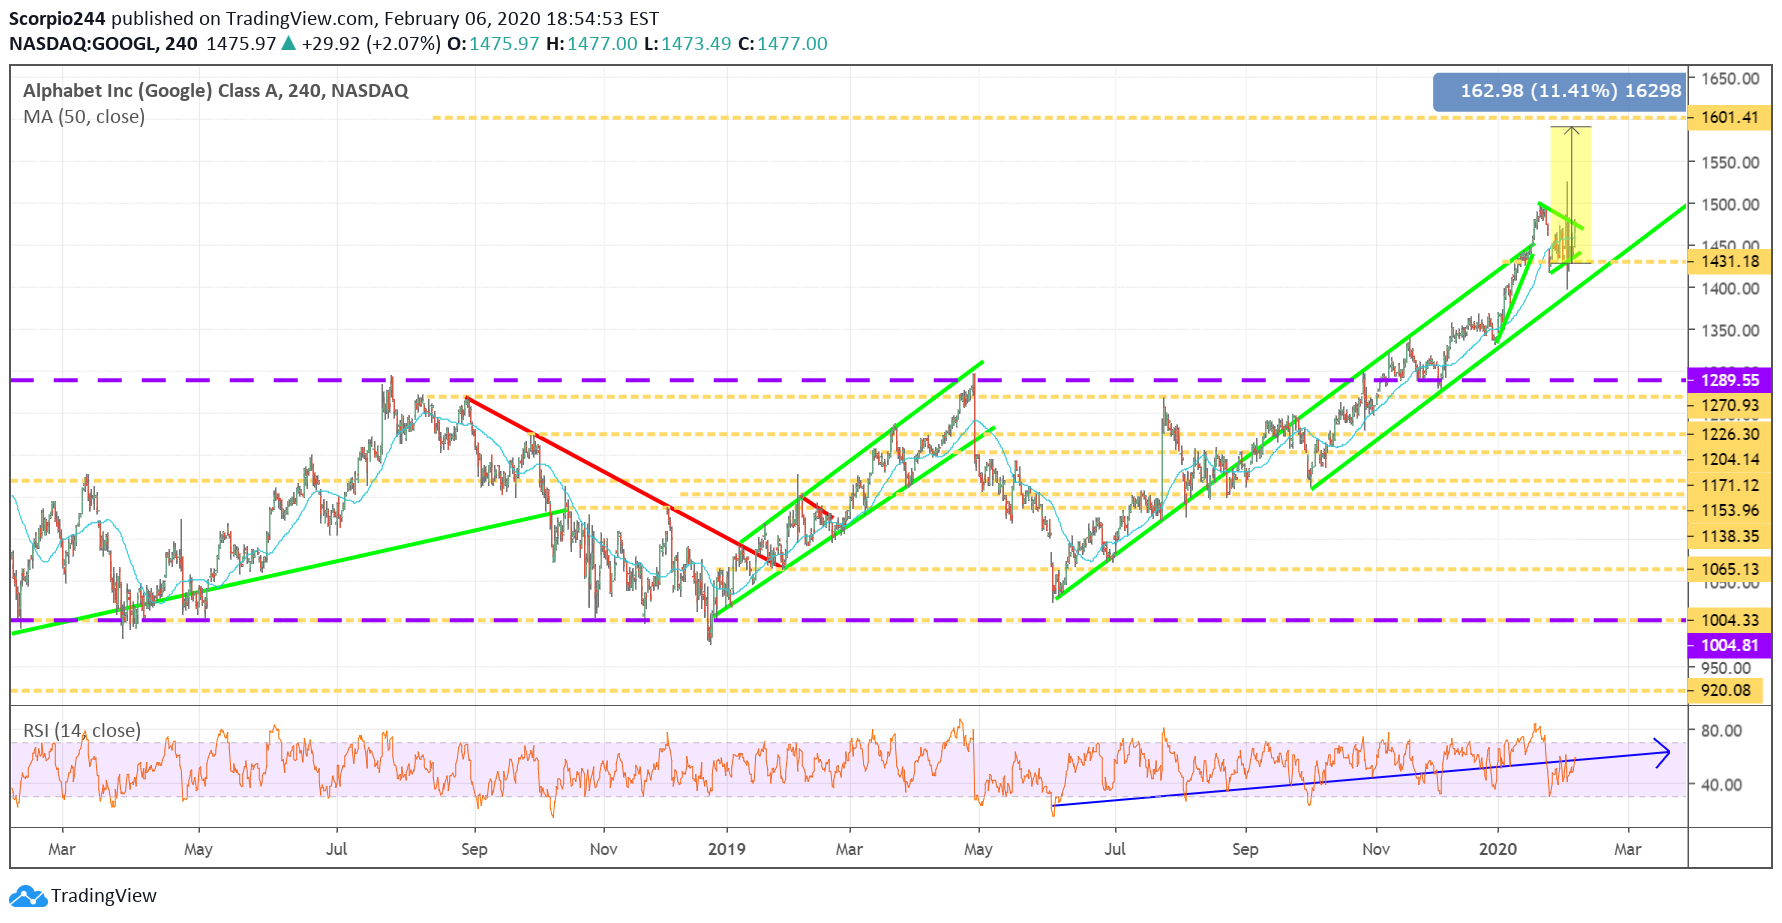
It is nice to see that Alphabet (NASDAQ:GOOGL) has started to come around after that post-earnings drop. It looks like shares are consolidating and forming a symmetrical triangle, which could result in the stock breaking higher perhaps to $1,600, which is that level we have been looking to achieve for some time now. Free Article – Alphabet’s Post-Earnings Drop Appears To Be An Overreaction
Microsoft (NASDAQ:MSFT)
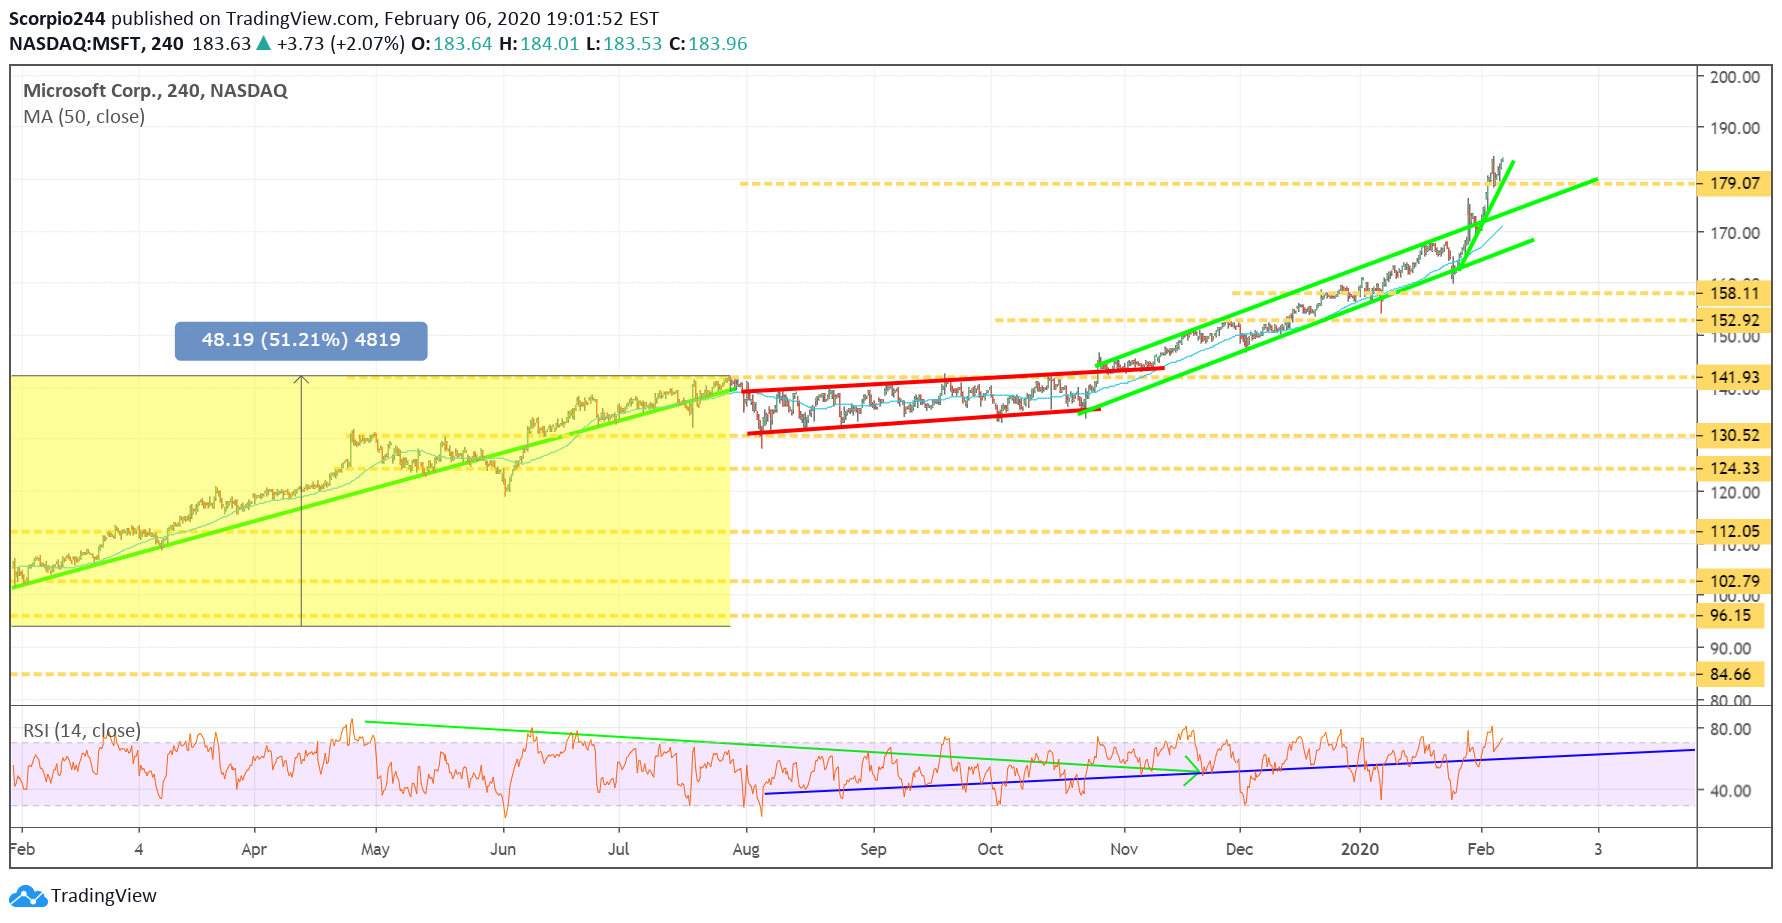
Finally, I have been seeing a lot of bullish betting ing Microsoft (NASDAQ:MSFT) the last two days that suggests the stock still has much further to climb.
