Investing.com’s stocks of the week
S&P 500
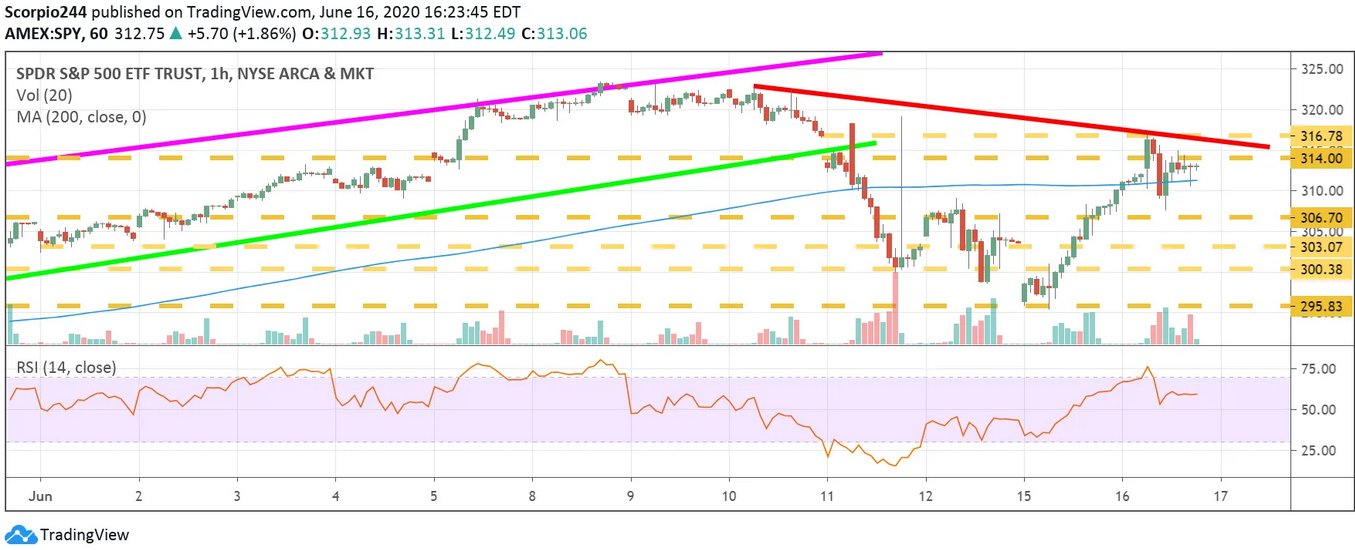
Stocks advanced by about 1.9%, but it was a very volatile trading session, with shares up as much as 3% at one point, then falling back to nearly flat, then surging higher, and finished near the middle. Bullish or bearish? So if I had to choose, I’d say bearish.
There now appears to be a downtrend that has formed in the index and the S&P 500 ETF (NYSE:SPY), and the gap around $317 has been filled.
On the QQQs, you can also see that we managed to get back to and retest the breakdown of the rising wedge.
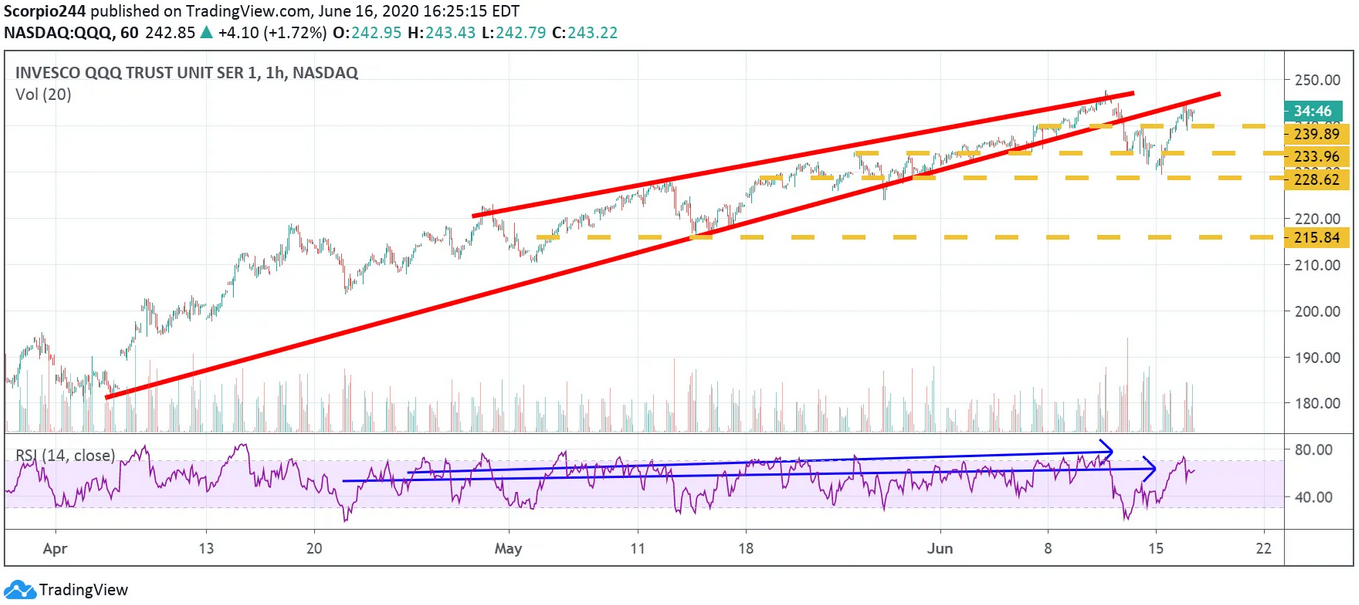
Those could be two fairly significant developments for the two indexes, so I’m curious to see how the future traders trade this tonight. Regardless the trend is bearish for now.
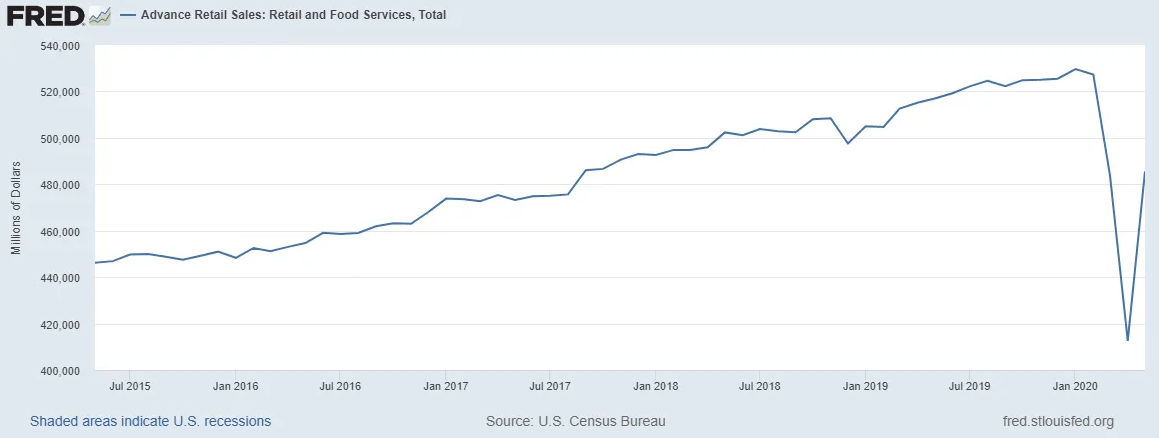
Retail sales were better than expected, but we only returned to the March levels on the nominal number, not the percentage. The first chart makes it seem as if retail sales exploded higher.
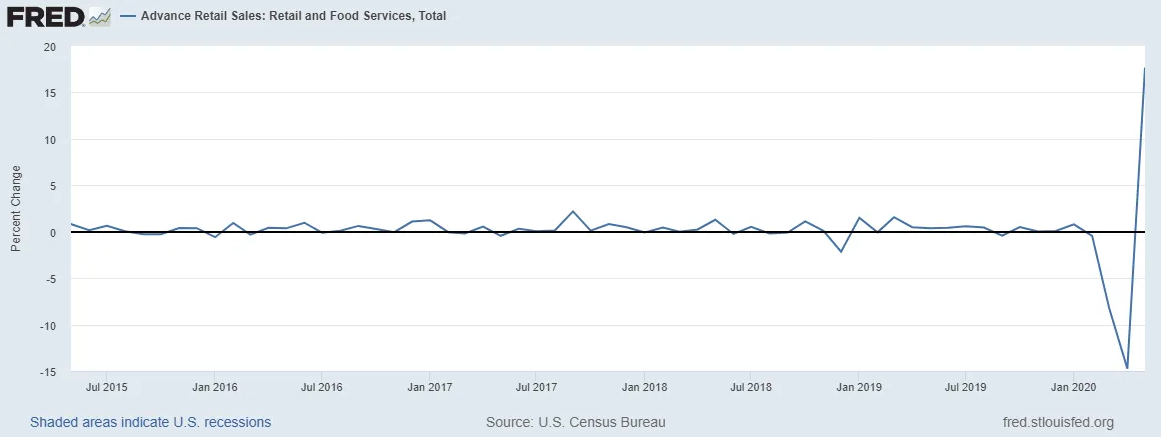
But when you look with the actual dollar values, it is less than an impressive. I’m wondering how I should think about that number. Remember, many states opened at the start of May, yet we only returned to March levels when most states were closed halfway through the month. So strong number or weak number? I’m not sure, but it is something to think on, June will be very telling.
Oracle
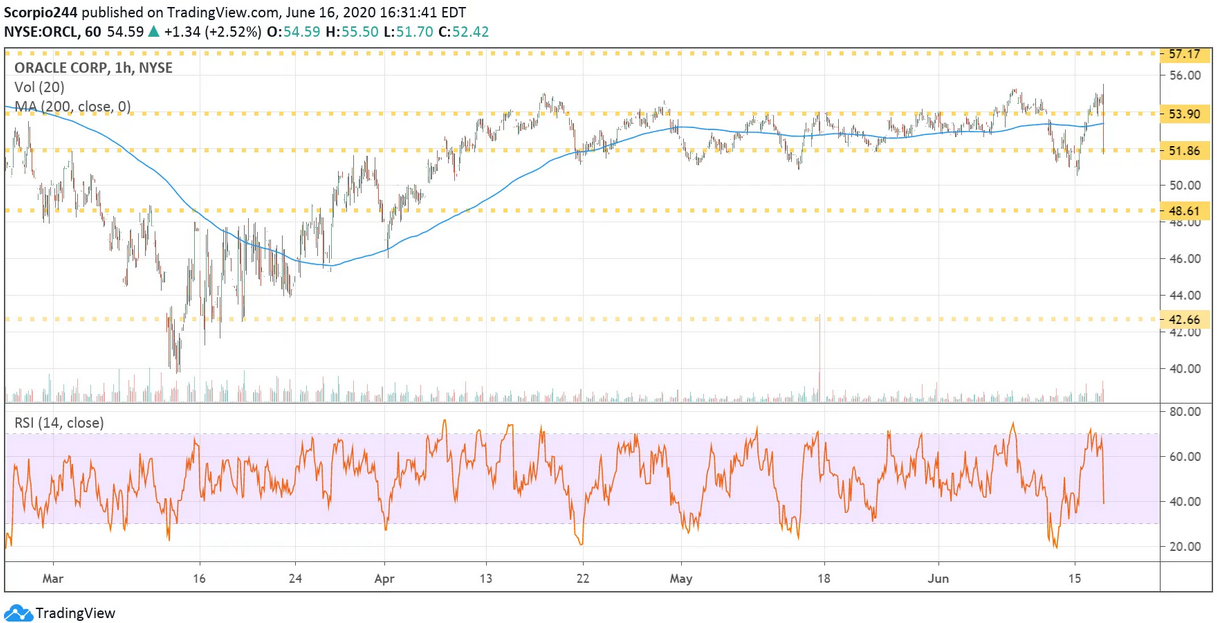
Oracle (NYSE:ORCL) is falling sharply, after the company reported disappointing results, and noted that some customers are postponing their orders. Certainly not a good sign for the stock. The $51 to $52 region appears to be somewhat relevant to the health of this stock. A drop below $51 would indicate a further decline is coming, probably to $48.
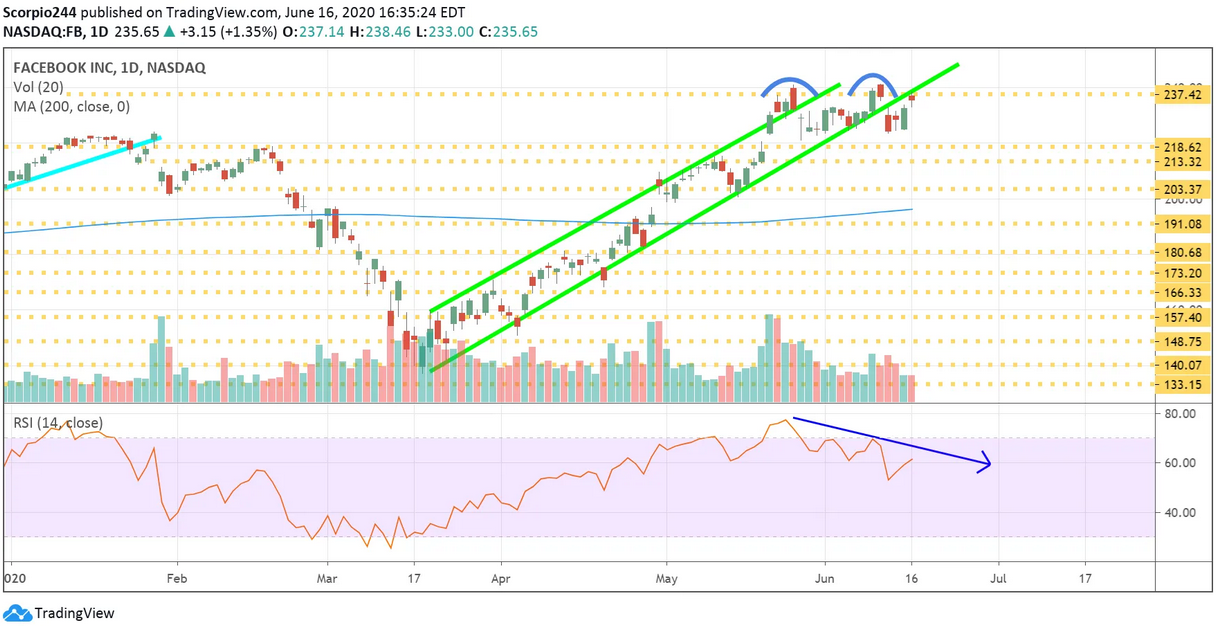
I tend to think that Facebook (NASDAQ:FB) pushes lower from here. I have been saying since the middle of May, and so far, it is yet to happen. Yesterday, I noted some bearish betting in the options, that suggests maybe finally it does go down. A drop to $204 seems to be possible.
Square
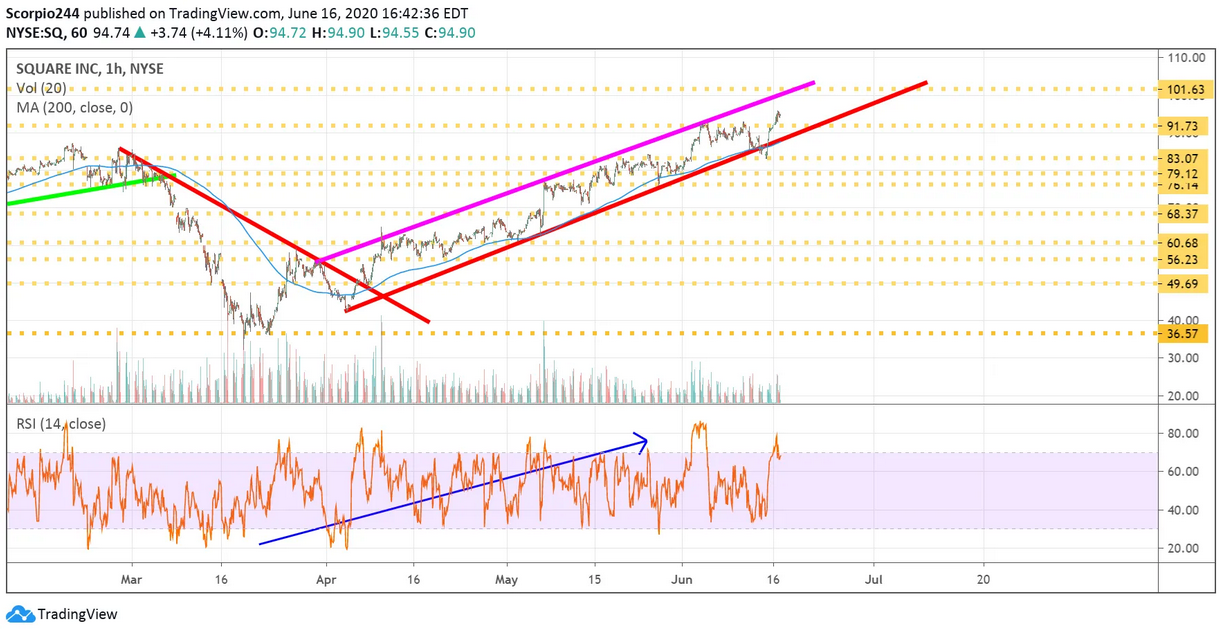
Square (NYSE:SQ) manages to just stay in this perfect little trading channel as long as it does not deviate from that channel it is on a path to $102.
PayPal
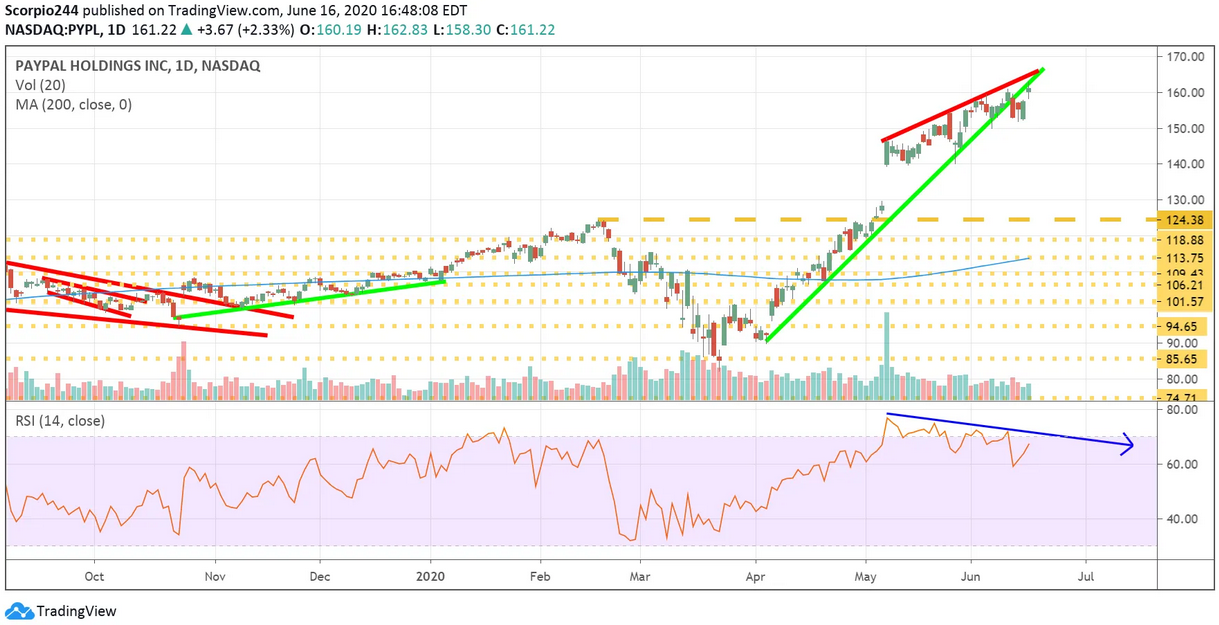
I’m thinking PayPal (NASDAQ:PYPL) may be retesting the breaking of the rising wedge pattern. If that is the case, then a move back to the gap around $129 seems like a reasonable stop.
Zoom
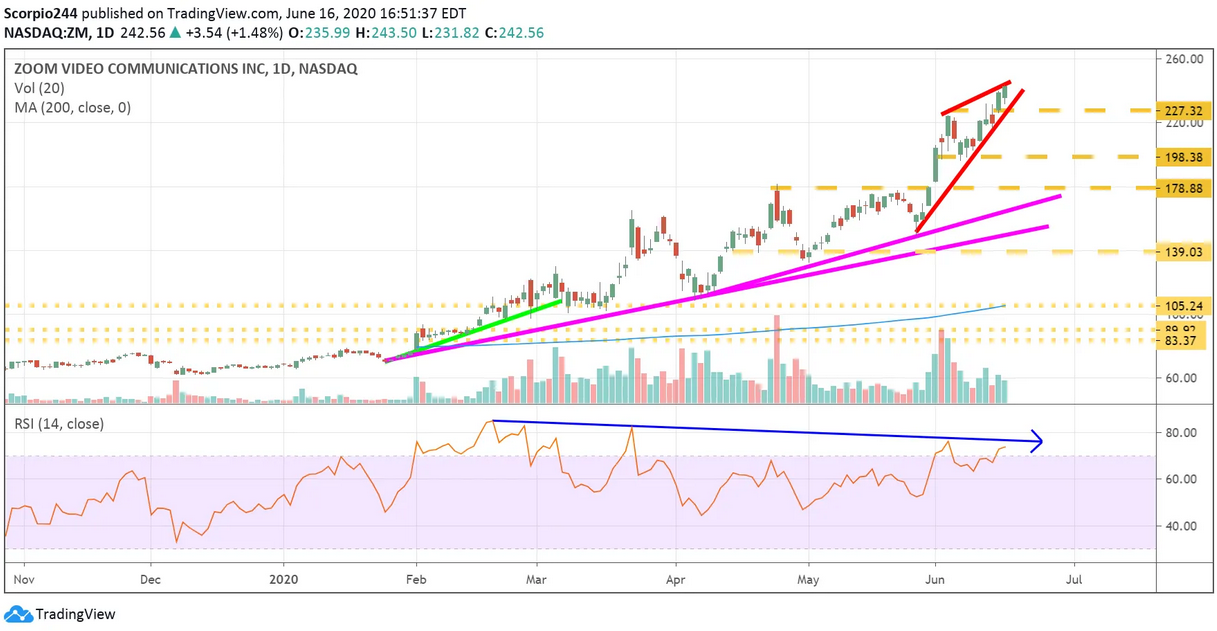
Maybe the Zoom (NASDAQ:ZM) craze is slowly fading out, volume levels are not that great, and the stock, like PayPal, has a rising wedge formed, a dip to $198 may be coming.
