When the financial media talks about U.S. Treasuries, it is usually focused on the yield curve. Or sometimes they will highlight the 10-Year treasury yield and its relation to mortgage rates.
But more recently, the news has been focused on the prospects of a yield curve inversion and how that correlates to economic slowdowns/recessions. Today, we are going to simply look at the 10-Year and 30-Year U.S. Treasury Yield charts.
In my business, a picture (chart) is worth a 1000 words.
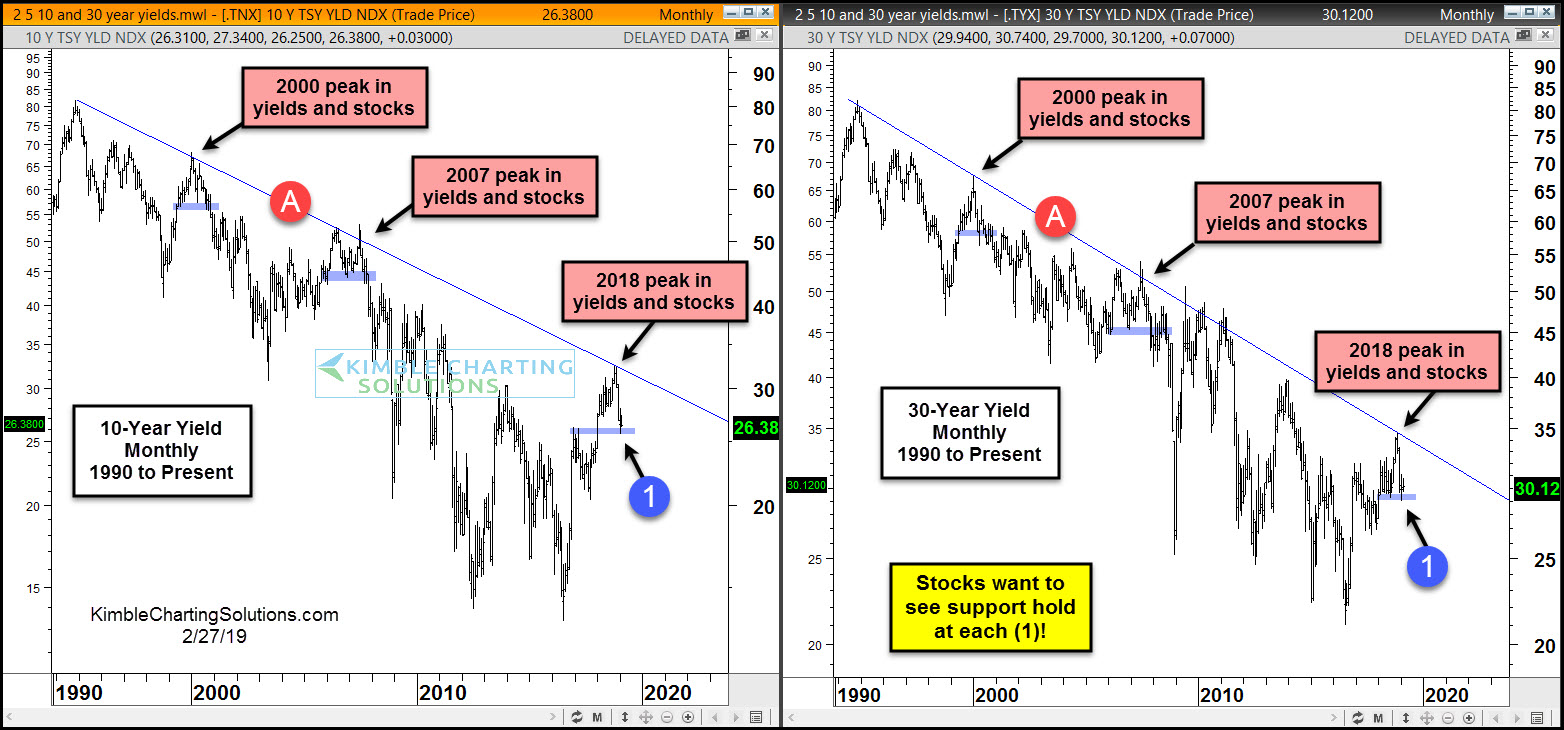
Over the past three decades, Treasury yields have been in a downtrend, with major stock tops (and treasury yield tops) coming in 2000 and 2007.
Will 2018-2019 be the same? From a pattern standpoint, stock market bulls hope the reversal lower in Treasury yields finds support soon… preferably at point (1)! Stay tuned!

