In March, our analysis indicated that the risk/reward profile of the stock market had entered the worst one percentile of all historical observations based on 80 years of data. We predicted that the extremely speculative rally from October 2011 would be followed by a violent retracement that would quickly erase the gains of the first quarter. Since peaking on the first trading day of April, the S&P 500 index has declined 10 percent, returning to levels last seen during the first week of January.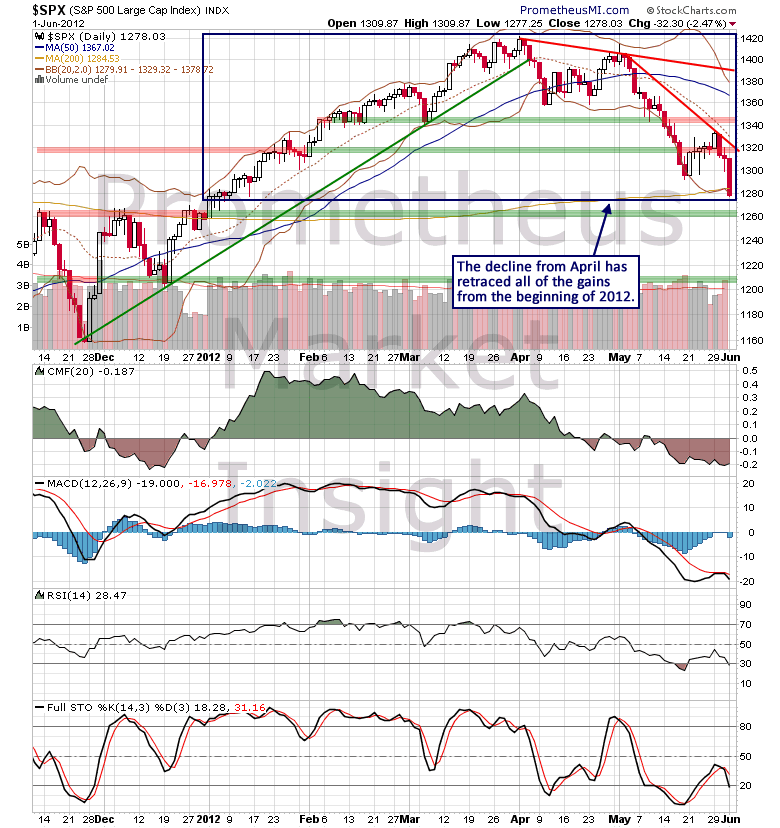
Most mainstream analysts view the decline as nothing more than a healthy correction that will soon be followed by a move up to new highs for the cyclical bull market from 2009. However, compelling evidence suggests that the correction is still in its early stages and that the April high will ultimately mark the start of a new cyclical downtrend. Let’s review the bear market case one point at a time.
1. A recession is almost certainly imminent.
In early March, we indicated that the US economy had entered a “make or break” window during which we expected economic data to begin missing consensus expectations. We expected the deterioration to be slight at first before accelerating in May and June. Since then, the data trend in everything from employment to general business activity has weakened as expected, suggesting that the US will almost certainly follow Europe into recession this year. The Economic Cycle Research Institute (ECRI) has continued to reaffirm its recession call from late 2011 during the past eight months and its Weekly Leading Index (WLI) is in the process of forming a long-term descending triangle, suggesting that the tepid economic recovery from 2009 is finally rolling over.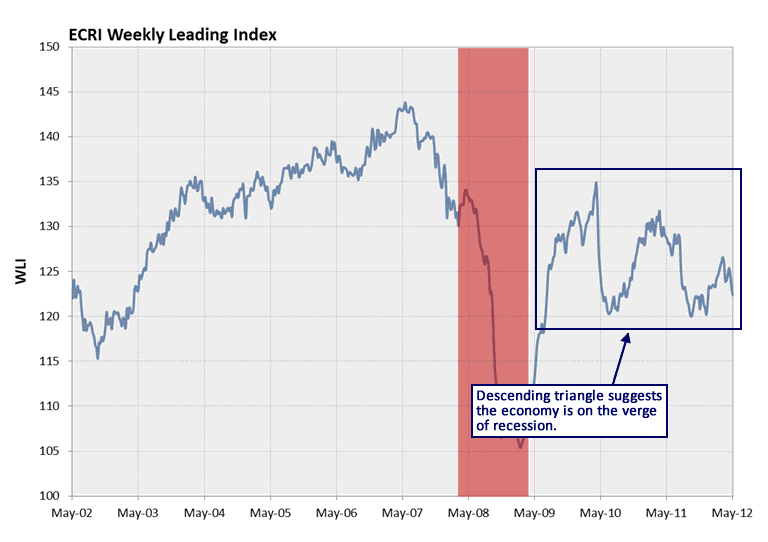
2. The Federal Reserve is out of ammunition.
The stated objective of the Federal Reserve during the last two years under the direction of Chairman Bernanke has been to drive investors into speculative asset classes in an attempt to revive economic growth. Although the stock market has experienced two extreme moves higher as a result of Federal Reserve liquidity operations in 2010 and 2011, the effects of the stimulus programs have been transitory and they have failed to significantly impact economic growth.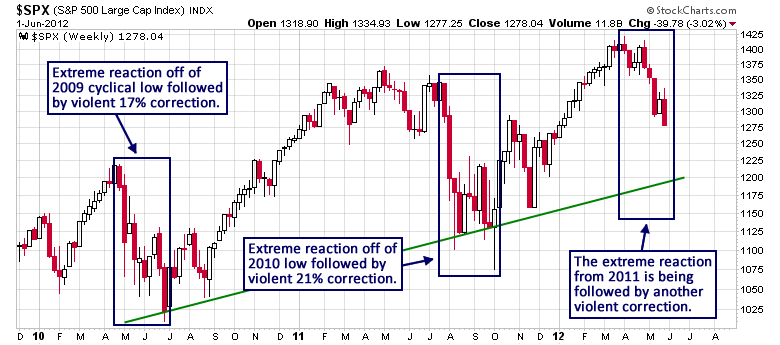
The problem with targeting the stock market is that there is no statistically meaningful correlation between stock market gains and economic growth. Since the recession in 2008, M1 money supply has surged an astonishing 60 percent, topping the 2.2 trillion level in January with no end in sight to the extreme move higher.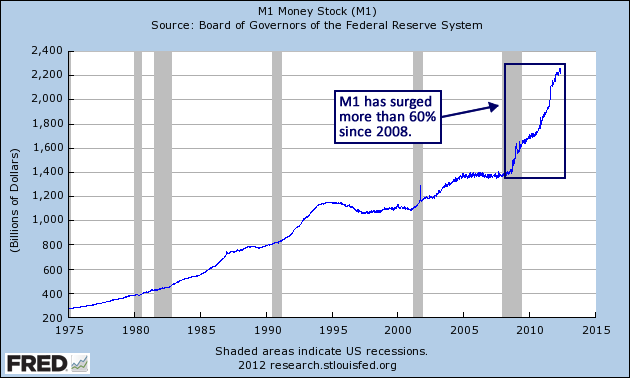
However, during that time, the velocity of M1 money has plunged from a high of 10.37 in late 2007 to less than 7 in early 2012.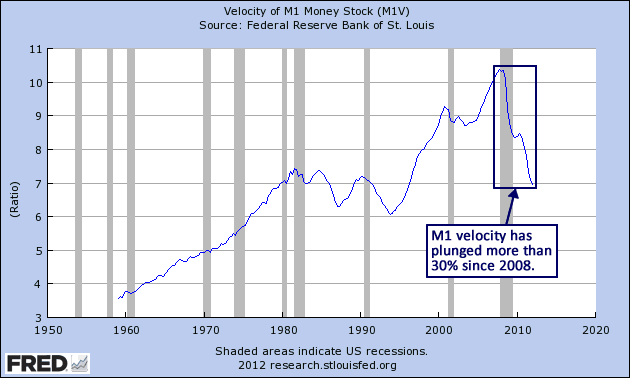
Essentially, velocity measures how fast money changes hands, providing a gauge of economic activity. In basic terms, when velocity declines sharply even as supply is being introduced at an unprecedented rate, the implication is that the added liquidity is not engendering economic activity. This is what “pushing on a string” looks like. Accordingly, the M1 money multiplier has remained well below the 1.0 level during the last three years.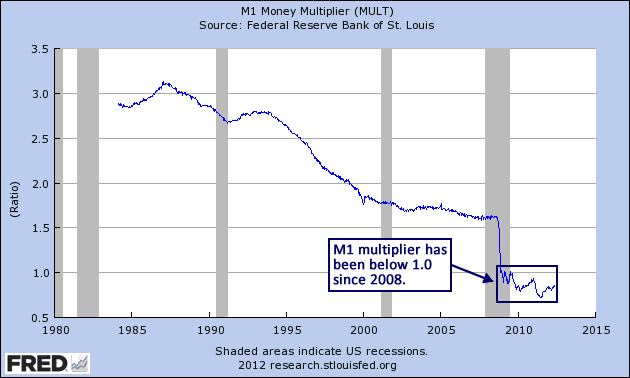
The Federal Reserve can attempt to spur economic activity by introducing monetary stimuli, but it cannot force banks to increase their loan and investment activity. The velocity and multiplier data trends clearly demonstrate that the newly introduced M1 supply is simply remaining idle in places like bank reserves. Of course, now that the economy has begun to decelerate, many are expecting another round of quantitative easing to once again save the day. However, with interest rates plunging to historic lows, there is little room for the Federal Reserve to act further.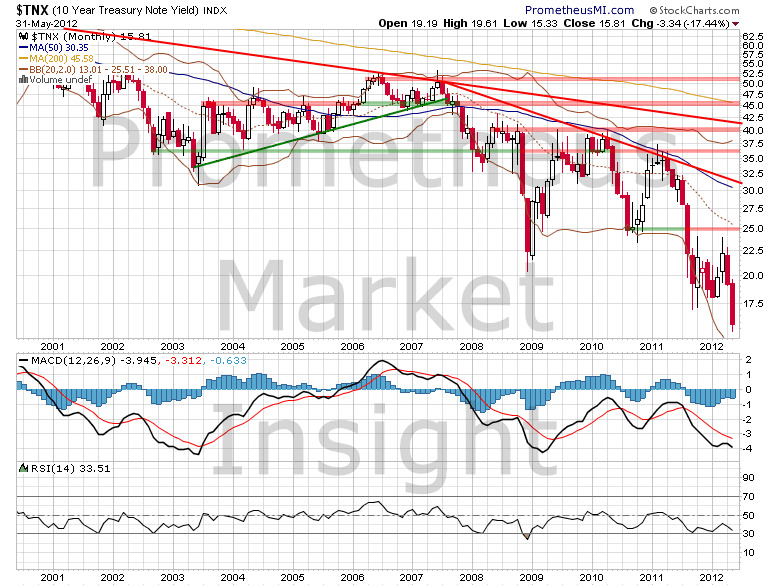
In fact, with total US debt well into the “excessive” category, there is very little reason to expect any type of stimulus program to have a constructive impact on economic activity.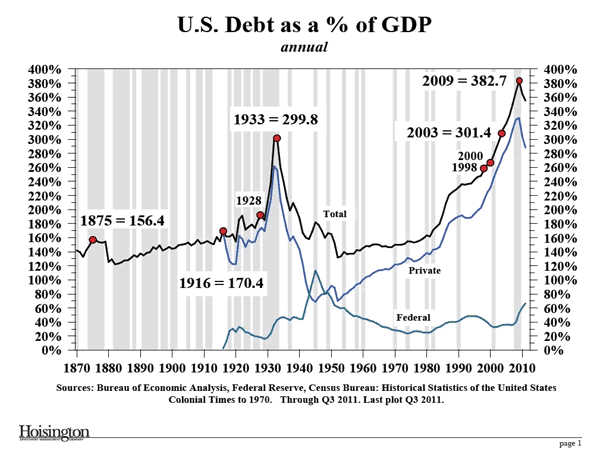
3. Corporate profits are likely forming a cyclical top.
One of the most prevalent mainstream arguments that suggest the stock market is inexpensive at current valuations focuses on corporate earnings forecasts. As fund manager John Hussman has correctly observed, the forward earnings model has a very poor performance history, and it is especially dangerous near highs in the long-term corporate profit cycle.
One of the aspects of the market that is most likely to confuse investors here is the wide range of opinions about valuation, with some analysts arguing that stocks are cheap or fairly valued, and others – including Jeremy Grantham, Albert Edwards, and of course us – arguing that valuations are very rich. Essentially, analysts who view stocks as “cheap” here are invariably basing that conclusion on current and year-ahead forecasts for earnings. In contrast, analysts who view stocks as richly valued are typically those who view stocks as a claim not on this years’ or next years’ earnings, but instead are a claim on a long-term stream of deliverable cash flows. Simply put, there is presently a massive difference between short-horizon earnings measures and longer-term, normalized earnings measures.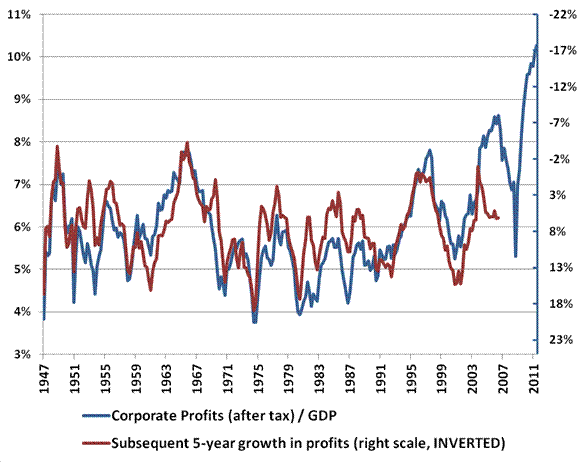
If investors are willing to believe (without the use of off-label hallucinogens) that current profit margins are the new normal, and will be sustained indefinitely, then Wall Street’s valuations based on current and forward earnings estimates can be taken at face value. This assumption of a permanently high plateau in profit margins is quietly embedded into every discussion of “forward earnings” here.
Many mainstream analysts base their projections and recommendations on faulty assumptions because they fail to see the big picture. Anyone who contends that stocks are currently “cheap” as investment vehicles is either ignorant of the cyclical nature of corporate earnings or subscribes to the infamous “this time is different” philosophy. In either case, the forward earnings model is once again poised to perform very poorly as we approach the most extreme cyclical high in corporate profits in more than half a century.
4. The end of the current bull market is overdue.
The stock market has been in a secular bear market since the secular bull from the early 1980s ended in 2000.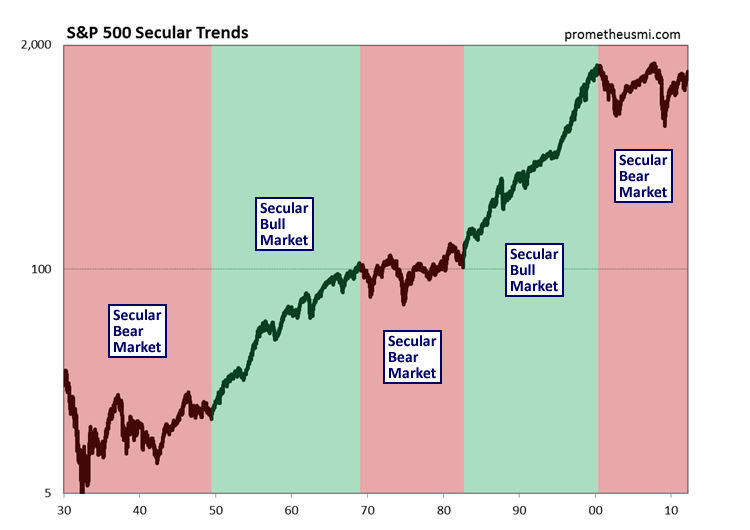
Cyclical bull markets that occur within secular bear markets behave very differently from their counterparts in secular bulls. While the average duration of a cyclical bull market within a secular bull market is about 50 months, the average duration of a cyclical bull market within a secular bear market is only 33 months. At a current duration of 39 months, the bull market from early 2009 is much longer than average and overdue for termination.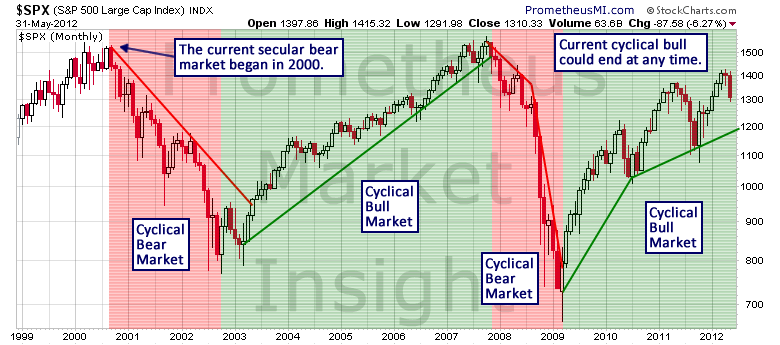
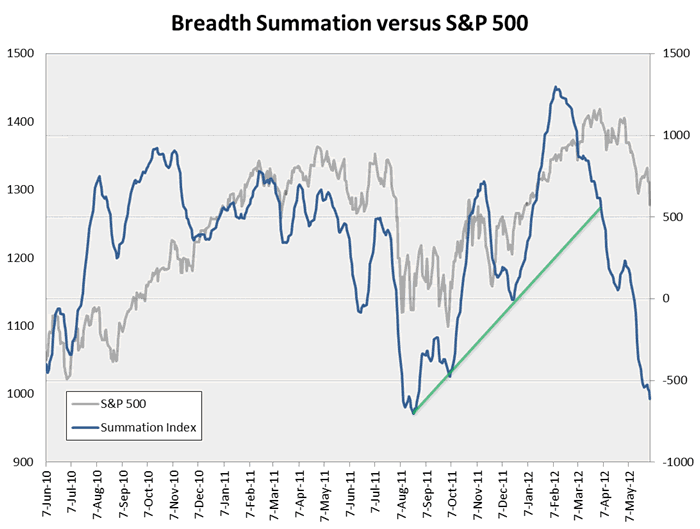
5. Market internals have collapsed.
Following the development of a negative divergence in early March, market internals such as volume and breadth have completely collapsed, indicating that the bull market from 2009 has lost nearly all of its underlying momentum and buying support.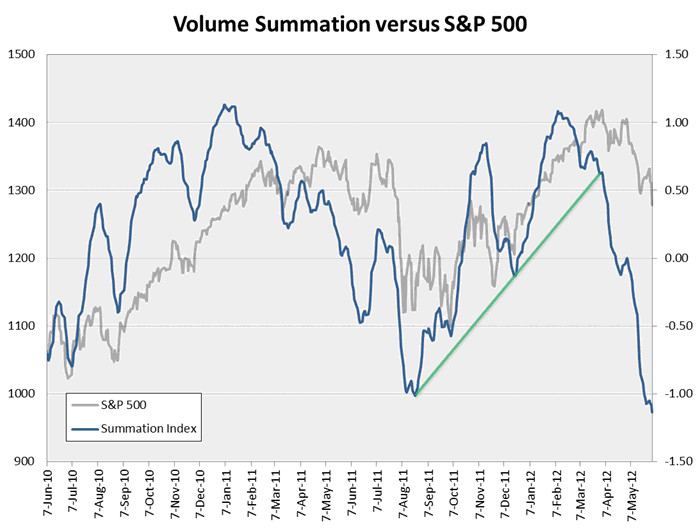
6. A classic cyclical trend sell signal has been issued.
Our Cyclical Trend Score (CTS) identifies highly probable inflection points in the stock market cyclical trend. The CTS is generated by a long-term computer model that analyzes a large basket of fundamental, technical, internal and sentiment data in order to provide a quantitative measure of overall cyclical bullishness or bearish. Since the current secular bear market began in 2000, there have been four confirmed cyclical trends, two downtrends and two uptrends. The CTS has correctly identified all four cyclical trend inflection points and another sell signal was generated on April 9, suggesting the likely development of a third cyclical downtrend. The computer model that generates the CTS has been tested using historical data from the past 80 years and it has correctly identified more than 90% of all cyclical inflection points while issuing only four false signals, so it has proven to be extremely reliable.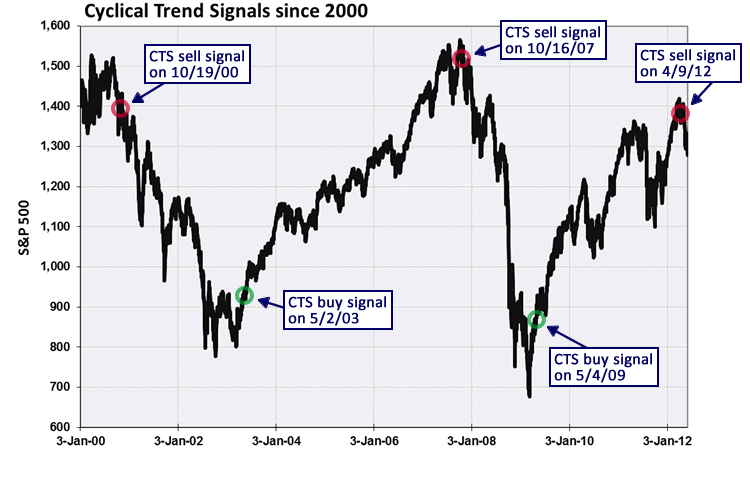
Of course, cyclical inflection points can only be fully confirmed with the benefit of hindsight, so it will likely be several months before we know for sure if a bear market began in April. However, the vast majority of economic and market data support the development of a new cyclical downtrend at this time, so a fully defensive posture from an investment perspective is warranted. As always, there are no certainties when it comes to financial market forecasting, only likely scenarios and their associated probabilities. However, certainty is not a requirement to succeed as a market participant. The key to long-term success as both an investor and a trader is aligning yourself with the most likely scenarios and protecting yourself from the least likely ones.
- English (UK)
- English (India)
- English (Canada)
- English (Australia)
- English (South Africa)
- English (Philippines)
- English (Nigeria)
- Deutsch
- Español (España)
- Español (México)
- Français
- Italiano
- Nederlands
- Português (Portugal)
- Polski
- Português (Brasil)
- Русский
- Türkçe
- العربية
- Ελληνικά
- Svenska
- Suomi
- עברית
- 日本語
- 한국어
- 简体中文
- 繁體中文
- Bahasa Indonesia
- Bahasa Melayu
- ไทย
- Tiếng Việt
- हिंदी
Stocks Have Likely Entered Cyclical Bear Market
Published 06/04/2012, 02:27 AM
Updated 07/09/2023, 06:31 AM
Stocks Have Likely Entered Cyclical Bear Market
Latest comments
Loading next article…
Install Our App
Risk Disclosure: Trading in financial instruments and/or cryptocurrencies involves high risks including the risk of losing some, or all, of your investment amount, and may not be suitable for all investors. Prices of cryptocurrencies are extremely volatile and may be affected by external factors such as financial, regulatory or political events. Trading on margin increases the financial risks.
Before deciding to trade in financial instrument or cryptocurrencies you should be fully informed of the risks and costs associated with trading the financial markets, carefully consider your investment objectives, level of experience, and risk appetite, and seek professional advice where needed.
Fusion Media would like to remind you that the data contained in this website is not necessarily real-time nor accurate. The data and prices on the website are not necessarily provided by any market or exchange, but may be provided by market makers, and so prices may not be accurate and may differ from the actual price at any given market, meaning prices are indicative and not appropriate for trading purposes. Fusion Media and any provider of the data contained in this website will not accept liability for any loss or damage as a result of your trading, or your reliance on the information contained within this website.
It is prohibited to use, store, reproduce, display, modify, transmit or distribute the data contained in this website without the explicit prior written permission of Fusion Media and/or the data provider. All intellectual property rights are reserved by the providers and/or the exchange providing the data contained in this website.
Fusion Media may be compensated by the advertisers that appear on the website, based on your interaction with the advertisements or advertisers.
© 2007-2025 - Fusion Media Limited. All Rights Reserved.
