Big Picture:
Going into the FOMC announcement stocks looked weak and gold looked like it wanted to firm up, but the exact opposite was the outcome. The thing to keep in mind is that when big new events and news surprises come out, they tend to support the direction of the primary trend and that's exactly what happened this week. Stocks are still going up, gold is still going down, and bonds appear neutral (building a base?).
The Weekly Stats:
A note about trend . Trend on the daily timeframe is defined using Donchian channels and an Average True Range Trailing Stop. There are three trend states on the Daily timeframe: up, neutral, and down. On the weekly timeframe, I'm looking at Parabolic SAR to define trend and there are two trend states, up and down. In reality, there are always periods of chop and I'm using the indicator to capture the general bias of both the trend and those periods of chop.
Stocks (SPY, SPDR, S&P 500, ETF, and IWM: iShares Russell 2000 Index ETF):
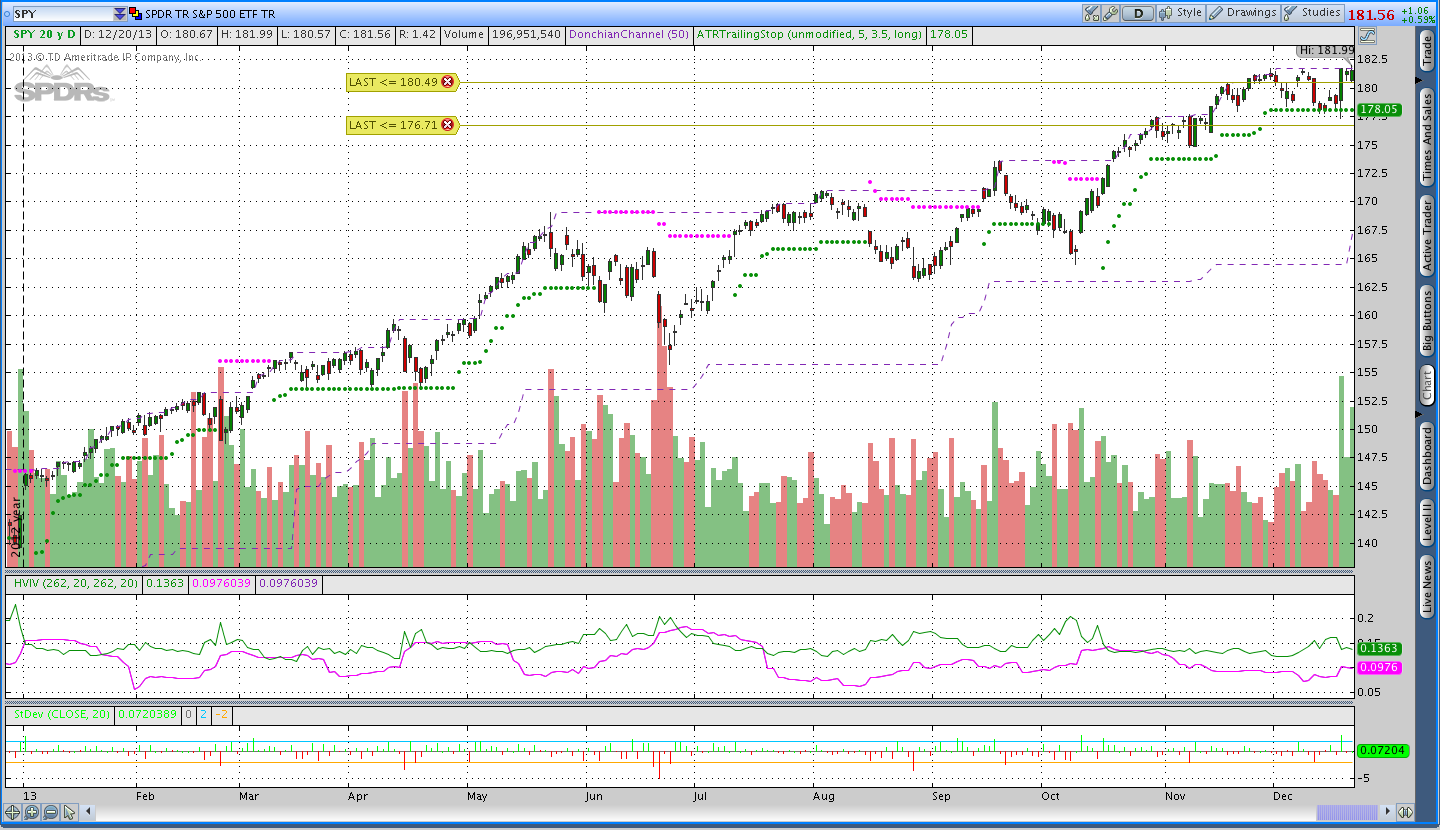
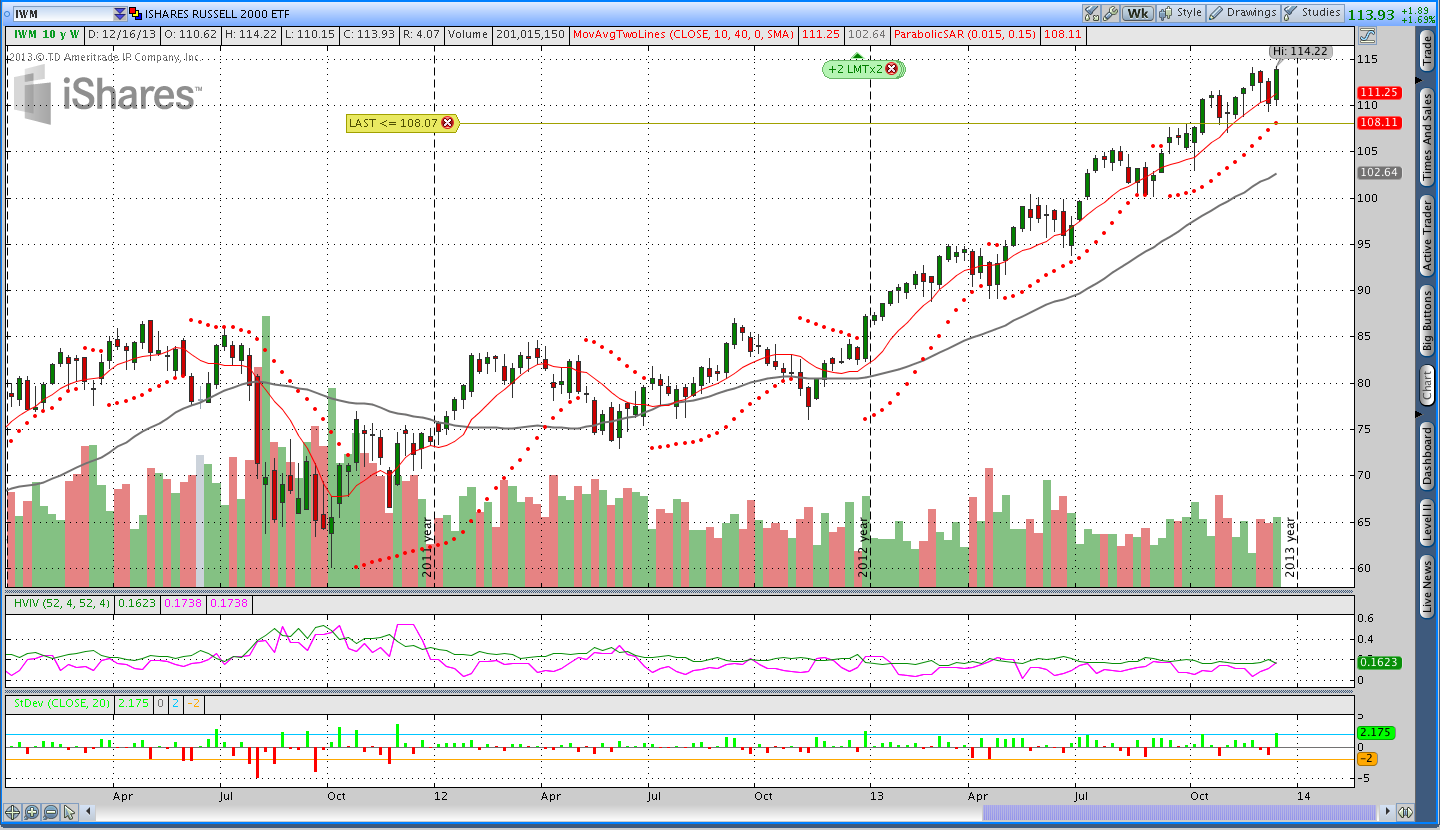
Stocks received a big boost following the Fed announcement and it looks like the threat of a deeper pullback has subsided (for now). The Russell 2000 ($IWM) pushed up to make a new 50 day high on Friday for a strong close on the week.
The only reason I see for concern is that stocks pushed up to to new highs and are now sitting right around or slightly below that level. Essentially, we didn't see a significant breakout to the upside. If price can move higher next week and get a boost via a Santa Claus rally, I'll have more confidence in higher prices ahead. Until that happens, stocks look like they're in a period of consolidation.
 Year to date chart of $SPY with a 50 day Donchian Channel and 3.5xATRts. Price made a move to new highs this week and is sitting slightly below that level. I would be more confident in stocks if price was sitting decisively above the previous highs rather than slightly below them.
 Three-year weekly chart of the Russell 2000 ($IWM) with Parabolic SAR. Price in the Russell pushed higher this week, but, like the $SPY, didn't have a convincing breakout. Regardless, I'm still long.
Gold (GLD: SPDR Gold Shares ETF):
I don't think I can go for more than a week without someone telling me "why" Gold "should" go higher from here. As an accomplished armchair Economist, I can certainly nod and agree with many of those reasons. However, price is our reality. Trade that. At least for now, I'm still short Gold.
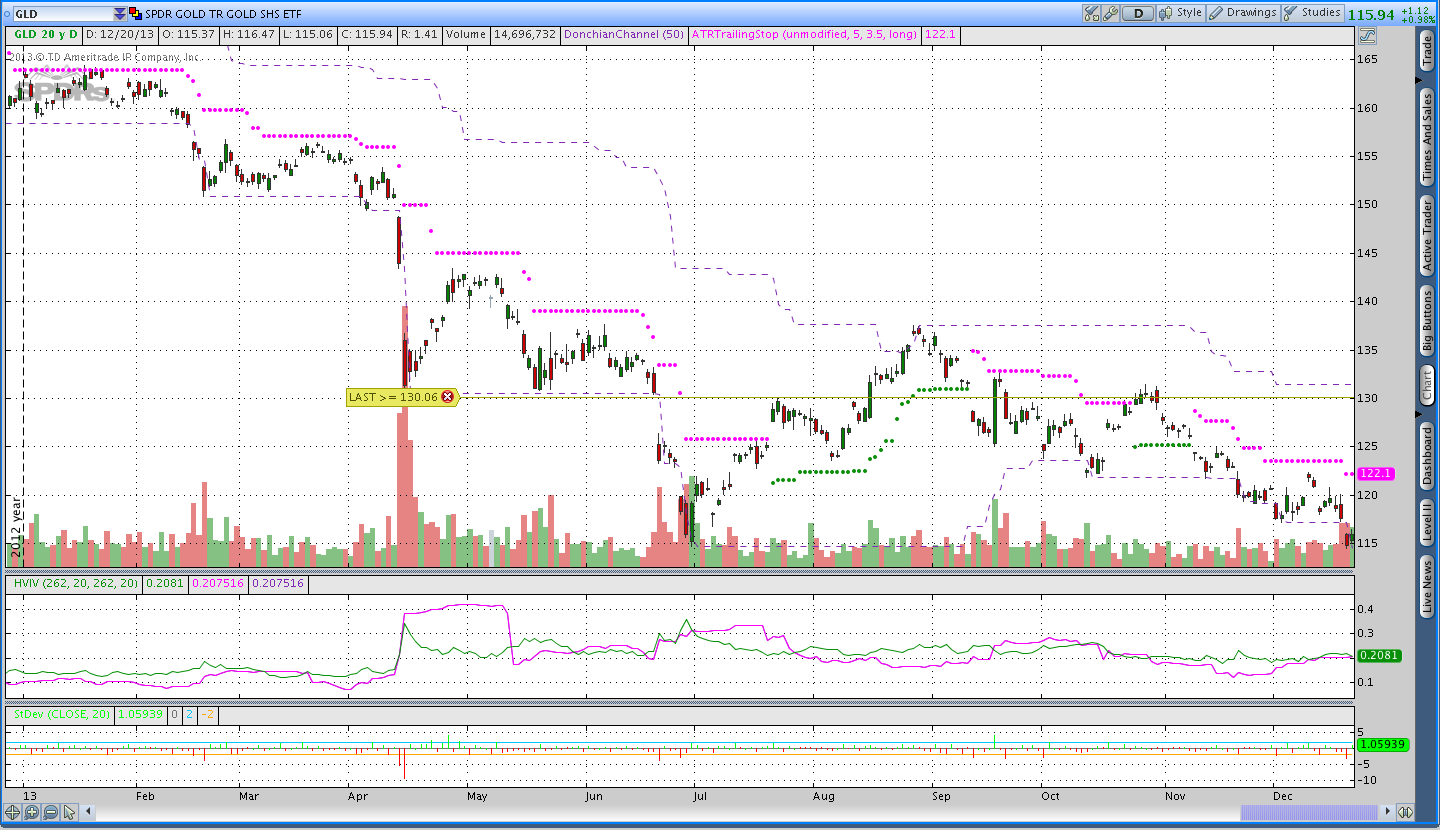
Gold was down again this week and made a big move lower Wednesday night after the Fed and pushed slightly below the June lows. Incidentally, on Tuesday I had a conversation with someone who showed me the performance spread between the $SPY and $GLD. He was saying that the spread was much wider than normal (it did look that way on his chart) and he was looking for a reversion in that spread and was leaning short $SPY and long $GLD. The trade seemed super reasonable, but on Wednesday that spread got much wider.
With Gold sitting close to the June lows, I think some caution is warranted (much like stocks). If price fails to move lower, there is a chance that we could see a sudden reversal to the upside. Maybe all the Fundamentalists will piece together what's left of their broken long Gold accounts and move the market higher? Anything is possible. Daily chart of Gold ($GLD) with a 50 day Donchian channel and 3.5xATRts. Gold broke lower again this week and is sitting near the June lows. A failure to move lower could lead to a sudden reversal.
Bonds (TLT: iShares Barclays 20+ Year Treasury Bond ETF):
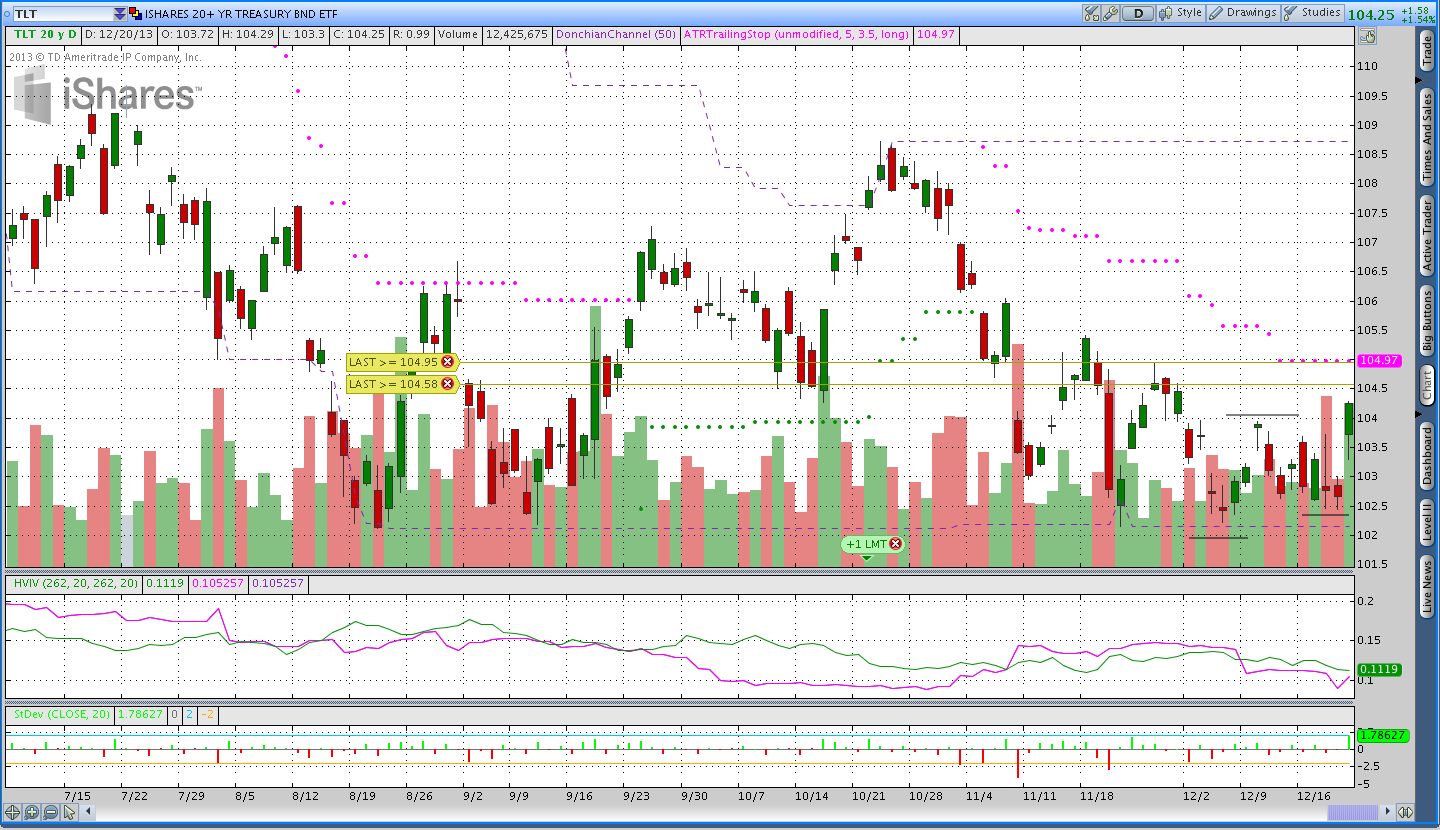
Bonds look like they could be forming a base or potentially even moving higher (against my short position of course). On the daily chart, the trend is still lower, however, we have what appears to be both a higher low and a higher high. Yes, that's the textbook definition of an uptrend . . . a pattern of higher highs and higher lows. The longer term trend is still lower and we haven't seen a violation of the ATRts yet, but bonds were strong on Friday and that left them with a gain on the week. Daily chart of Treasury Bonds ($TLT) with a 50 day Donchian Channel and 3.5xATRts. Bonds firmed up a bit this week and we saw what looks like a higher low and a higher high.
Trades This Week:
IWM - Opened Short March 2014 94 Put for .70 (Naked Option)
SPY - Closed Jan 2014 Strangle 188 Call/162 Put for .49 = Net .41 gain after commissions
Inventory:
IWM - Short Jan 2014 96 Put (sold for .49)
IWM - Short Mar 2014 94 Put (sold for .70)
GLD - Short March 2014 139 Call (sold for .53)
TLT - Feb. 2014 106/106 Call Credit Spread (sold for .70)
Forex Inventory:
NZD/JPY - Long 3,000 notional units at 80.56
USD/JPY - Long 4,000 notional units at 100.61 and long another 4,000 at 101.64
USD/CHF - Short 4,000 notional units from .8874
Looking ahead:
Next week should be a quiet week with the Holidays. The Santa Claus rally, if it materializes, should take place between Christmas and New Years. I won't be entering any new trades next week, but I will be monitoring the markets and managing positions.
