Upcoming US Events for Today:
- Consumer Price Index for January will be released at 8:30am. The market expects a month-over-month increase of 0.1% versus an increase of 0.3% previous. Less Food and Energy, the index is expected to increase by 0.2% versus an increase of 0.1% previous.
- Weekly Jobless Claims will be released at 8:30am. The market expects Initial Claims to show 335K versus 339K previous.
- Flash Manufacturing PMI for February will be released at 8:58am. The market expects 53.5 versus 53.7 previous.
- Philadelphia Fed Survey for February will be released at 10:00am. The market expects 8.0 versus 9.4 previous.
- Leading Indicators for January will be released at 10:00am. The market expects a month-over-month increase of 0.2% versus an increase of 0.1% previous.
- Weekly Crude Inventories will be released at 11:00am.
Upcoming International Events for Today:
- German PPI for January will be released at 2:00am EST. The market expects a year-over-year decline of 0.9% versus a decline of 0.5% previous.
- German Flash Manufacturing PMI for February will be released at 3:30am EST. The market expects 56.3, consistent with the previous report. Flash PMI Services is expected to show 53.5 versus 53.6 previous.
- Euro-Zone Flash Manufacturing PMI for February will be released at 4:00am EST. The market expects 53.9, consistent with the previous report. Flash PMI Services is expected to show 52.0 versus 51.9 previous.
- Great Britain Industrial Trends Survey for February will be released at 6:00am EST. The market expects 6.5 versus –2 previous.
- Euro-Zone Consumer Confidence for February will be released at 10:00am EST. The market expects –11.0 versus –11.7 previous.
Recap of Yesterday’s economic Events:
| Event | Actual | Forecast | Previous |
| JPY All Industry Activity Index (MoM) | -0.10% | 0.10% | 0.40% |
| JPY Leading Index | 111.7 | 112.1 | |
| JPY Coincident Index | 111.7 | 111.7 | |
| GBP Claimant Count Rate | 3.60% | 3.60% | 3.70% |
| GBP Jobless Claims Change | -27.6K | -20.0K | -27.7K |
| EUR Euro-Zone Construction Output s.a. (MoM) | 0.90% | -0.20% | |
| EUR Euro-Zone Construction Output w.d.a. (YoY) | -0.20% | -1.60% | |
| CHF ZEW Survey (Expectations) | 28.7 | 36.4 | |
| USD MBA Mortgage Applications | -4.10% | -2.00% | |
| USD Producer Price Index (YoY) | 1.20% | 1.20% | 1.10% |
| USD Producer Price Index Ex Food & Energy (YoY) | 1.30% | 1.40% | 1.20% |
| CAD Wholesale Sales (MoM) | -1.40% | -0.40% | -0.20% |
| USD Housing Starts | 880K | 950K | 1048K |
| USD Housing Starts (MoM) | -16% | -4.90% | -4.80% |
| USD Building Permits | 937K | 975K | 991K |
| USD Building Permits (MoM) | -5.40% | -1.60% | -2.60% |
| USD Producer Price Index (MoM) | 0.20% | 0.10% | 0.10% |
| USD Producer Price Index Ex Food & Energy (MoM) | 0.20% | 0.10% | 0.00% |
| JPY Merchandise Trade Balance Total (Yen) | -¥2790.0B | -¥2487.0B | -¥1304.2B |
| JPY Merchandise Trade Exports (YoY) | 9.5 | 12.7 | 15.3 |
| JPY Merchandise Trade Imports (YoY) | 25 | 22.7 | 24.7 |
The Markets
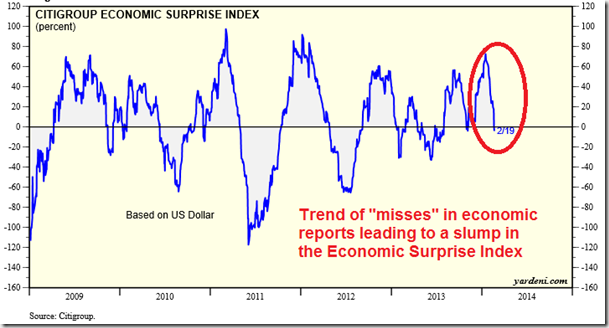
Stocks ended lower on Wednesday as investors digested the FOMC minutes from the latest meeting. The intention of the central bank is to continue to trim bond purchases in a predictable manner, barring any shocks to the economy this year. The Fed, however, refrained from mentioning the recent string of weaker than expected economic reports, housing starts being the latest, leading investors to doubt the commitment of the Fed to maintain appropriate levels of accommodation during adverse conditions. Economic data has been consistently missing expectations over recent weeks, leading to speculation that the “taper” will be “tapered” as the Fed will be forced to pause their plan of cutting back on bond purchases until the data stabilizes. Weather is still being used as the excuse for the recent weakness in economic reports. The trend of economic “misses” has pulled down on the Citigroup Economic Surprise Index, typically a headwind to equity prices in a non-QE environment.
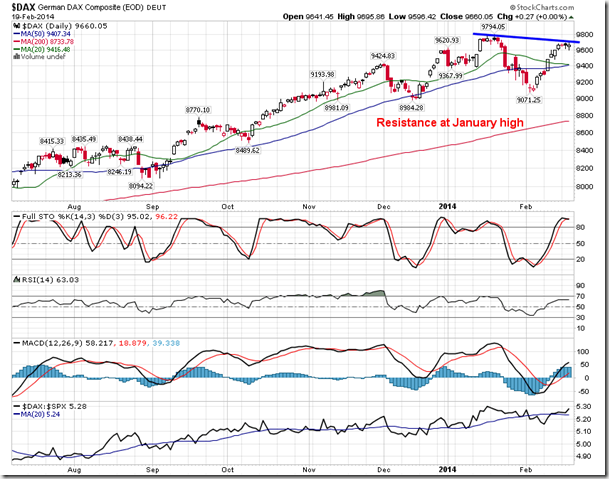
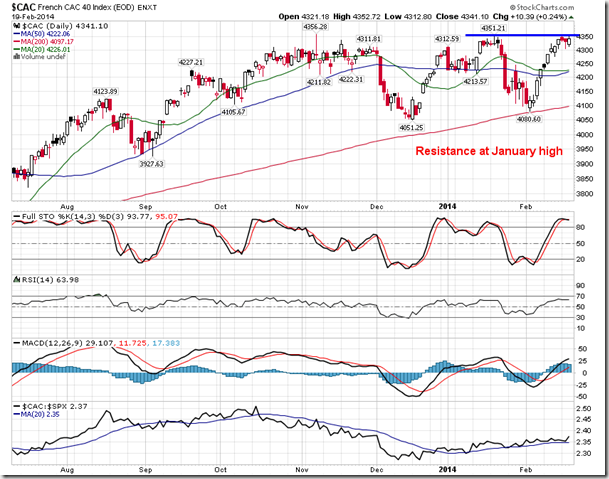
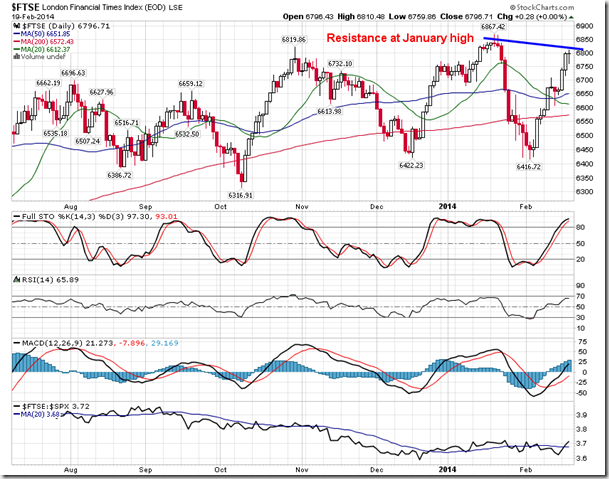
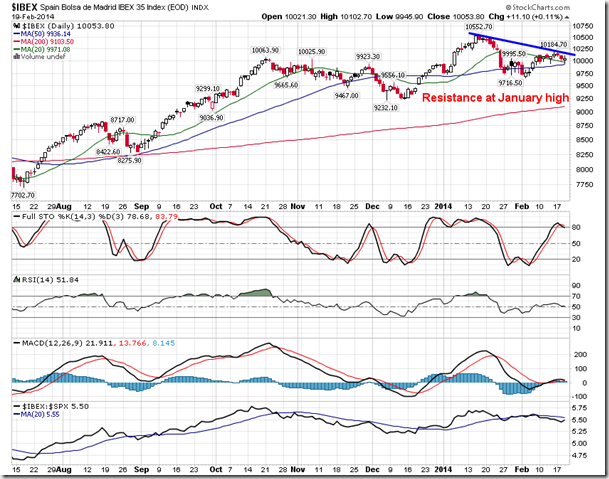
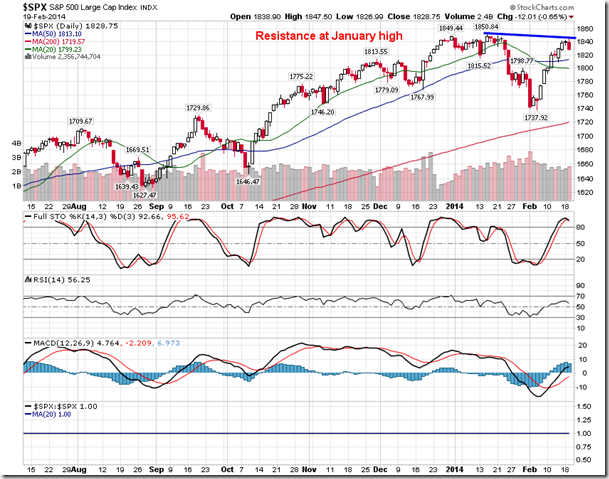
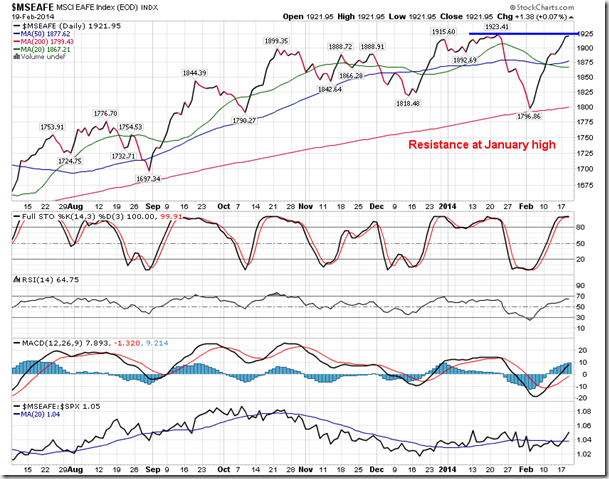
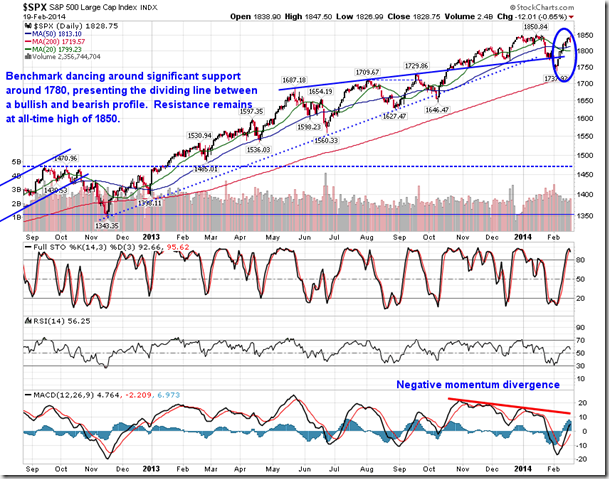
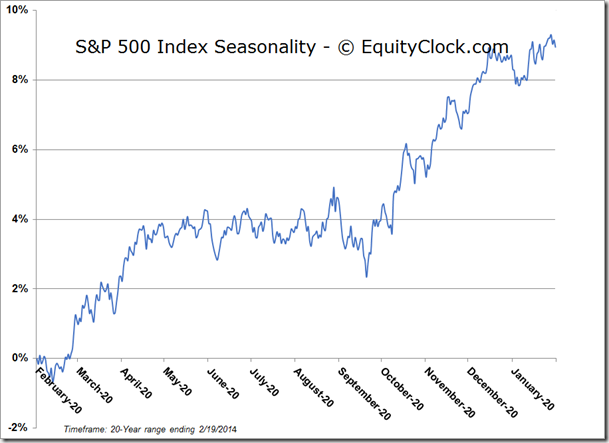
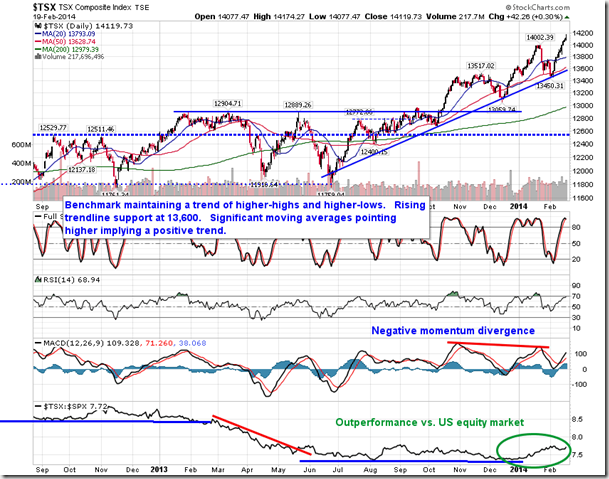
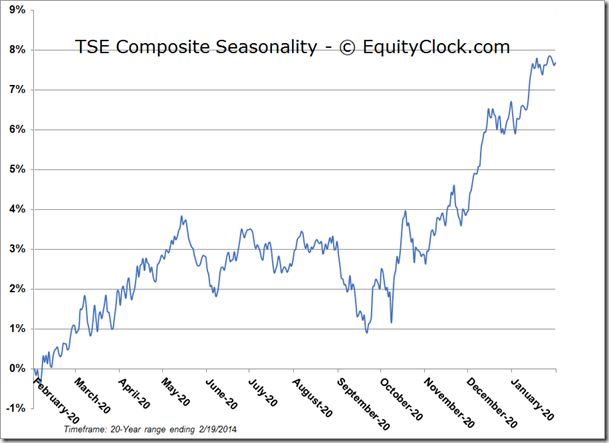
For the most part, equity benchmarks around the globe remain just below resistance presented by the January highs. It remains apparent that a catalyst may be required to fuel a breakout. Without a breakout, some very clear topping patterns would be derived, either a double-top or head-and-shoulders, likely leading to the start of the widely discussed correction that continues to be debated. However, it still remains premature to speculate that a lower-high has been derived (but stay on your toes in case it does). Seasonal tendencies for equity markets around the globe remain positive through to April and May.
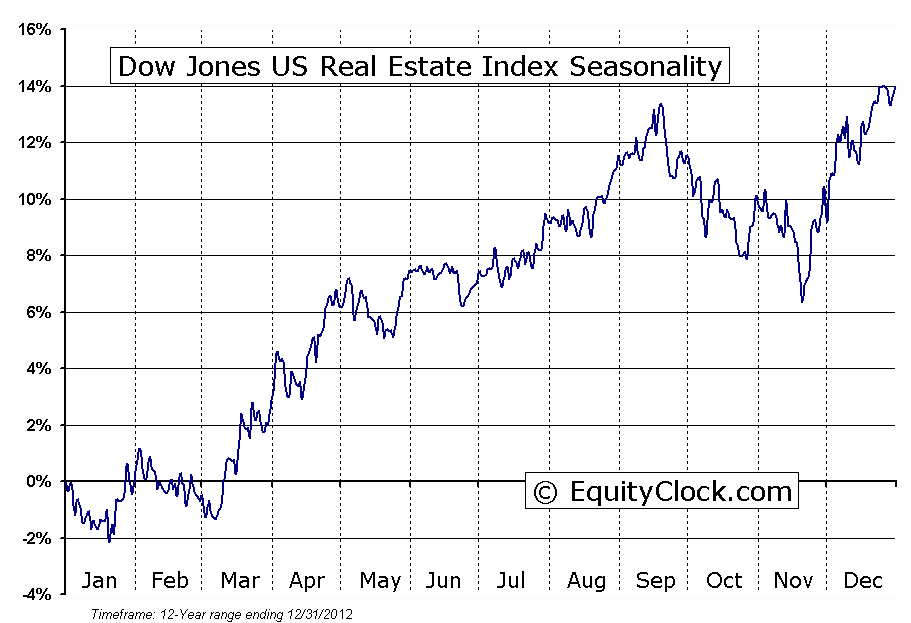
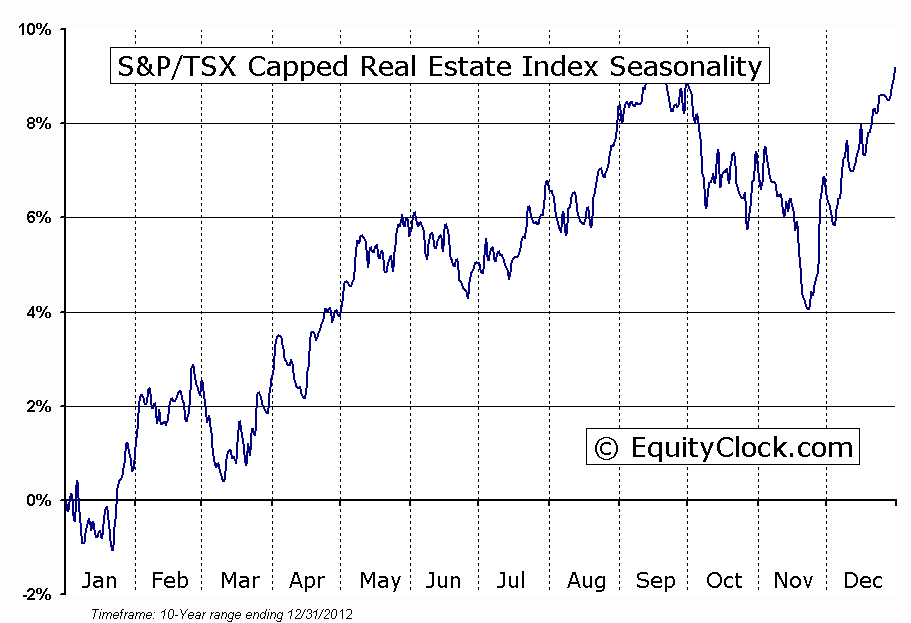
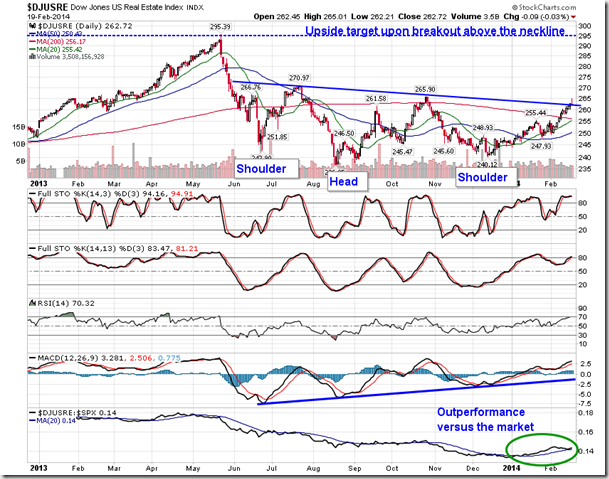
While broad equity benchmarks are hinting at potential topping patterns, one sector is suggesting a substantial bottoming pattern. With rates on the rise throughout 2013, REITs came under pressure, failing to participate in the broad market rally. The Dow Jones US Real Estate Index is now showing the appearance of an intermediate-term reverse head-and-shoulders bottoming pattern; a breakout above the neckline of the pattern, around 265, would target last May’s high around 295, or around 12% higher than present levels. Outperformance of the sector versus the market has been apparent since the year began. REITs have two periods of seasonal strength: the first occurs in the Spring from March through to May and the second occurs in the Summer from July through to September.
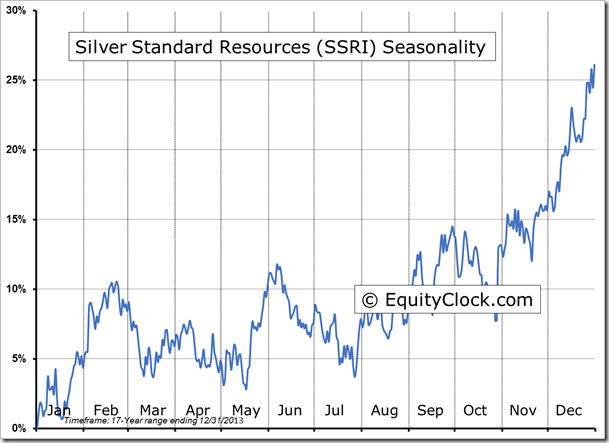
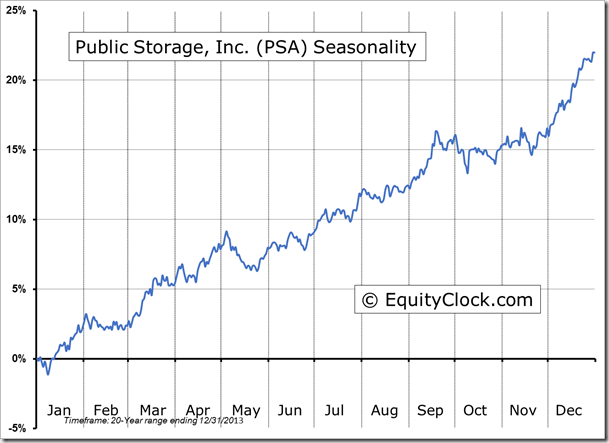
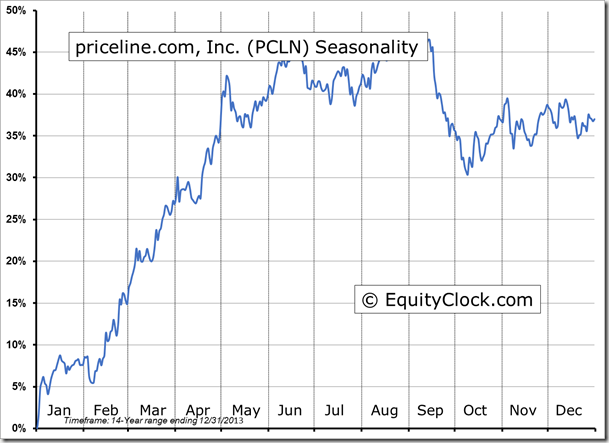
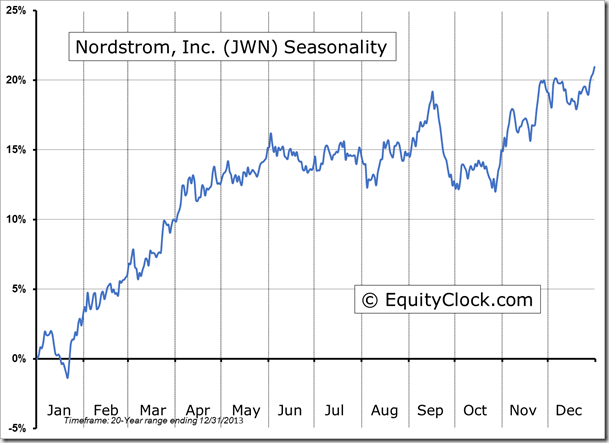
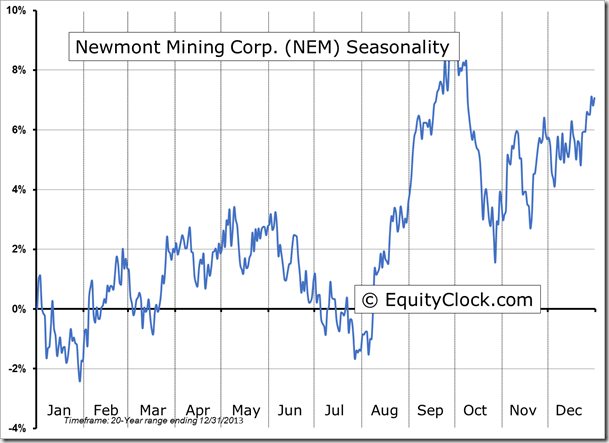
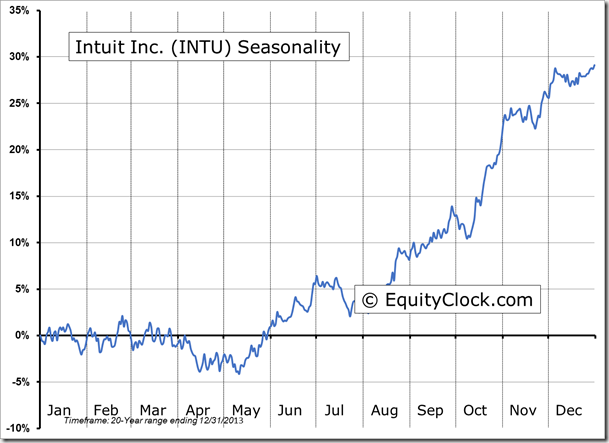
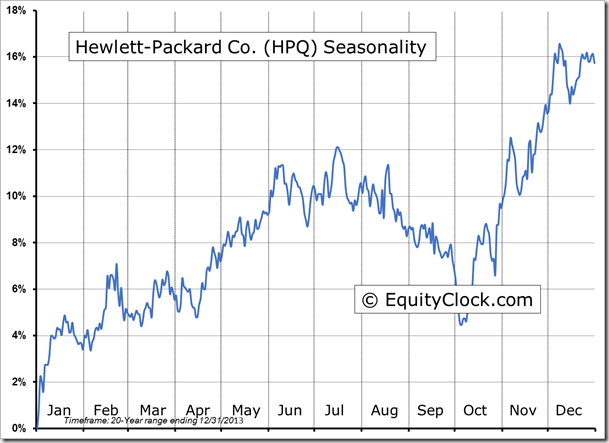
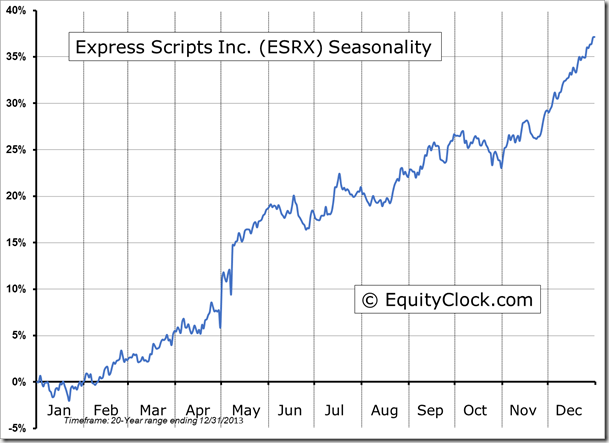
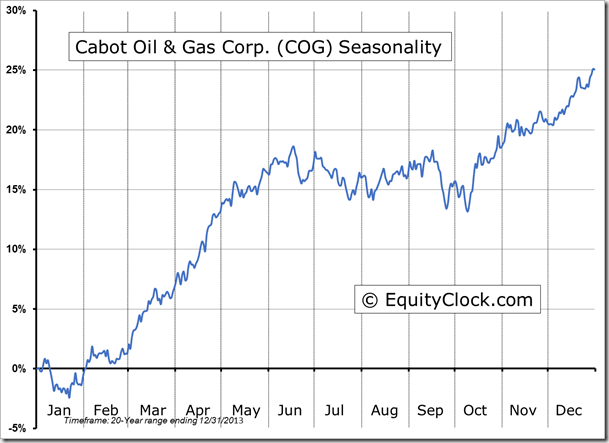
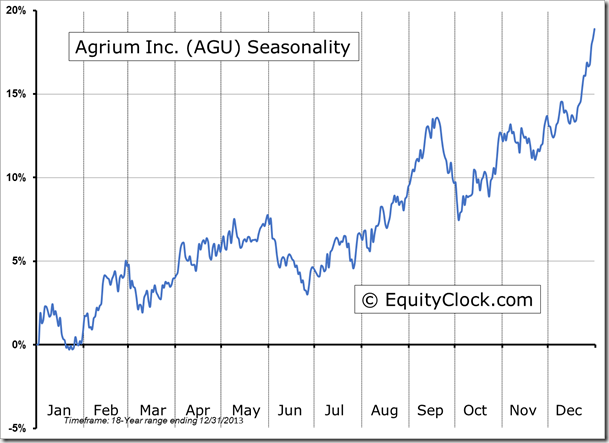
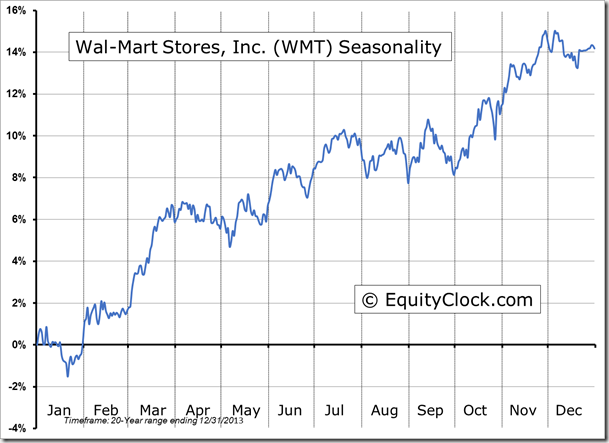
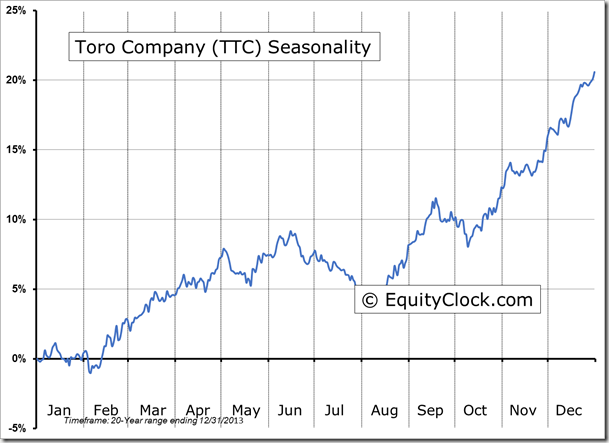
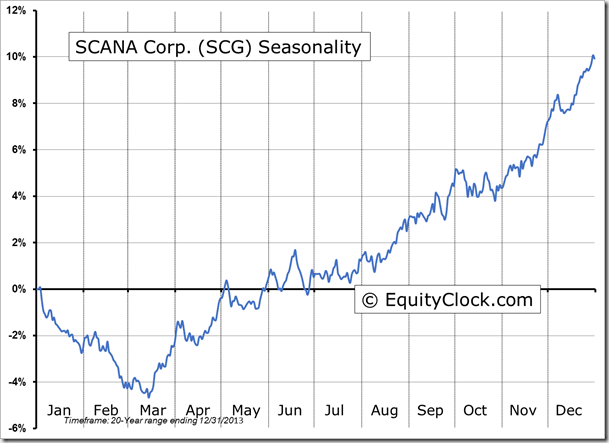
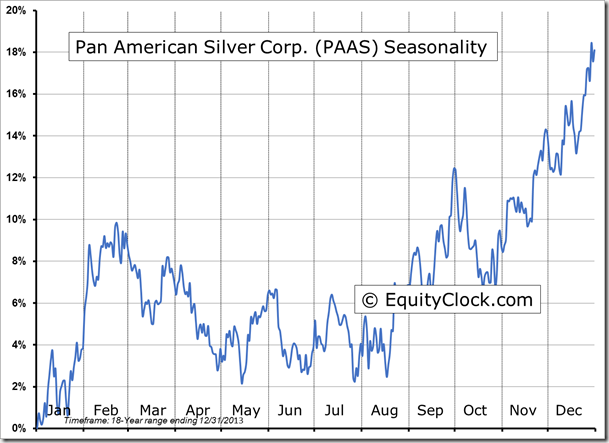
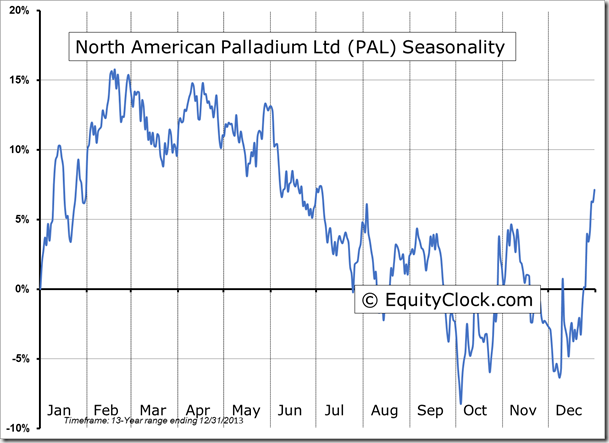
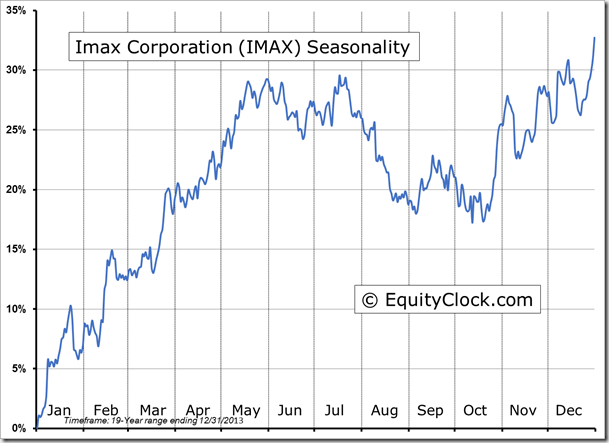
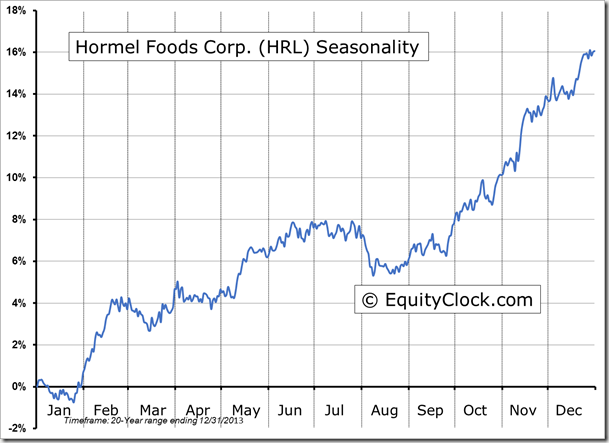
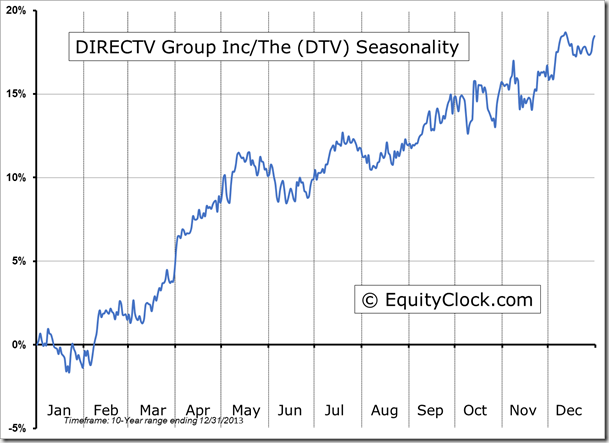
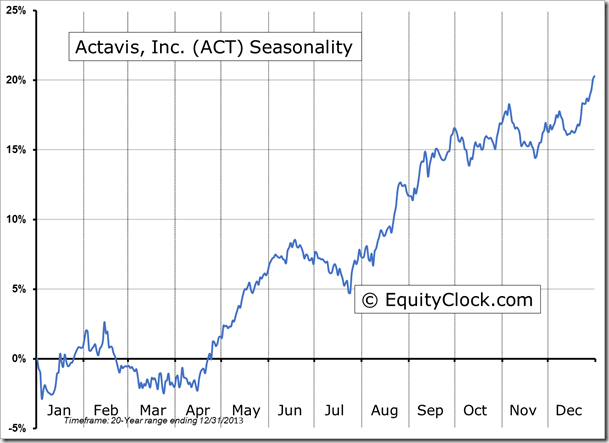
Seasonal charts of companies reporting earnings today:
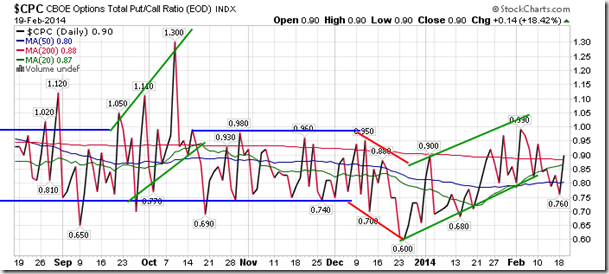
Sentiment on Wednesday, as gauged by the put-call ratio, ended bullish at 0.90.
S&P 500 Index
TSE Composite
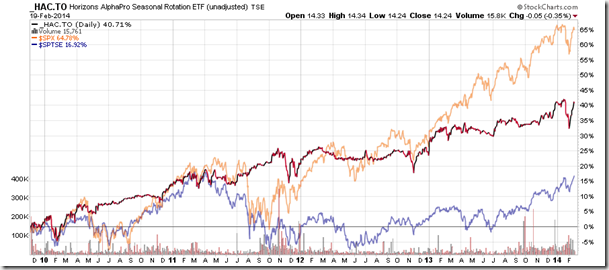
Horizons Seasonal Rotation ETF (TSX:HAC)
- Closing Market Value: $14.24 (down 0.35%)
- Closing NAV/Unit: $14.23 (down 0.52%)
Performance*
| 2014 Year-to-Date | Since Inception (Nov 19, 2009) | |
| HAC.TO | -0.49% | 42.3% |
