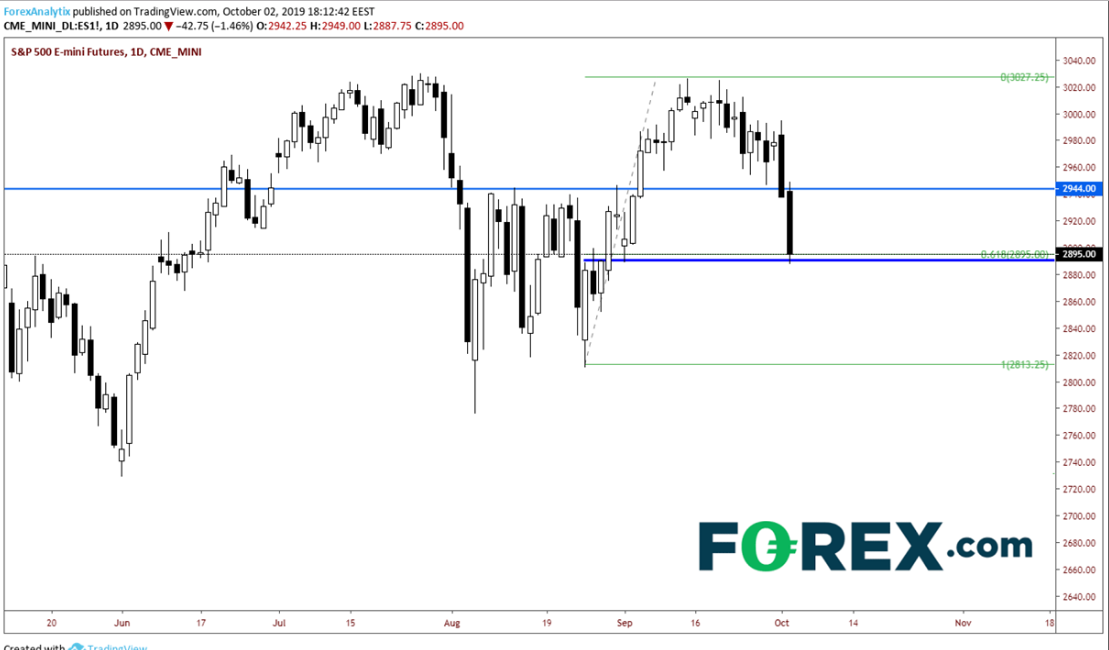
The S&P 500 continued the selloff that began yesterday, which was only exacerbated by today’s worse-than-expected ADP Nonfarm Employment Change for September. Although the headline number was in line for the most part (135K vs 140K expected), it was the revision from August's 195K down to 157K, which made this data much worse than expected. This comes after yesterday’s worse-than-expected US ISM Manufacturing PMI for September. The S&P 500 is down more than 100 handles over the past 2 days, near 2891.
The daily chart shows S&P 500 broke key support near 2944, which was strong horizontal resistance on the way up. Currently, price is sitting at the 61.8% retracement from the August 26 lows to the September 13 highs. If price breaks lower from here, it could possibly retrace all the way back down to 2813.

Source: Tradingview, FOREX.com, CME
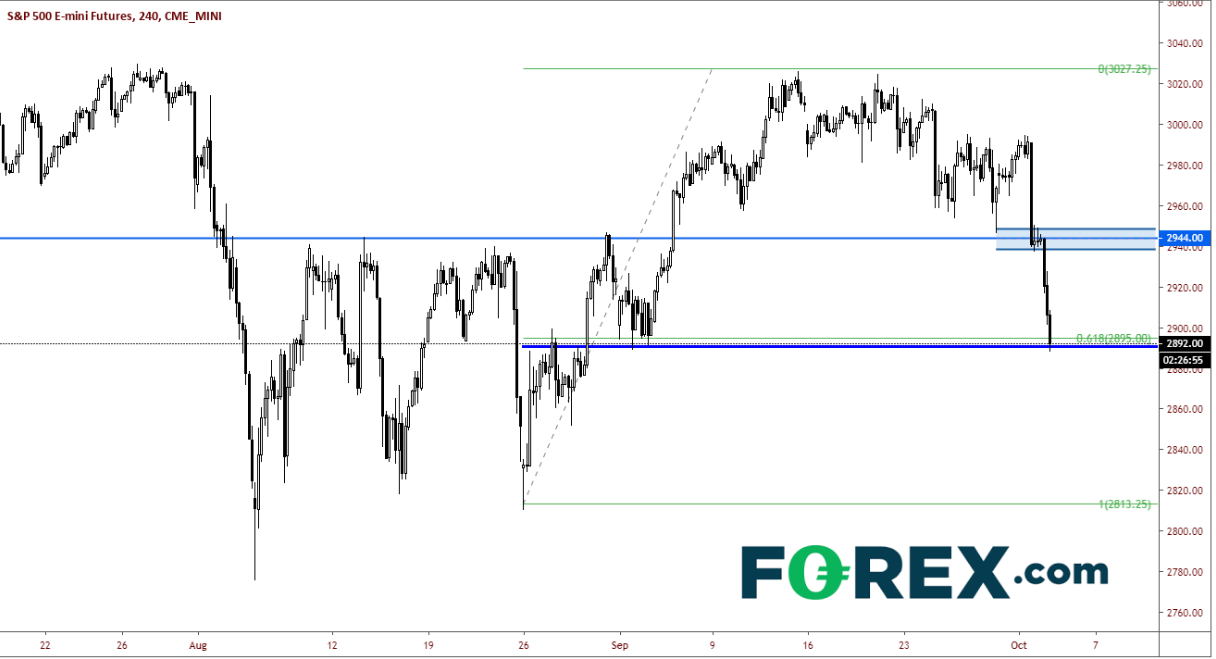
If we zoom in on a 240-minute chart, resistance doesn’t come into play until way above the 2440/2450 zone.

Source: Tradingview, FOREX.com, CME
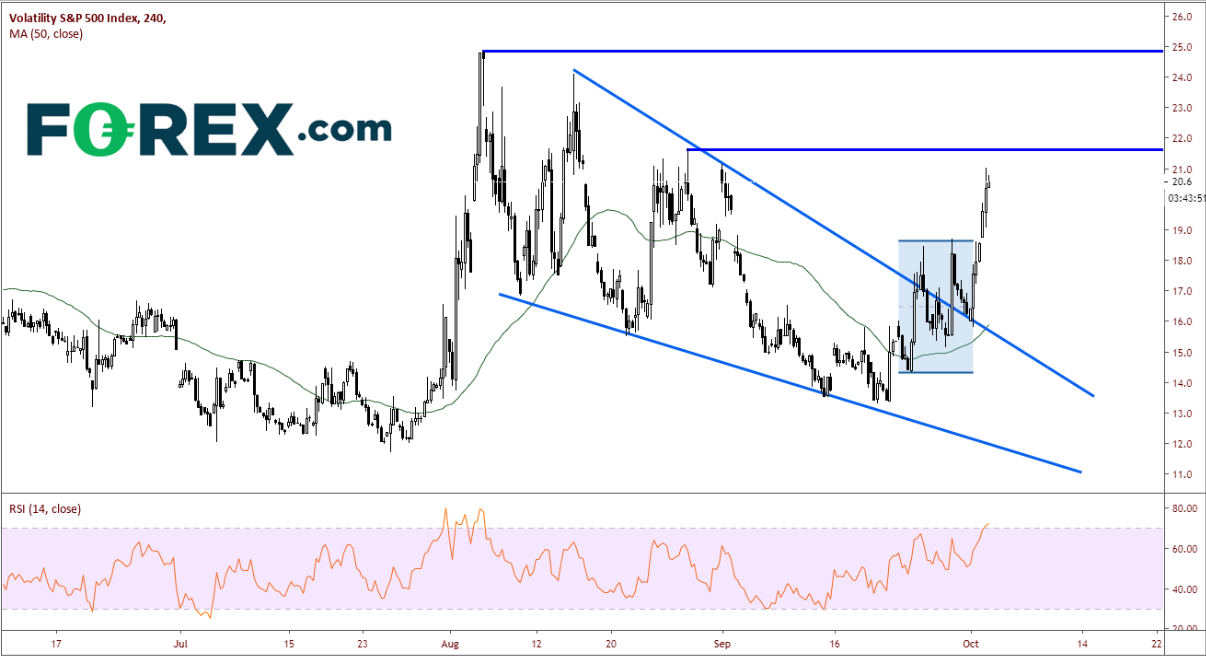
As one would expect, the Volatility Index, better know as the VIX, has gapped higher today. The 240-minute chart shows the VIX broke out of a descending wedge in late September and came back to test the downward-slowing trendline twice before finally breaking higher today. Horizontal resistance comes in at 21.60. Above that is the August 5 highs at 24.80. First support is back at the gap at 18.60. (note that the RSI is moving into overbought territory, so we may see a pullback shortly, or at least a sideways move so the RSI indicator can move back within the neutral range).

Source: Tradingview, FOREX.com
The next catalyst seems like it could come from anywhere at this point. The American political atmosphere is extremely contentious, Brexit discussions are ongoing and Friday brings the always-watched Nonfarm Payrolls from the US.
As always, be on alert for headlines and tweets.
