⏳ Final hours! Save up to 60% OFF InvestingProCLAIM SALE

Stocks Pulling Back After Unprecedented Moves Higher

Published 06/09/2020, 06:56 AM
Updated 11/16/2024, 07:53 AM
C
-
EWY
-
SPY
-
QQQ
-
NVDA
-
XOM
-
WFC
-
CL
-
MSCI
-

Stocks are falling today. Again, the move higher has been unprecedented, and now stocks are overbought. Can they continue to rally, anything is possible. Should they continue to rally, probably not. The markets are extremely overvalued whether you are valuing it on 2020, 2021, or 2022 earnings multiple.

South Korea (EWY)

Markets around the world are weaker, with South Korea gapping higher for the second day in a row and then fading. The MSCI (NYSE:MSCI) South Korea ETF (NYSE:EWY) is facing a tough downtrend currently that goes back to levels in 2018. So clearly, South Korea has been struggling for several years.
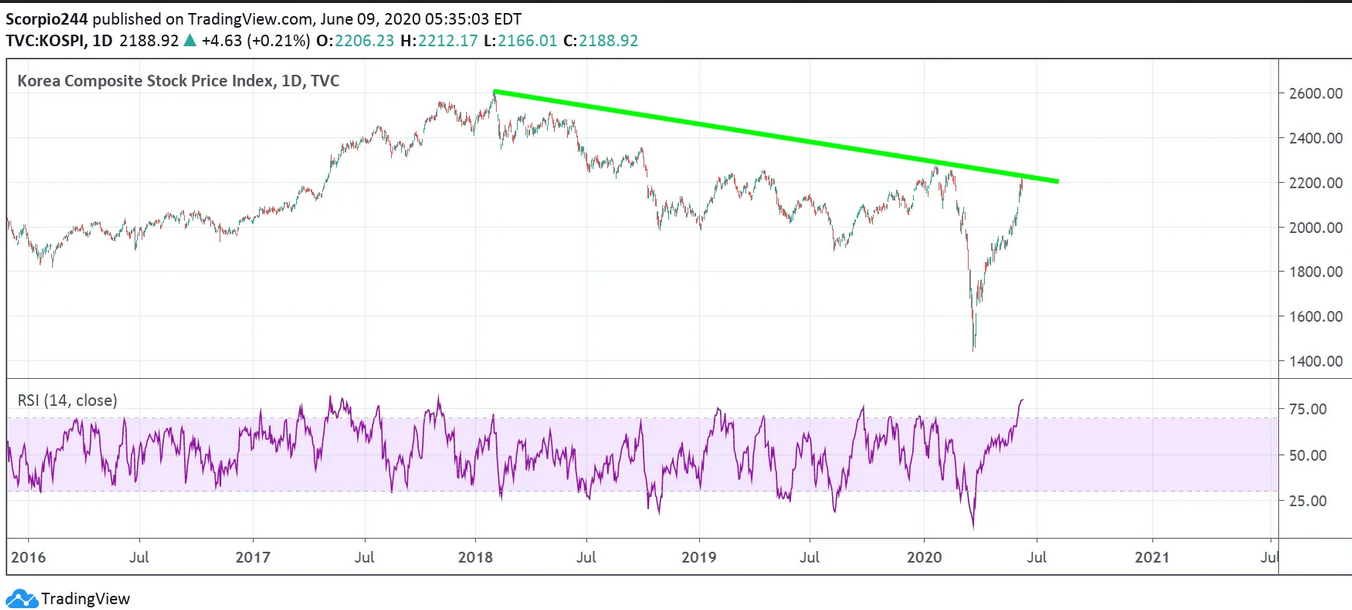
KOSPI Daily Chart

S&P 500 ETF

The {{0|SPDR S&P 500}} (NYSE:SPY) is also moving lower this morning to start the day off. The ETF has support both horizontally and at an uptrend at $312. It is a significant level to watch.
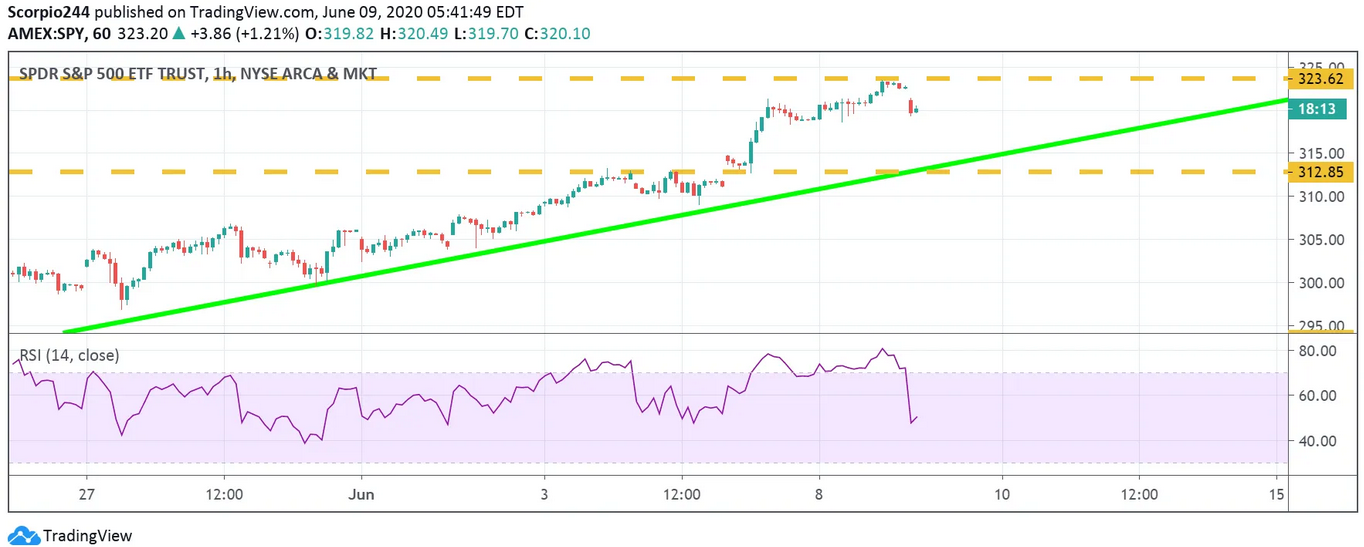
S&P 500 1 Hr Chart

NASDAQ ETF

The QQQ are moving lower too and a drop below $238 takes the ETF below its rising wedge, and a drop below $234 will start making this interesting.
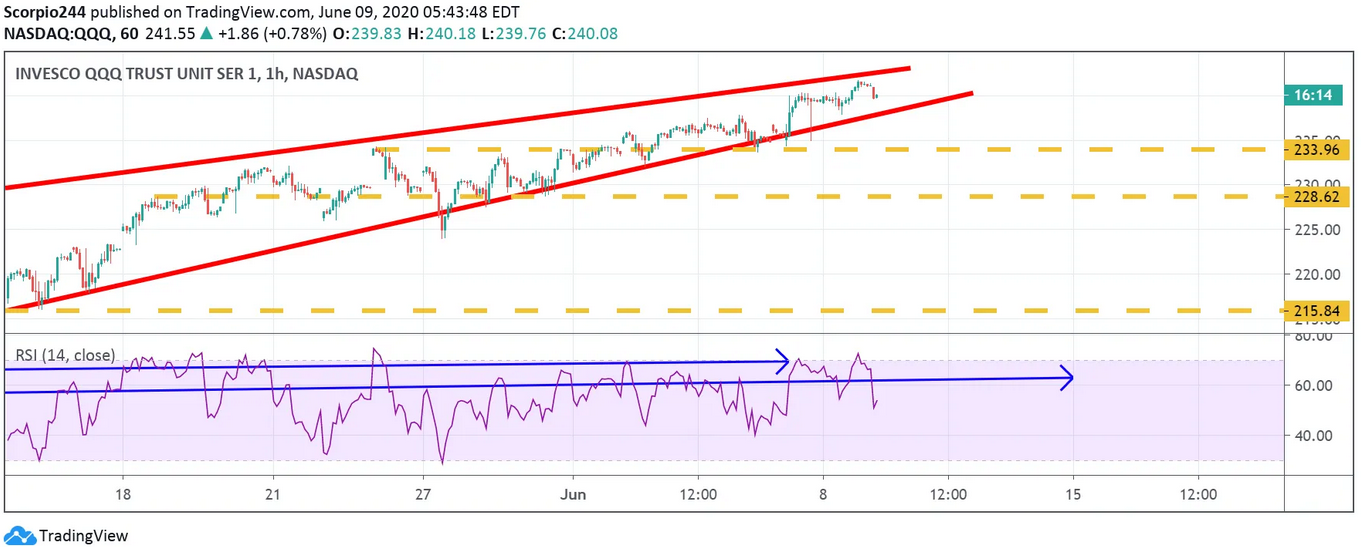
QQQ Chart

10-Year

Maybe the bond market realizes what I told you the other day, that jobs data was not as good as it seemed. Currently, yields have a failed break out at 0.89 basis points.
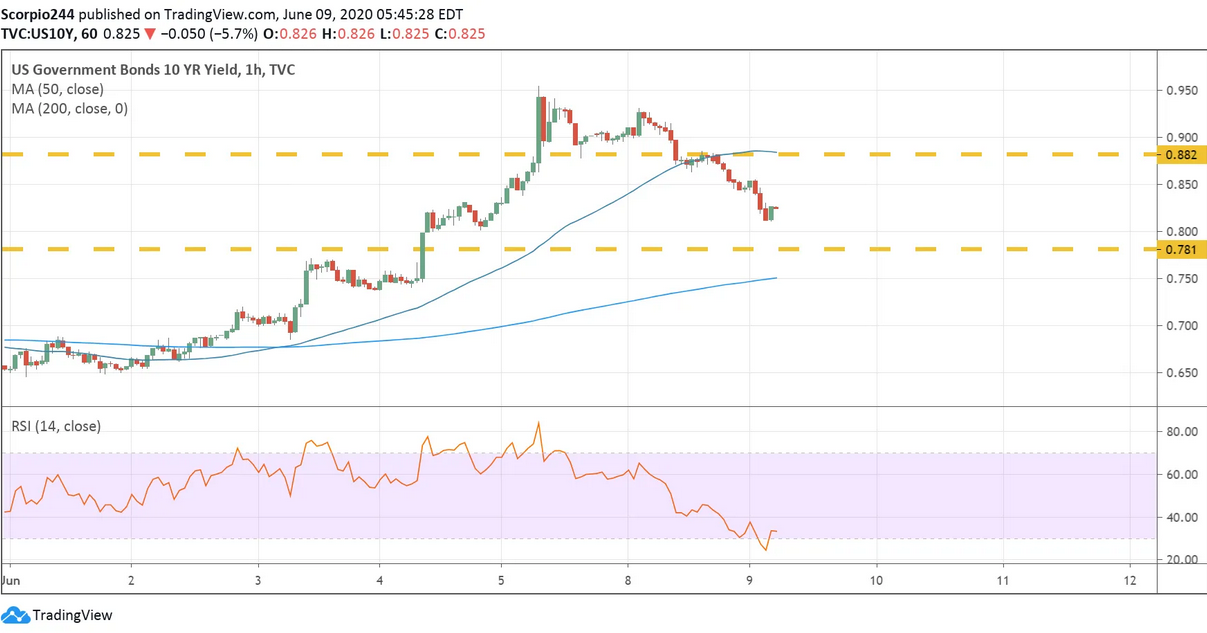
US Bnd 10Yr Yield Cart

Oil

Oil is pulling back too, as it fails to hold a break out at $39.
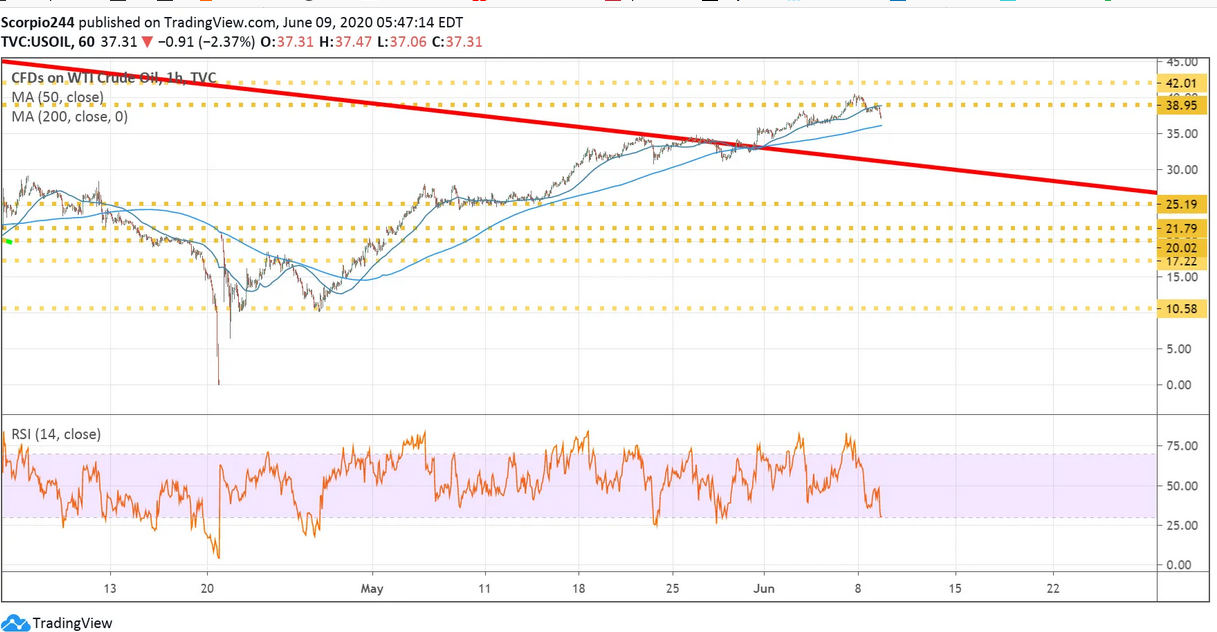
CFDs On WTI Crude Oil Chart

NVIDIA

NVIDIA (NASDAQ:NVDA) is falling some this morning, and at the moment, is moving below the uptrend. Meanwhile, the RSI suggests shares move lower; it is not a flag pattern either.
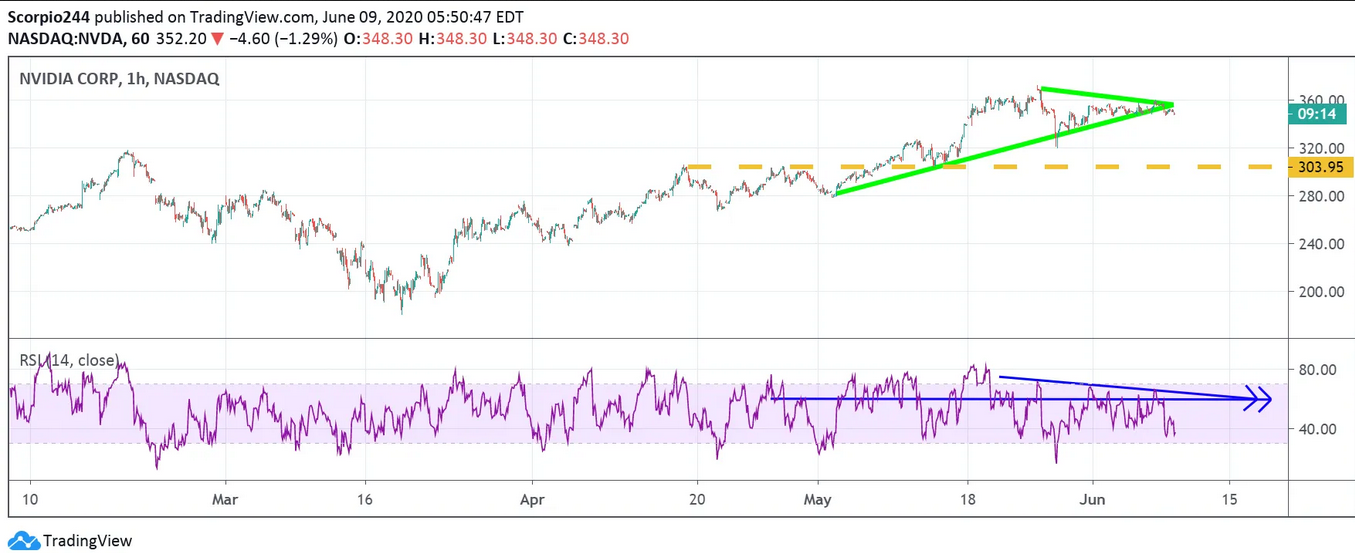
NVIDIA Corp Hourly Chart

Citigroup

It will be interesting to see what happens with these bank stocks. They have been hot, and if they start to fade, that could be a big problem. Citigroup (NYSE:C) is one of those stocks, and we are likely to find out today if they are posting failed breakouts or if they are starting a new uptrend.
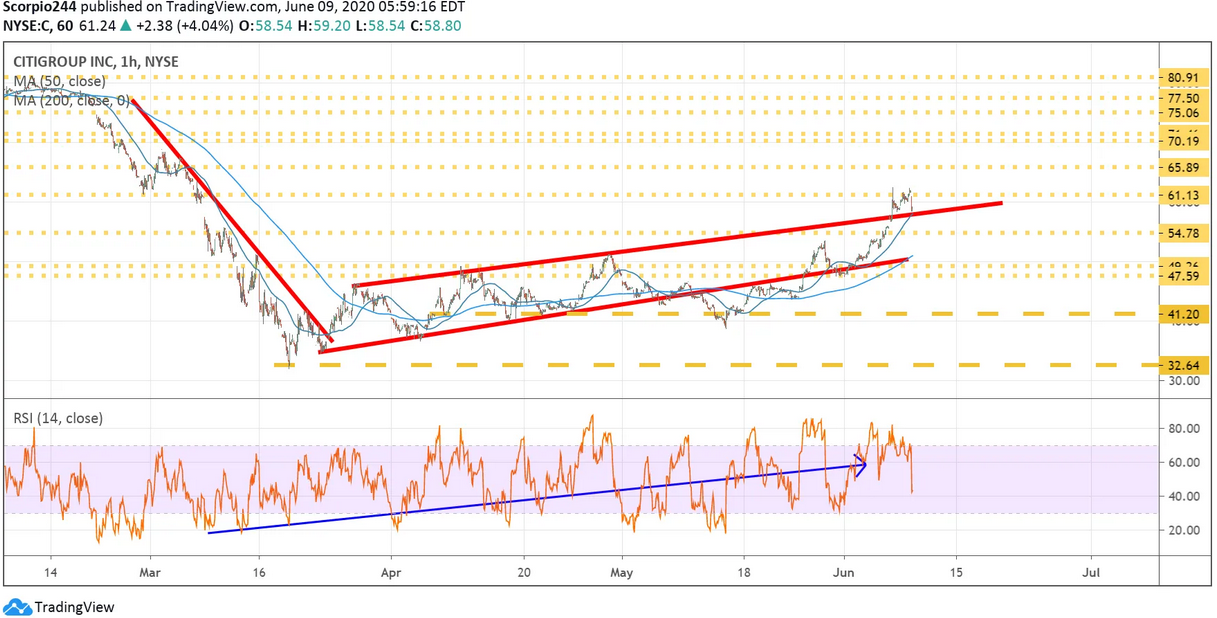
Citigourp Inc Hourly Chart

Wells Fargo

Wells Fargo (NYSE:WFC) has paused at resistance at $33.25, and the stock is overbought. A pullback to $29.60 seems possible.
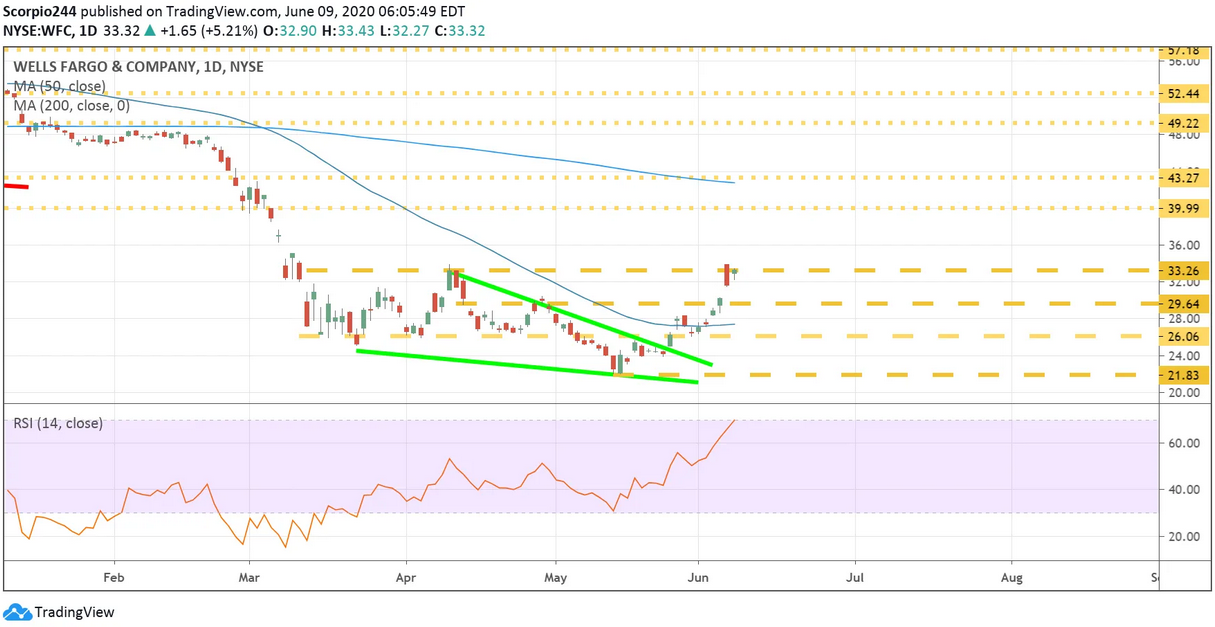
Wells Fargo Daily Chart

Exxon Mobile

Exxon (NYSE:XOM) is falling today after failing to break out at around $54. I noted some bearish betting this stock yesterday, and the potential for shares to fall back to $50.
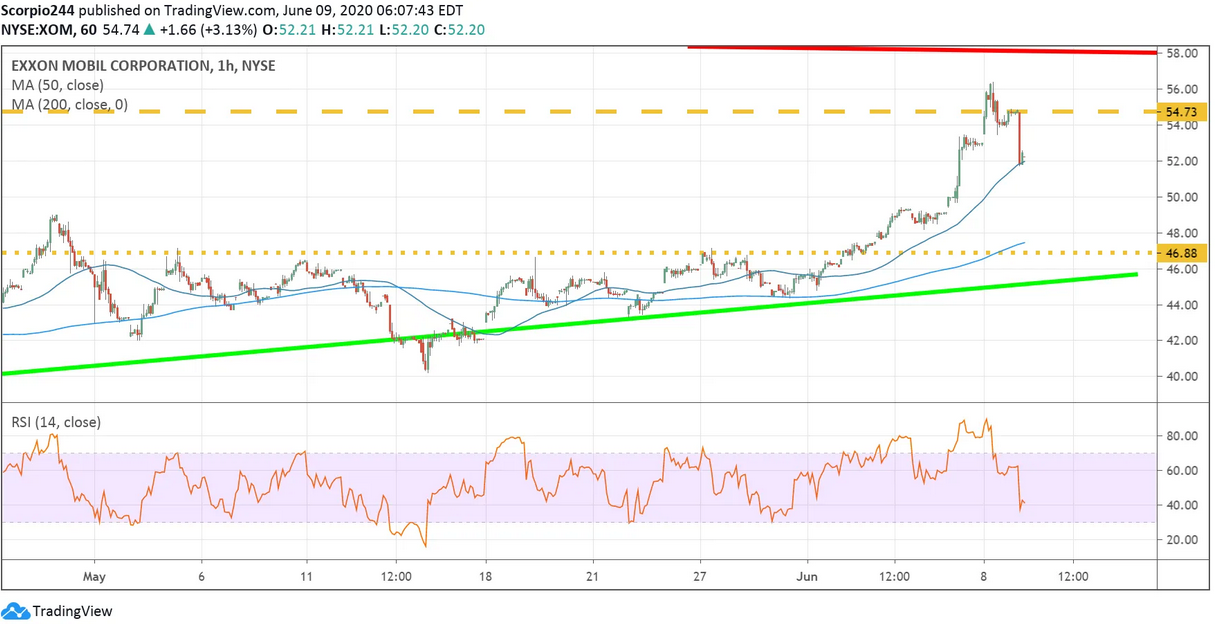
Exxon Mobil Corp Hourly Chart

Original Post

Latest comments

Loading next article…
Risk Disclosure: Trading in financial instruments and/or cryptocurrencies involves high risks including the risk of losing some, or all, of your investment amount, and may not be suitable for all investors. Prices of cryptocurrencies are extremely volatile and may be affected by external factors such as financial, regulatory or political events. Trading on margin increases the financial risks.
Before deciding to trade in financial instrument or cryptocurrencies you should be fully informed of the risks and costs associated with trading the financial markets, carefully consider your investment objectives, level of experience, and risk appetite, and seek professional advice where needed.
Fusion Media would like to remind you that the data contained in this website is not necessarily real-time nor accurate. The data and prices on the website are not necessarily provided by any market or exchange, but may be provided by market makers, and so prices may not be accurate and may differ from the actual price at any given market, meaning prices are indicative and not appropriate for trading purposes. Fusion Media and any provider of the data contained in this website will not accept liability for any loss or damage as a result of your trading, or your reliance on the information contained within this website.
It is prohibited to use, store, reproduce, display, modify, transmit or distribute the data contained in this website without the explicit prior written permission of Fusion Media and/or the data provider. All intellectual property rights are reserved by the providers and/or the exchange providing the data contained in this website.
Fusion Media may be compensated by the advertisers that appear on the website, based on your interaction with the advertisements or advertisers.
© 2007-2024 - Fusion Media Limited. All Rights Reserved.