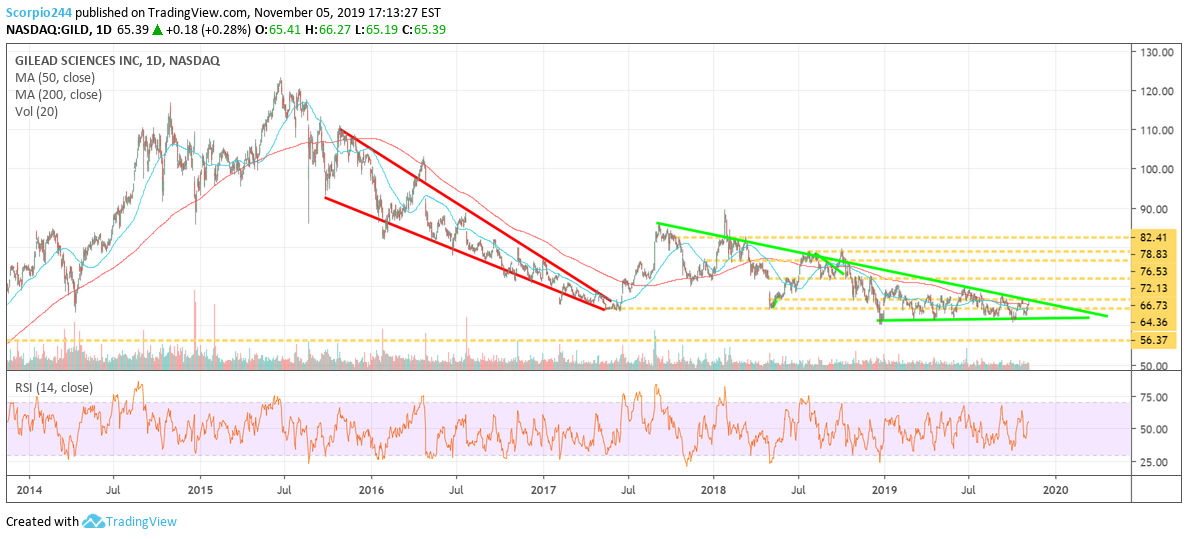
S&P 500 Look Worn Out
Stock’s had a day, and that could be because the SPDR S&P 500 (NYSE:SPY) is simply running out of steam. There are a bunch of gaps that needed to be filled on the chart, and maybe its time for those gaps to get filled. The first significant gap comes at around 3,060, and then another at 3,030. It is undoubtedly nothing serious by any means, but it is worth noting and would at least suggest to me that patience is needed in the days ahead, and chasing stocks higher at this point may not be wise.
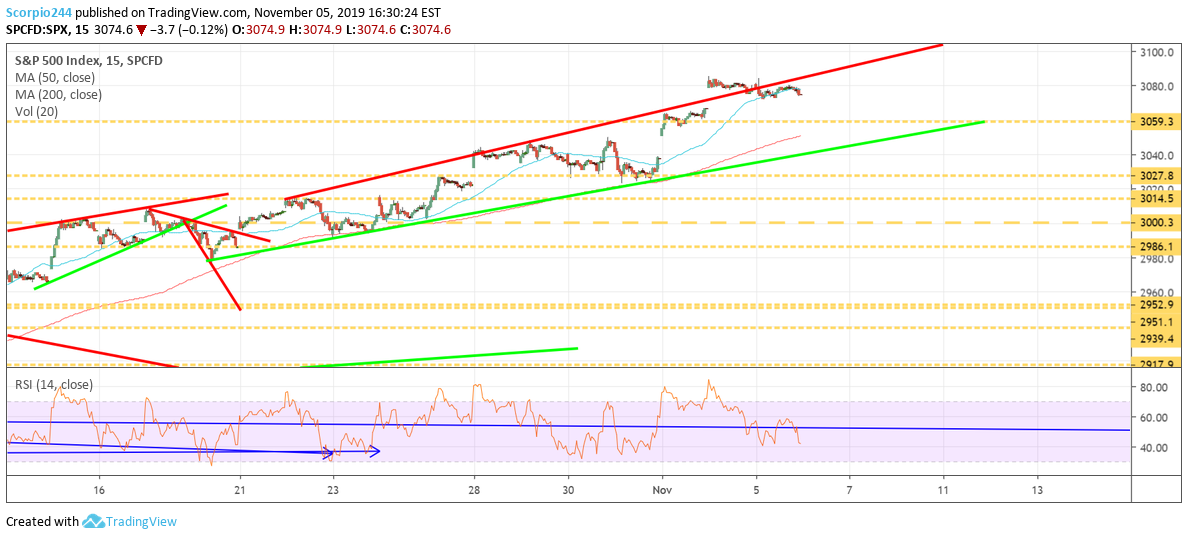
Stocks Above Their 50-Day
Again, the number of shares above their 50 day moving average continues to be at the very high end of the range, and it too supports the notion that a short-term pullback is in store.
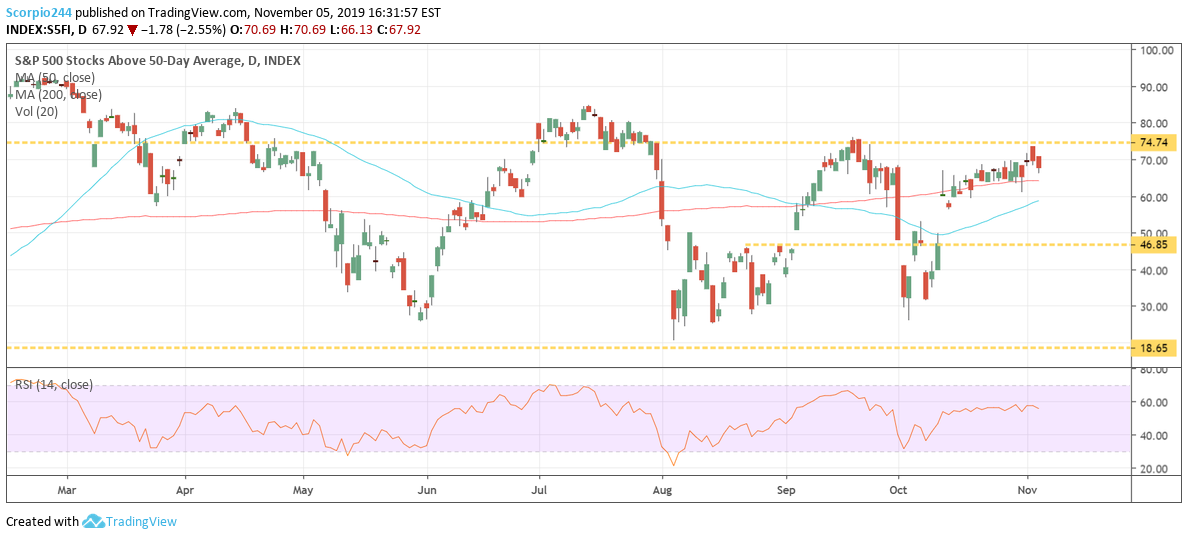
Semis Are Toppy
Semiconductor stocks also look overbought at current levels, with an RSI at 70 and declining levels of volume. It suggests to me the SMH is likely to pullback perhaps to around $129.
Micron Stands Out
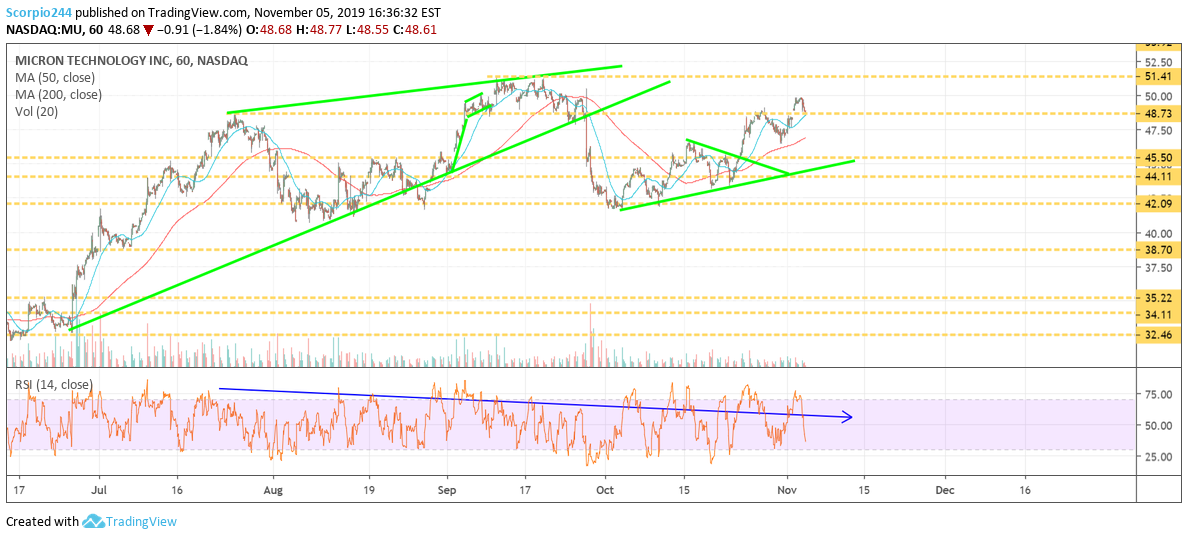
I did note today that Micron Technology (NASDAQ:MU) is starting to see some bullish betting suggesting that MU rises into the low to mid-’50s. The chart is supportive of such a move too. The stock appears to have plenty of technical support in the $48 to $48.75 region.
Shopify Looks Ugly
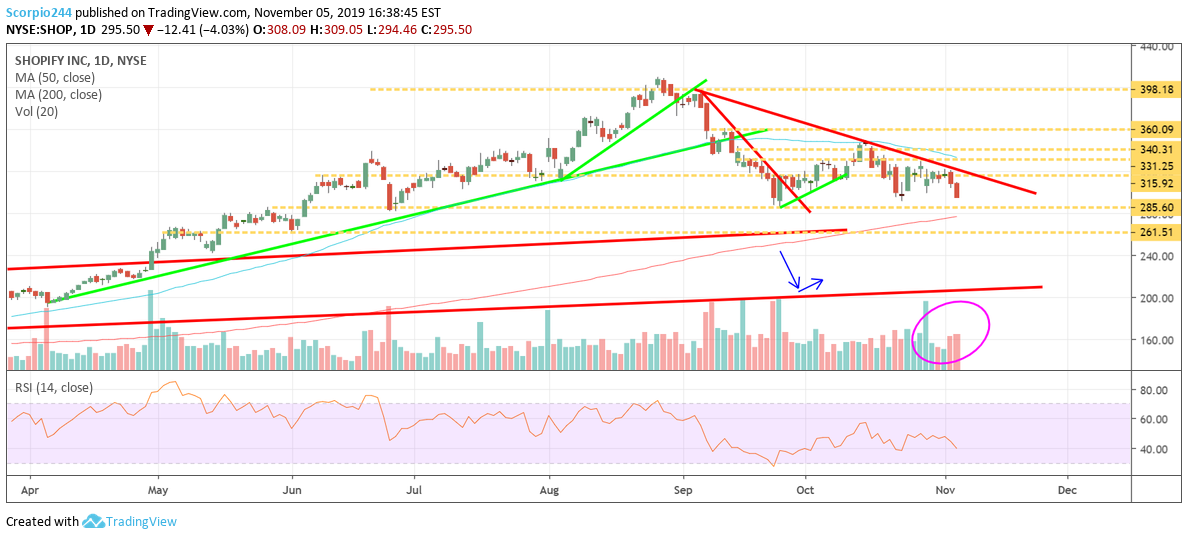
Shopify Inc (NYSE:SHOP) does not look healthy to me at all. I talked about today in the mid-day audio file. But the most glaring thing on the chart is the rising volume the last two days as the stock as fallen, a telltale sign of sellers stepping into the name. I’d be careful, $285 may be closer than you think.
Snap's Post Earnings Run Over?
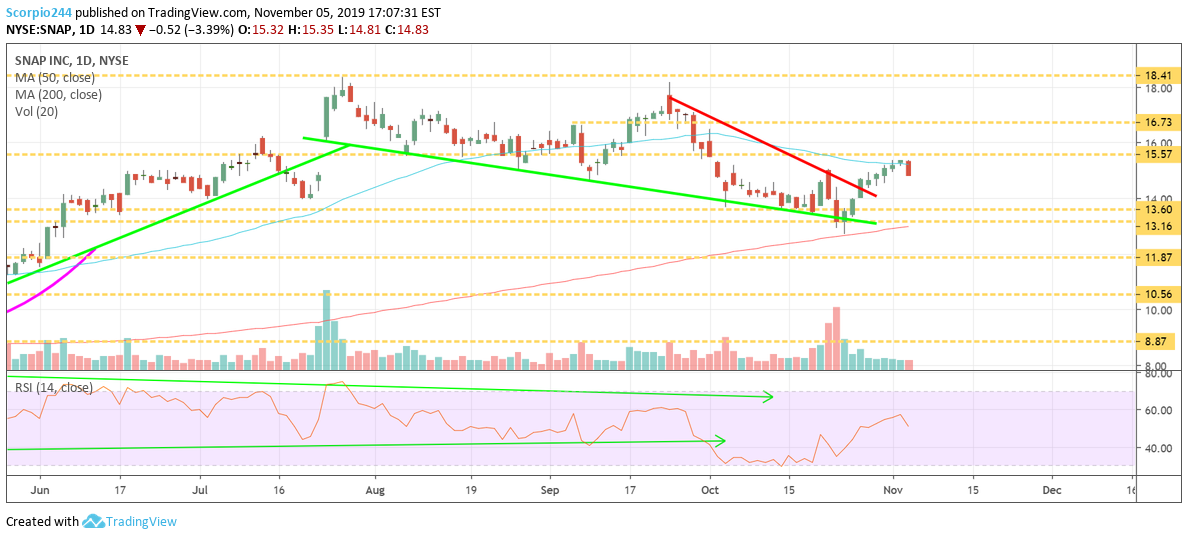
Snap Inc (NYSE:SNAP) did not have a good day falling by about 3.5%. SNAP hit resistance and is now at risk of declining. I did observe some buying of the November 15 $13 puts. It seems like a long-shot on the surface, and more like a cheap directional bet, the stock falls. Snap’s stock can move quickly, as we all know. $13.60 is the next significant level of support.
Splunk Nears A Big Break Out – I Own
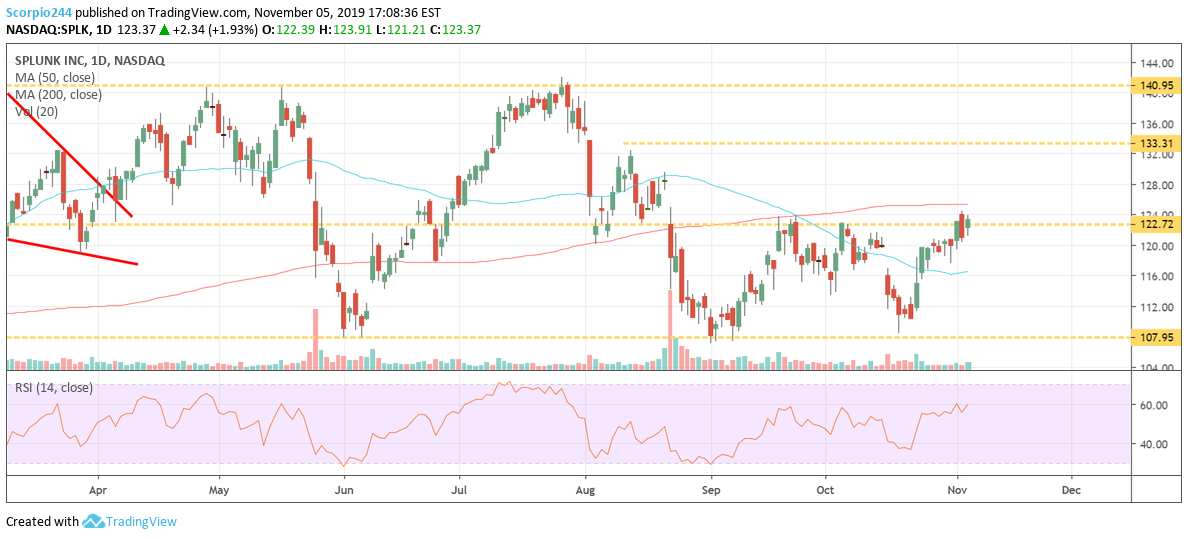
Splunk (NASDAQ:SPLK) is very close to a big break out at $123 that could get the stock moving back to $133. Again, I talked about this one earlier today.
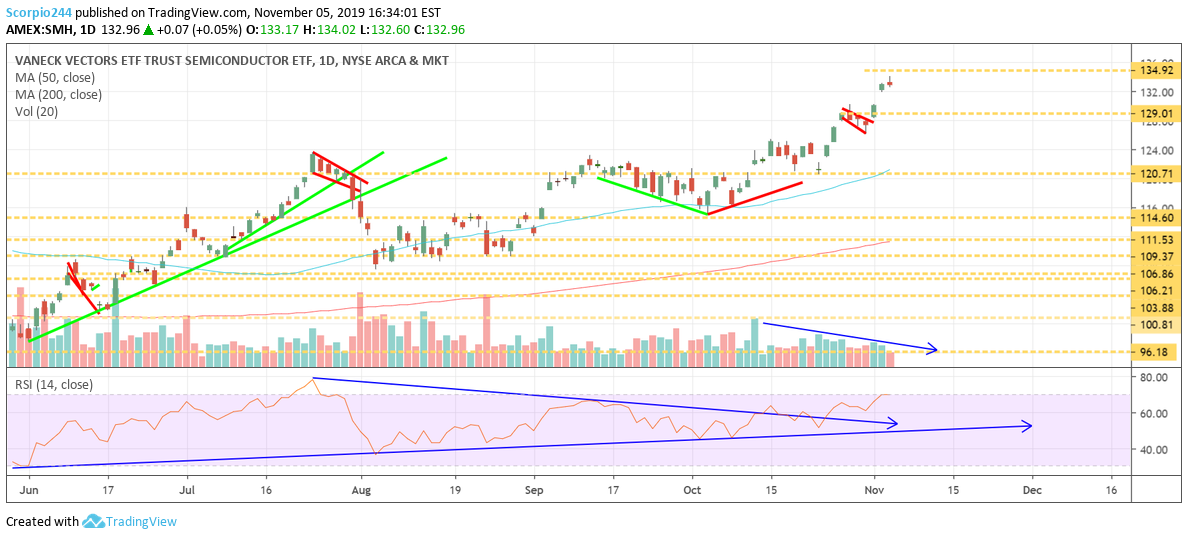
Gilead (GILD)
Gilead Sciences (NASDAQ:GILD) continues this never-ending period of consolidation. The good news is the days are number. The triangle is converging, the downtrend and the support level will soon meet. I’m scared for $56.
