So interest rates are going up and we should sell stocks because it will cause a recession. We knew rates were going up already, right? The FOMC keeps telling us what they are going to do and then they do it when they told us they would. So why sell stocks now again? The argument 6 weeks ago to move to the sidelines came from macro investors as well suggesting a flat set of interest rates, from 3 months to 30 years, was an antecedent to a recession. This despite the broad economic situation as measured by GDP showing a 4% annual growth pace.
Needless to say there was no imminent recession and markets went higher then. Now those same macro investors are upset that the yield curve is getting steeper with long term rates rising. Isn’t this what they wanted just 6 weeks ago? This time rising rates are supposed to cool off the economy. The thing is though it is not showing up in earnings estimates. We will see if the actual earnings can live up to the estimates and what happens for estimates for the 4th quarter starting with the banks Friday.
So for argument’s sake, let me posit that the sell off in stock has nothing to do with interest rates or the yield curve. At least not directly. What if the sell off is being driven by the trust but verify crowd, that sees estimates not falling but now that the actual prints are so close is happy to sit out a couple of weeks and see if that information is true?
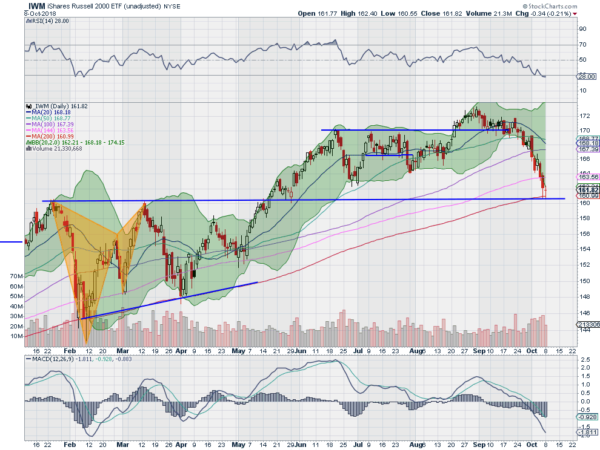
Apply that to the Russell 2000 now. It really started to pick up steam to the downside about 1 month before the earnings season started. And after Monday’s close had pulled back just shy of 8% from the top. Some profit taking at least. Certainly not a crash. But also technically showing signs of a stop to the bleeding at a very interesting place.
The Russell 2000 Index ETF, iShares Russell 2000 (NYSE:IWM), printed a doji candle today, rising after the open and then falling back only to recover and close at the opening price. This candlestick signals indecision. Buyers and sellers in equilibrium. This after nearly a month of sellers being in control. A change of character should it hold up and not be a one day event.
This also is happening at a key price level. The price is retesting the break out from May, that happened after nearly 4 months of consolidation. Often a break out is retested with a pullback before a stronger move then continues higher. This happens to be at the 200 day SMA. Yes, it has not crossed below its 200 day SMA. The last time it was here was in that consolidation this spring.
Momentum indicators are also at interesting levels. The RSI is now oversold on the daily chart with a move under 30. The last time it was under 30 marked the end of the February pullback. The MACD is also at levels not seen since the February pullback. There is no certainty that the sell off in stocks is over. But Monday’s price action gives signals that a change of character may be afoot in the Russell 2000, the Index that has been leading to the downside.
The information in this blog post represents my own opinions and does not contain a recommendation for any particular security or investment. I or my affiliates may hold positions or other interests in securities mentioned in the Blog, please see my Disclaimer page for my full disclaimer.

