Global macro picture remains very mixed, with many winners and losers in various asset classes. Correlations have died down and the market is not in a simple "risk on / risk off" condition, like it was during the early parts of the recovery.
Chart 1: Australian stocks are up 12 out of the last 13 weeks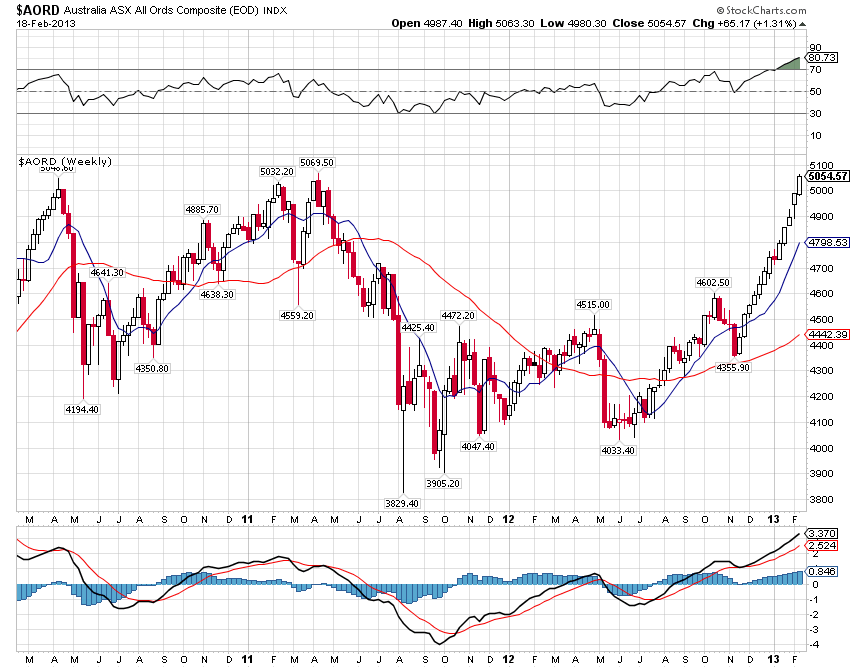
When we look at the equity markets around the world, we can notice that some indices have already started a correction. European Euro 50, Indian Bombay 30, Russian TSI, Brazilian Bovespa, Mexican Bolsa and Turkey's Istanbul 100 are all down in price for the last three weeks or more. On the other hand, S&P 500, Japanese Nikkei 225 and the Australian ASX 200 remain on a weekly winning streak for now. In particular, Aussie stocks are now extremely overbought from the technical and statistical perspective, being up 12 out of the last 13 weeks.
Chart 2: Sentiment on the US stock market remains frothy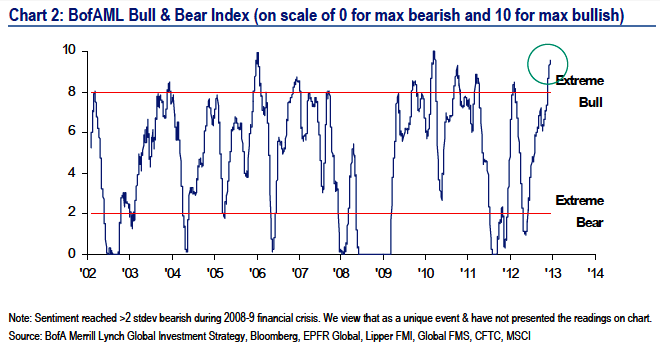
Regardless of what indicator we look at - from sentiment surveys to fund inflows and from option positioning to breadth readings - the stock market remains extremely overbought. The great financial service providers over at Bespoke recently reported that the volatility in Dow Jones is at one of the lowest readings in almost three decades. This is a signal that a major moving is coming in either direction.
Chart 3: Overall market volatility is back to pre-crisis levels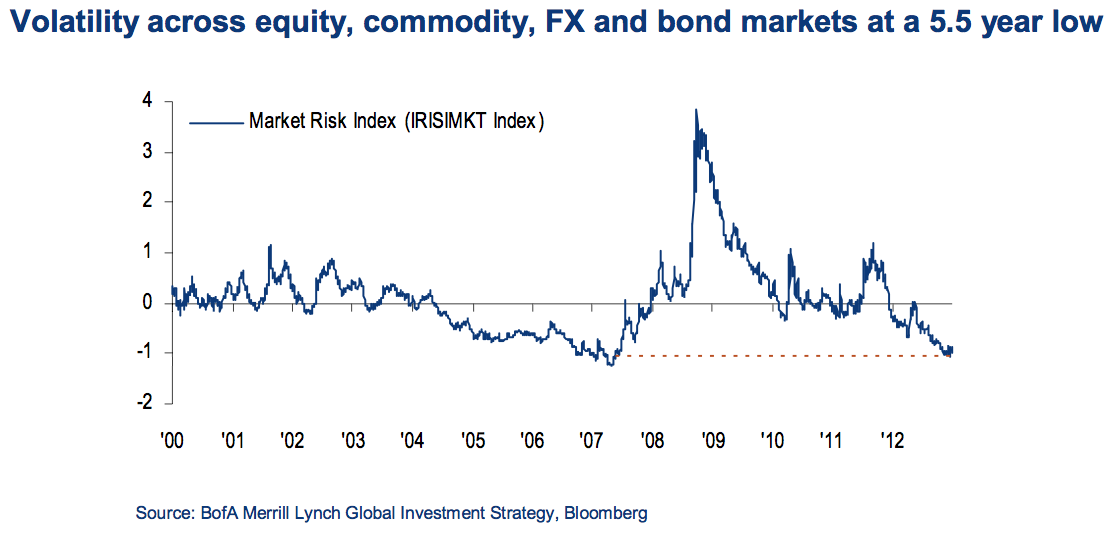
While I have expected a bear market to already start late last year, we are just not there yet. Regardless, S&P 500 has only made a marginal gain of 3% relative to its previous peak in September 2012 at 1474. I believe that we are still going through a topping process and there is definitely a lot of complacency around. Volatility for all asset classes including global equities, commodities, currencies and bonds is now at a 5 and half year low. While volatility can remain low for a prolonged period of time, it usually does so during sound economic backdrops, like we saw during 2004 to 2007.
You have to ask yourself if today's economic fundamentals are sound?
I know some will disagree (especially the internal bulls) but in my opinion, the current rally is artificial at best and is built almost single handedly on the fact that global central banks are devaluing their own currencies. This is forcing investors into elevated risk taking behaviour. Looking at Chart 3, the time to be a buyer and a bull was during the period between late 2008 and early 2009. We have had a tremendous rally in equities (especially in the US) over the last few years and in today's economic environment, I still continue to urge conservative investors to take money off the table, while aggressive ones should consider short selling the market.
It has also come to my attention that foreign buyers are once again piling into US stocks. Now, it is worth saying that these guys have one of the worst timing records out of all market participants. Consider the fact that foreign buying in US stocks was on average reaching 20 billion dollars per month in only a handful years over the last decade. These were: the whole of 2000 prior to a Tech crash, early 2006 prior to an intermediate top, middle of 2007 prior to a Credit crisis, early 2010 prior to Flash crash and Greek crisis, early 2011 prior to a major market top and Spain / Italy in crisis mode, and finally... in the last few months. Not a good sign, if you ask me.
Chart 4: Commodities are out of favour relative to stocks 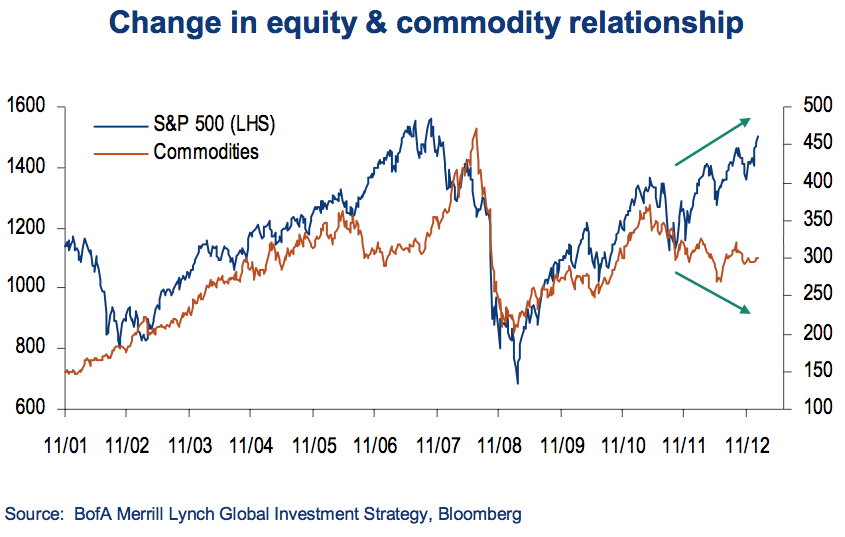
On the other hand, commodity investors have not benefited like their equity counterparts. During the "risk on" rally of 2009 and 2010, commodities correlated quite closely to equities. In May 2011, both S&P 500 and the CRB Index peaked and went through a correction, but interestingly what followed was a recovery in equity prices without the rise of commodities.
Right now, commodities are down about 20% from their peak in May 2011 and little less than 10% down from their recent intermediate peak in September 2012. Furthermore, it is worth stating that not all commodities perform equally and the fortunes within the sector space has been rather mixed. Agriculture has been hit hard since the September peak, with the price of Wheat, Corn, Soybeans, Coffee, Sugar and Cocoa all in a multi month downtrend. Softs, in particular, remain one of the worst performing sub-sectors over the last couple of years, with sentiment is once again hitting "despair" in Sugar and Coffee.
Chart 5: Hedge funds hold a record net long position in Energy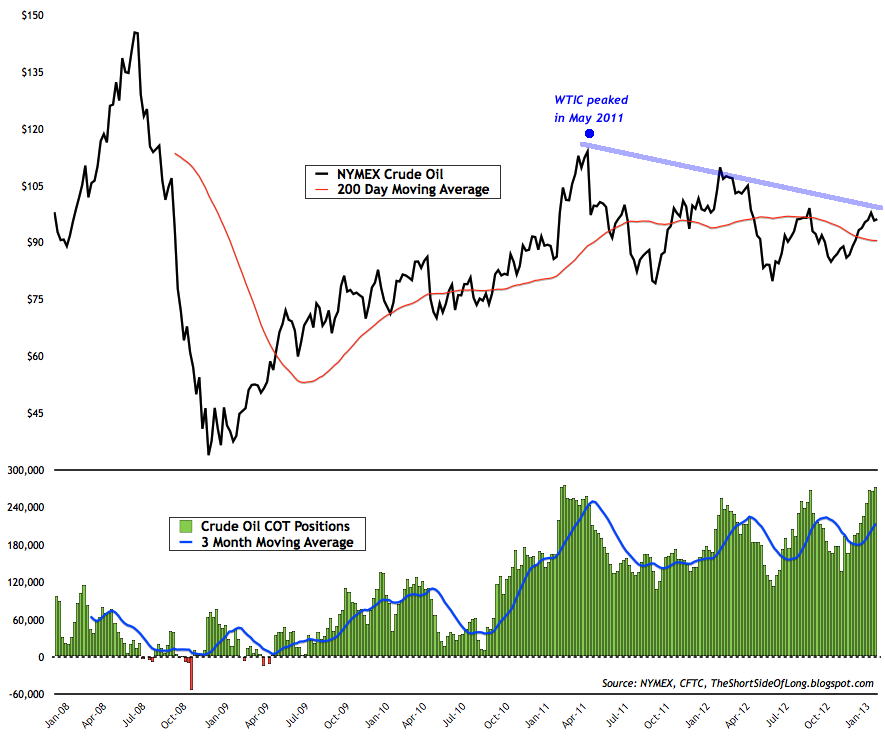
Apart from Agriculture, which accounts for over 40% of the CRB, energy is the second largest sector within the commodity space. Therefore, the recent outperformance has definitely grabbed the attention of speculators and trend followers alike. According to the recent CFTC Commitment of Traders report, positioning in futures contracts for Crude Oil, Heating Oil and Unleaded Gasoline has now reached an all time record high.
My personal opinion here is rather mixed. On one hand, we have extreme net long positioning in the energy sector, which tends to confirm the euphoric risk taking within the equity space. These two asset classes tend to correlate rather closely majority of the time, so this is very troubling. I warned about this last time positioning built up to extremes and what we saw was a 15% correction in Crude prices.
On the other hand, unlike the Dow Jones and S&P 500, energy prices have been out of favour since May 2011. The price of WTI Crude, Brent Crude, Gasoline and Heating Oil have been consolidating for a long time now. We can see in the chart above that WTI Crude Oil has remained in a cyclical bear market for almost two years. While this might not be the best to to purchase energy, long term fundamentals remain in favour of higher prices as the commodity bull market continues.
Chart 6: Gold sentiment has now reached negative levels 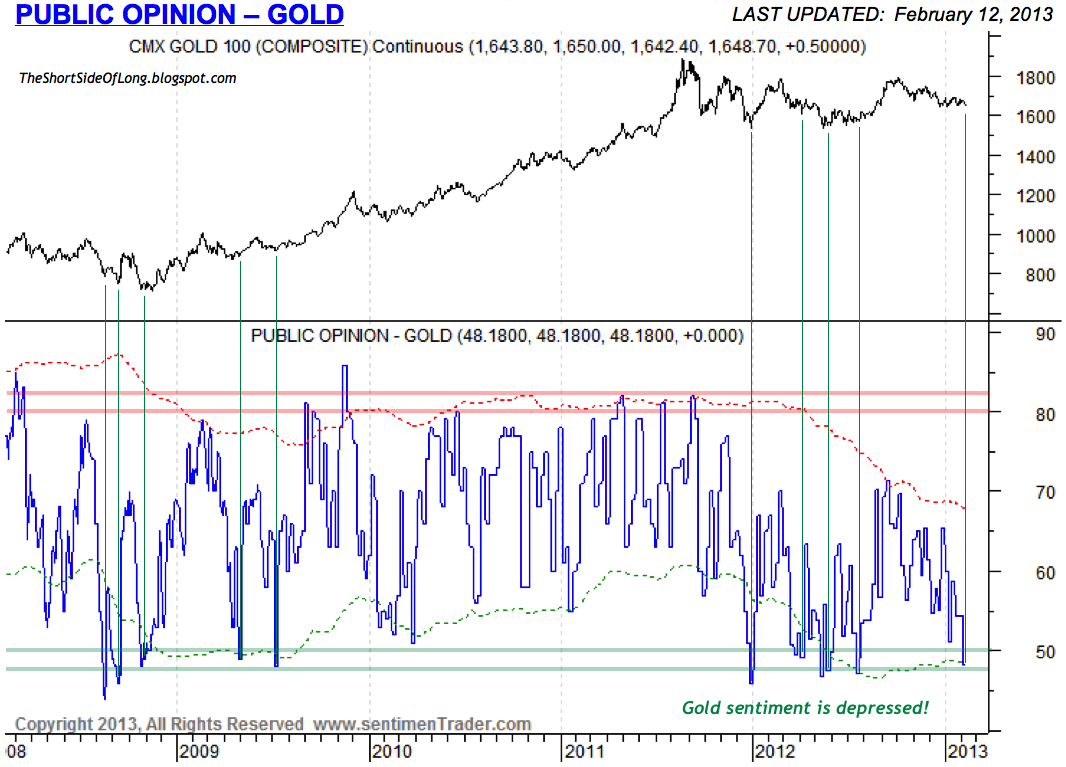
While already written about extensively, interest has been expressed towards the bullish sentiment and overbought levels in stocks relative to the bearish sentiment and oversold levels in precious metals. It seems that traders everywhere are discussing it. The chart above clearly shows that Gold is definitely out of favour with investors and with the strong sell off on Thursday and Friday, that is only set to continue.
Chart 7: Gold Dow ratio is most oversold since 1999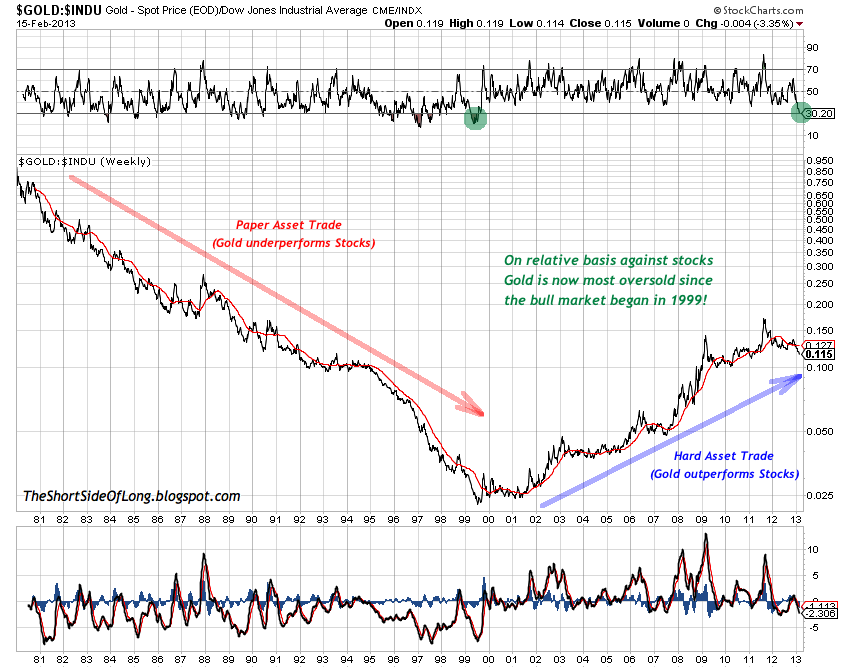
The precious metals sector has now under performed the US stock market since August 2011. You might remember that particular month specifically, as Dow Jones crashed while Gold rallied in a vertical blow off top. That was definitely an extreme, as I wrote in early August of 2011:
"The market has now crashed. The volatility will remain, which is scaring the pants out of retail investors. They pulling money out of equities at the fastest pace since October 2008...
...and putting it into Gold. This weeks SPDR ETF flows showed that Gold received a record amount of inflows, reaching a staggering 10 billion dollars. Previous strong inflows have always led to Gold corrections...
...however this time around Gold has gone vertical. Therefore the correction that is coming up could be a little more serious. Daily Sentiment Index, another measure of Golds optimism, yesterday showed 95% bulls. I still remain very very bullish on Gold from the long term perspective, however with Gold rising vertically due to the fear of the cascading stock prices, this is creating panic buying and has to be one of the worst entry points of the last 11 years!"
That call was spot on, as stocks eventually bottomed while Gold and the rest of the precious metals sector endured a very significant correction in both price and time. This correction is still on going and the question is are we reaching the opposite extreme yet?
As we look at the Chart 7 above, one could argue that we are slowly approaching the opposite side of that extreme. Technically speaking, for the first time since 1999, Gold is now oversold against the Dow Jones Industrial on a relative basis. Furthermore, Gold has not outperformed the Dow Jones since at least early parts of 2009, as the overall ratio has mainly moved in a sideways manner despite occasional spikes. If one is a believer in a Hard Asset Trade, where commodities and commodity producers continue to outperform generic blue chip stocks for awhile longer, then the current condition is definitely one approaching a buying opportunity.
Chart 8: Gold Miners are extremely oversold once again 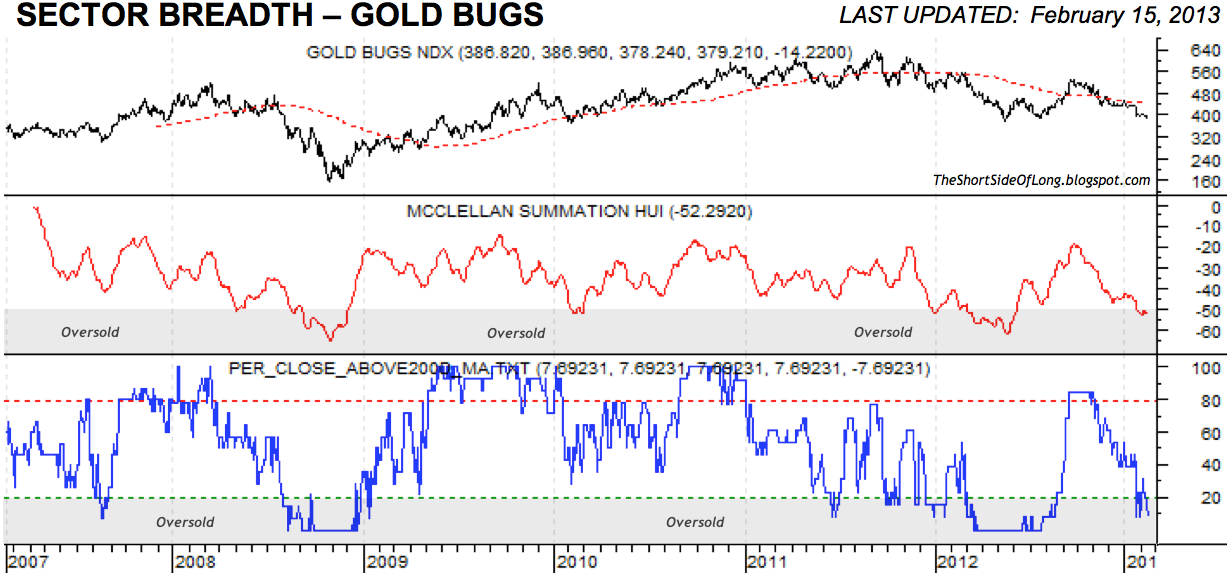
And speaking of commodity producers, many have voiced opinions towards relative under-performance of Gold Miners. The ratio between the miners and Gold itself has now risen to 2008 crash levels in favour of Gold, but has become overbought once again. This could be a clue that Gold Miners are overstretched to the downside and should soon start to outperform again. Obviously , patience is required.
Furthermore, looking at breadth readings of the sector in Chart 8, we can see a definite oversold reading. While these can persist and get more oversold, the point is that we are much closer to a low today, than in September and October 2012 as various "gurus" were trying to convince us that the Miners will be reaching for the sky. Looking back on it now... boy were they wrong!
The Bottom Line
It seems that the global equity market correction has already started, but not all markets are affected yet. In particular, the US stocks stand out as the most overvalued with sentiment remaining euphoric for weeks on end. Conservative investors should take money off the table, while aggressive investors should consider short selling the market.
On the other hand, commodities have not performed as well as equities in recent years. Majority of investors have essentially given up on this asset class, with constant talk of "secular bull market being finished". It is also worth noting that performance within the CRB Index remains a mixed bag. While energy is showing heavy speculation, Agriculture and in particular Softs like Coffee and Sugar remain out of favour. Finally, precious metals sector is reaching oversold levels and contrarians should stay alert for an eventual buying opportunity.
What I Am Watching
- English (UK)
- English (India)
- English (Canada)
- English (Australia)
- English (South Africa)
- English (Philippines)
- English (Nigeria)
- Deutsch
- Español (España)
- Español (México)
- Français
- Italiano
- Nederlands
- Português (Portugal)
- Polski
- Português (Brasil)
- Русский
- Türkçe
- العربية
- Ελληνικά
- Svenska
- Suomi
- עברית
- 日本語
- 한국어
- 简体中文
- 繁體中文
- Bahasa Indonesia
- Bahasa Melayu
- ไทย
- Tiếng Việt
- हिंदी
Stocks And Commodities: Mixed Global Macro Picture
Published 02/19/2013, 06:40 AM
Updated 07/09/2023, 06:31 AM
Stocks And Commodities: Mixed Global Macro Picture
Latest comments
Loading next article…
Install Our App
Risk Disclosure: Trading in financial instruments and/or cryptocurrencies involves high risks including the risk of losing some, or all, of your investment amount, and may not be suitable for all investors. Prices of cryptocurrencies are extremely volatile and may be affected by external factors such as financial, regulatory or political events. Trading on margin increases the financial risks.
Before deciding to trade in financial instrument or cryptocurrencies you should be fully informed of the risks and costs associated with trading the financial markets, carefully consider your investment objectives, level of experience, and risk appetite, and seek professional advice where needed.
Fusion Media would like to remind you that the data contained in this website is not necessarily real-time nor accurate. The data and prices on the website are not necessarily provided by any market or exchange, but may be provided by market makers, and so prices may not be accurate and may differ from the actual price at any given market, meaning prices are indicative and not appropriate for trading purposes. Fusion Media and any provider of the data contained in this website will not accept liability for any loss or damage as a result of your trading, or your reliance on the information contained within this website.
It is prohibited to use, store, reproduce, display, modify, transmit or distribute the data contained in this website without the explicit prior written permission of Fusion Media and/or the data provider. All intellectual property rights are reserved by the providers and/or the exchange providing the data contained in this website.
Fusion Media may be compensated by the advertisers that appear on the website, based on your interaction with the advertisements or advertisers.
© 2007-2025 - Fusion Media Limited. All Rights Reserved.
