We stress often the need for proper context when performing market analysis. It is constructive to revisit the big picture frequently, especially during periods of elevated short-term volatility when it is all too easy to fall under the influence of the bipolar emotional swings that accompany the daily index movements.
Short-term price behavior only has meaning when analyzed in the proper context afforded by the long-term view, so all investing and long-term trading strategies should begin with a thorough understanding of the current secular environment. There have been five secular trends in the stock market since the crash in 1929, three downtrends and two uptrends.
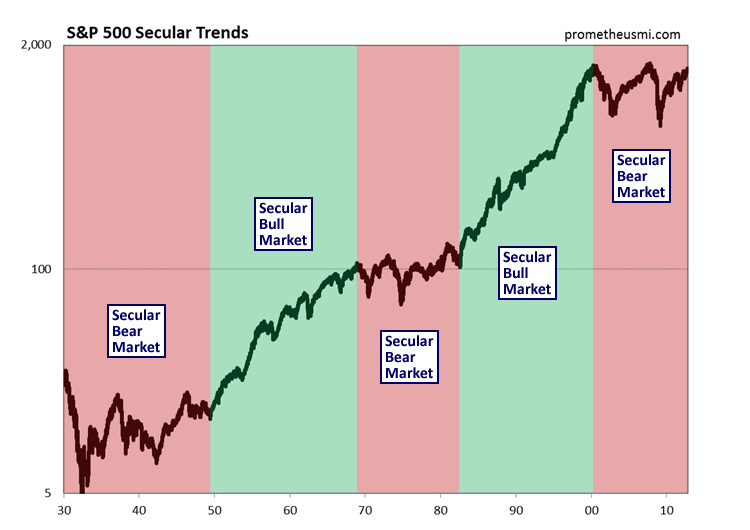
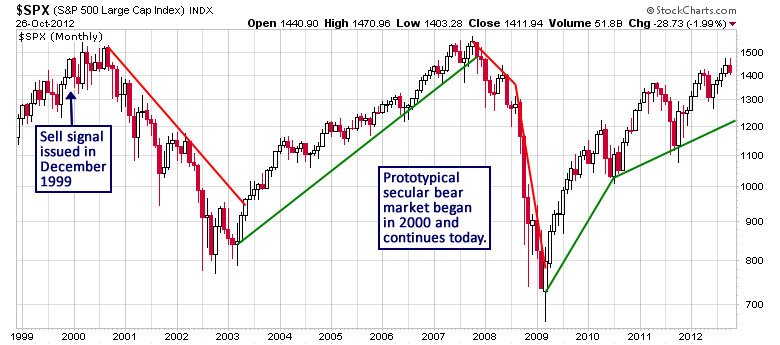
The current secular bear market began in 2000 following a speculative run-up during the second half of the 1990s. As usual, market behavior clearly signaled that a secular inflection point was approaching and our Secular Trend Score (STS), which analyzes a large basket of fundamental, internal, technical and sentiment data, issued a long-term sell signal in December 1999. At the time, our computer models predicted that stocks would enter a secular bear market that would last from 10 to 20 years. Following the topping process in 2000, a prototypical secular downtrend began and continues today.
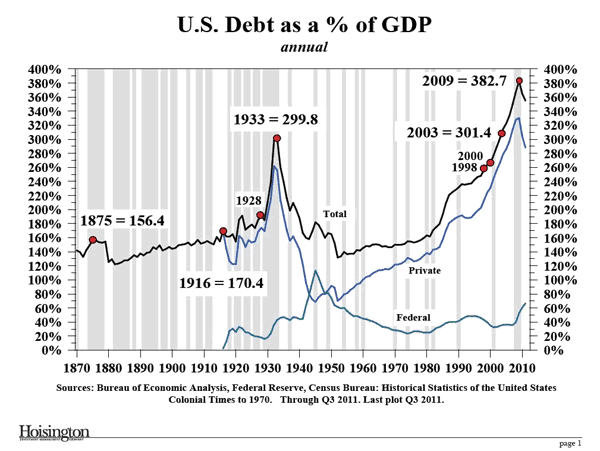
Stock market secular trends typically last from 10 to 20 years, depending upon the nature of underlying structural economic trends. Since we are currently in the final stage of a debt expansion cycle that began 60 years ago, it is highly likely that the current secular bear market is still several years away from its terminal phase.
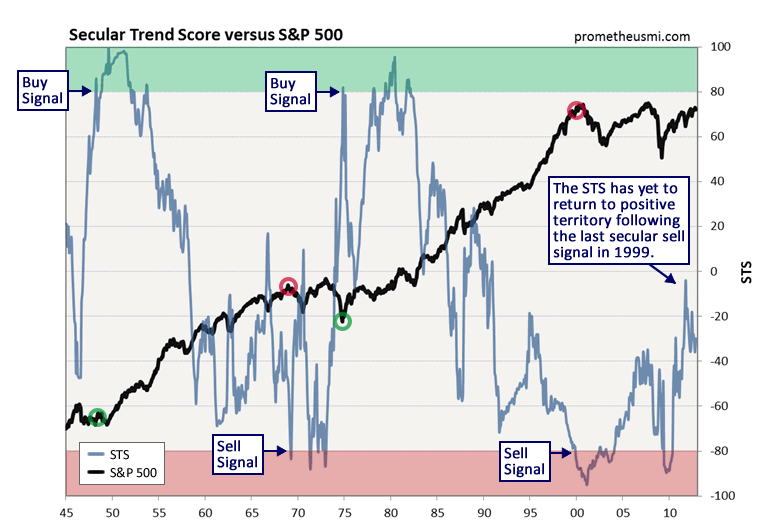
The STS supports the hypothesis that this secular downtrend is far from over as the score has yet to return to positive territory following the sell signal in 1999. Secular inflection points develop slowly, usually over the course of 6 to 12 months, so the STS will provide plenty of advance warning when the next true investment opportunity develops in the stock market.
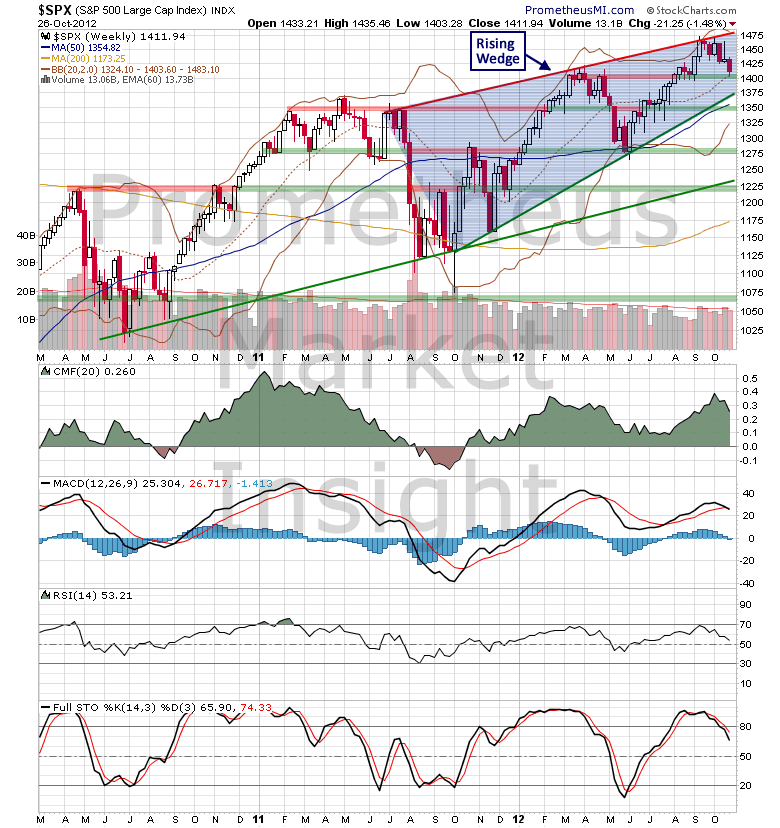
Secular trends are themselves composed of cyclical subcomponents, and the current cyclical uptrend began in March 2009. When they occur during secular bear markets, cyclical rallies have an average duration of 33 months. Therefore, at a current duration of 43 months, the bull market from 2009 is almost certainly in the final stage of its development. Following the market crash in 2008, the latest cyclical rally has been characterized by violent moves higher and lower. As expected in March, the last stimuli-fueled rally from October 2011 was followed by yet another violent retracement. The uptrend from 2011 has taken the form of a rising wedge, which is a technical formation that is usually followed by a severe decline, so it will be important to monitor market behavior closely during the next several weeks.
Additionally, it is important to remember that the risk/reward ratio of the stock market continues to hold near the highest level ever recorded. Anything can happen over short-term time periods, but the key to having consistent success over the long run as an investor and a trader is to stay aligned with the most likely scenarios and protect yourself from the unlikely ones. There will come a time when the risk/reward profile of stocks is once again favorable and the judicious study of market data will signal when that next long opportunity develops, just as it did in March 2009. However, now is a time for extreme caution and we remain fully defensive.
Short-term price behavior only has meaning when analyzed in the proper context afforded by the long-term view, so all investing and long-term trading strategies should begin with a thorough understanding of the current secular environment. There have been five secular trends in the stock market since the crash in 1929, three downtrends and two uptrends.

The current secular bear market began in 2000 following a speculative run-up during the second half of the 1990s. As usual, market behavior clearly signaled that a secular inflection point was approaching and our Secular Trend Score (STS), which analyzes a large basket of fundamental, internal, technical and sentiment data, issued a long-term sell signal in December 1999. At the time, our computer models predicted that stocks would enter a secular bear market that would last from 10 to 20 years. Following the topping process in 2000, a prototypical secular downtrend began and continues today.

Stock market secular trends typically last from 10 to 20 years, depending upon the nature of underlying structural economic trends. Since we are currently in the final stage of a debt expansion cycle that began 60 years ago, it is highly likely that the current secular bear market is still several years away from its terminal phase.

The STS supports the hypothesis that this secular downtrend is far from over as the score has yet to return to positive territory following the sell signal in 1999. Secular inflection points develop slowly, usually over the course of 6 to 12 months, so the STS will provide plenty of advance warning when the next true investment opportunity develops in the stock market.

Secular trends are themselves composed of cyclical subcomponents, and the current cyclical uptrend began in March 2009. When they occur during secular bear markets, cyclical rallies have an average duration of 33 months. Therefore, at a current duration of 43 months, the bull market from 2009 is almost certainly in the final stage of its development. Following the market crash in 2008, the latest cyclical rally has been characterized by violent moves higher and lower. As expected in March, the last stimuli-fueled rally from October 2011 was followed by yet another violent retracement. The uptrend from 2011 has taken the form of a rising wedge, which is a technical formation that is usually followed by a severe decline, so it will be important to monitor market behavior closely during the next several weeks.

Additionally, it is important to remember that the risk/reward ratio of the stock market continues to hold near the highest level ever recorded. Anything can happen over short-term time periods, but the key to having consistent success over the long run as an investor and a trader is to stay aligned with the most likely scenarios and protect yourself from the unlikely ones. There will come a time when the risk/reward profile of stocks is once again favorable and the judicious study of market data will signal when that next long opportunity develops, just as it did in March 2009. However, now is a time for extreme caution and we remain fully defensive.
