During periods of great market turmoil, it is useful to revisit the big picture often. Short-term price behavior only has meaning when analyzed in the proper context afforded by the long-term view, so all investing and long-term trading strategies should begin with a thorough understanding of the current secular environment. There have been five secular trends in the stock market since the crash in 1929, three downtrends and two uptrends.
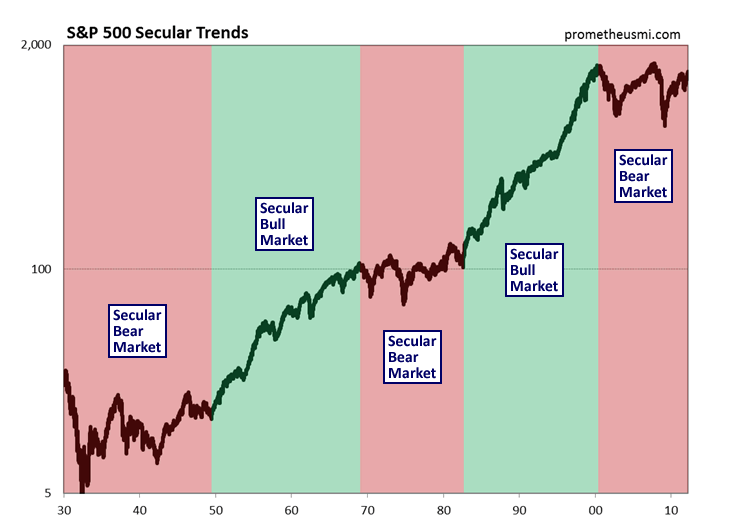
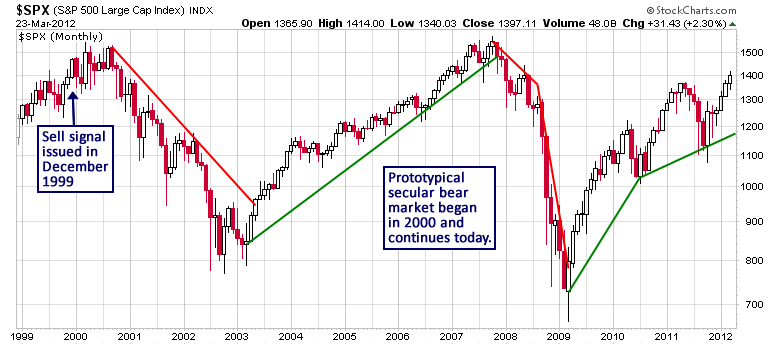
The current secular bear market began in 2000 following a speculative run-up during the second half of the 1990s. As usual, market behavior clearly signaled that a secular inflection point was approaching and our Secular Trend Score (STS), which analyzes a large basket of fundamental, internal, technical and sentiment data, issued a long-term sell signal in December 1999. Following the topping process in 2000, a prototypical secular bear market began and continues today.
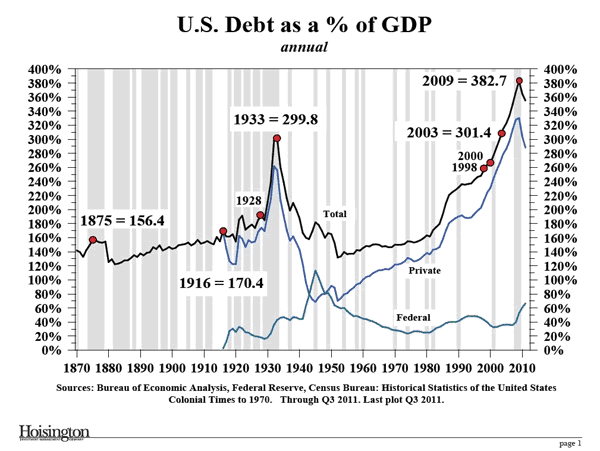
Stock market secular trends typically last from 10 to 20 years, depending upon the nature of underlying structural economic trends. Since we are currently in the final stage of a debt expansion cycle that began 60 years ago, it is highly likely that the secular bear market from 2000 is still several years away from its terminal phase.
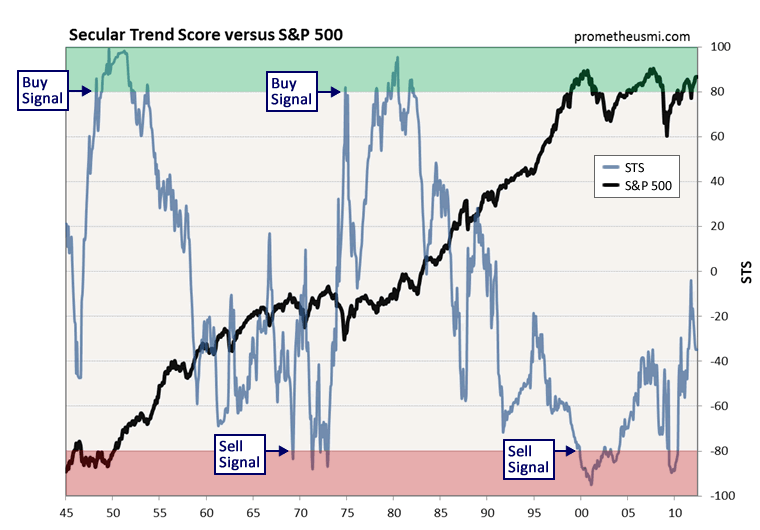
The STS supports the hypothesis that this secular downtrend is far from over as the score has yet to return to positive territory following the sell signal in 1999. Secular inflection points develop slowly, usually over the course of 6 to 12 months, so the STS will provide plenty of advance warning when the next true investment opportunity develops in the stock market.
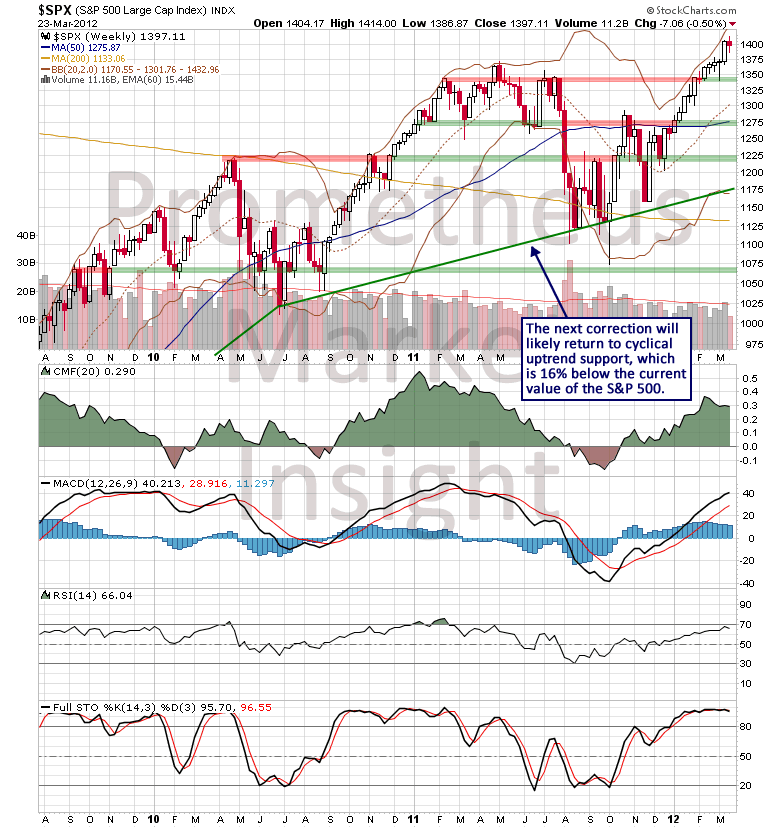
Secular trends are themselves composed of cyclical subcomponents, and the current cyclical uptrend began in March 2009. When they occur during secular bear markets, cyclical rallies have an average duration of 33 months. Therefore, at a current duration of 36 months, the bull market from 2009 is likely in the final stage of its development. Following the market crash in 2008, the latest cyclical rally has been characterized by violent moves higher and lower. The last extreme advance from October 2011 has produced a gain of 30 percent during the course of six months and it is highly likely that the next downtrend will be equally violent. Cyclical uptrend support is near 1,175 on the S&P 500 index and the forthcoming overbought retracement will likely return to that area, which is 16 percent below current levels.
With respect to cycle analysis, the rally phase of the intermediate-term cycle from November is now 17 weeks old and it has become extremely overextended, so the next Intermediate-Term Cycle High (ITCH) could develop at any time. Of course, an overextended rally of this nature has a tendency to keep moving higher under the power of its speculative momentum, but when it finally breaks down, the correction will likely develop very quickly and retrace several weeks of gains in a matter of sessions.
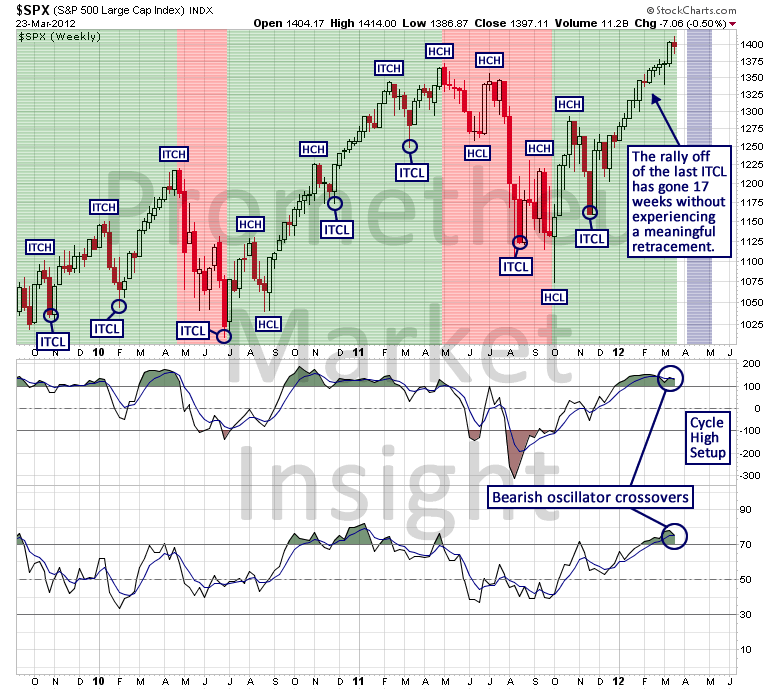
Another violent retracement similar in character to the 2010 and 2011 declines is coming; it is simply a question of when. The bigger question is whether the forthcoming high will mark the end of the cyclical bull market from 2009. As always, market behavior, along with diligently applied chart analysis, will provide the answer.

The current secular bear market began in 2000 following a speculative run-up during the second half of the 1990s. As usual, market behavior clearly signaled that a secular inflection point was approaching and our Secular Trend Score (STS), which analyzes a large basket of fundamental, internal, technical and sentiment data, issued a long-term sell signal in December 1999. Following the topping process in 2000, a prototypical secular bear market began and continues today.

Stock market secular trends typically last from 10 to 20 years, depending upon the nature of underlying structural economic trends. Since we are currently in the final stage of a debt expansion cycle that began 60 years ago, it is highly likely that the secular bear market from 2000 is still several years away from its terminal phase.

The STS supports the hypothesis that this secular downtrend is far from over as the score has yet to return to positive territory following the sell signal in 1999. Secular inflection points develop slowly, usually over the course of 6 to 12 months, so the STS will provide plenty of advance warning when the next true investment opportunity develops in the stock market.

Secular trends are themselves composed of cyclical subcomponents, and the current cyclical uptrend began in March 2009. When they occur during secular bear markets, cyclical rallies have an average duration of 33 months. Therefore, at a current duration of 36 months, the bull market from 2009 is likely in the final stage of its development. Following the market crash in 2008, the latest cyclical rally has been characterized by violent moves higher and lower. The last extreme advance from October 2011 has produced a gain of 30 percent during the course of six months and it is highly likely that the next downtrend will be equally violent. Cyclical uptrend support is near 1,175 on the S&P 500 index and the forthcoming overbought retracement will likely return to that area, which is 16 percent below current levels.

With respect to cycle analysis, the rally phase of the intermediate-term cycle from November is now 17 weeks old and it has become extremely overextended, so the next Intermediate-Term Cycle High (ITCH) could develop at any time. Of course, an overextended rally of this nature has a tendency to keep moving higher under the power of its speculative momentum, but when it finally breaks down, the correction will likely develop very quickly and retrace several weeks of gains in a matter of sessions.

Another violent retracement similar in character to the 2010 and 2011 declines is coming; it is simply a question of when. The bigger question is whether the forthcoming high will mark the end of the cyclical bull market from 2009. As always, market behavior, along with diligently applied chart analysis, will provide the answer.
