While the Stock Market Makes New Highs, Most Commodity Prices Tumble. What's Ahead of Commodities.
By Jim Roemer
While the stock market has been on a tear the last number of months on a rebound in the U.S. economy, stronger corporate earnings and too many people on the sidelines over the last few years, commodity prices have had more or less an inverse relationship. However, this is not always the case. It is risky to infer any sort of long term trend in commodity prices, just based on the whims of the stock market, or visa versa. Nevertheless, there are some industries (energy, grains, etc.) where rising or falling commodity prices, definitely can influence company earnings and affect the underlying stock price of a particular equity.
Take for example natural gas. This market was in a 6 year bear market, depressed by the advent of domestic shale production and up until recently, no persistent bullish weather extremes in key natural gas producing and consuming regions. The recent record cold March and early April weather in the United States has resulted in a 30% gain in natural gas prices. The ETF (UNG) had been on a tear, and many natural gas storage and transmission companies are finally seeing higher profits and stronger share prices. However, as we get into the weaker demand season for electricity and based on my forecast for a potential cool summer, we have seen natural gas prices give up about 10% of their recent gains. This trend may continue for most of the summer, unless we witness another hot June-August period, drought and many hurricanes in the Gulf.
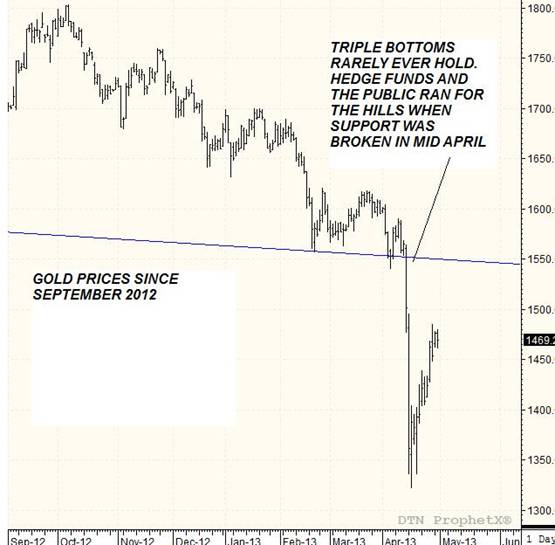
While natural gas prices have been one of the strongest commodities in the CRB Index over the last few months, gold prices have rallied back some 10% off of their panic sell off lows, of two weeks ago. Over the past 5 years or so, two of the most profitable commodity plays were being long gold in response to the debasing actions of central banks around the world and short natural gas due to the shale revolution. Metal prices such as silver, copper and others have fallen to the point their price declines might begin generating important micro adjustments to support higher prices. However, the stronger U.S. dollar, stronger stock market and less need by the general public to seek the secure haven that gold once offered, will likely keep gold prices from rallying very far in my opinion.
The key point to this article below, is that any major bull move over the next few months in natural gas, gold and grains is unlikely, while for the soft commodity market there are a few bullish potential factors. However, any precipitous surge in the CRB Index is probably not in the cards.
Chart Above---The price of gold broke key support a couple weeks ago, but cash market oversea demand by jewelers and other end users have boosted gold prices back about 10% of their lows. I would look to recommend putting on a "short" longer term gold option spread, as I think prices back above $1600 an ounce any time soon, is unlikely. A trader might look to sell the January 2014 ETF GLD $150 call option and for protection, buy the January 2014 ETF GLD $170 call.
Global Climate has had a huge Impact on Commodity Prices.
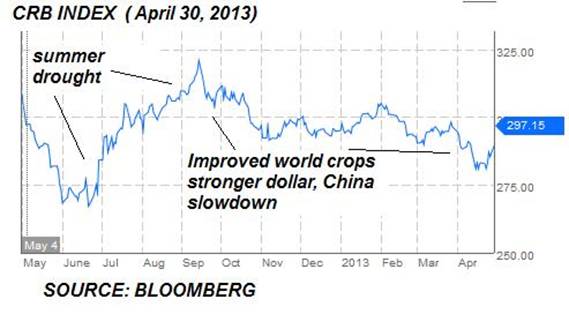
Weather has also been a huge player in many commodities and was significantly responsible for the CRB's 18% rise last summer, and most recently, the 12% break. Much of this rise and fall was directly related to last summer's U.S. drought, in which grain prices rocketed 30%. We began advertising to clients last fall, that the so-called fear of yet another global grain related Arab Spring, might be all hype and that world grain supplies would be on the rebound. I made this prognostication based on my feeling of a huge South American crop this past winter, the U.S. drought easing (which it has, for now in many areas), and the fact the general public was too heavily long the market.
As the CRB index graph shows below, commodity prices have been on a general trend down, since last summer, due to improving world weather, but also because the U.S. now has seen domestic oil production exceed imports to the highest level since 1995.. Hedge funds were artificially keeping the price of crude oil too high over the last year or two. As the U.S. becomes less dependent on foreign oil, this may give an added to the U.S. economy, but it also will heighten the need for greater U.S. security. Lower world oil prices, sparked not by OPEC policy making, but by the U.S. producing more, could weaken the Russian economy and also produce more animosity from countries such as Saudi Arabia and other Arab nations. 
While Weather is such a huge player in commodity prices, as everything from grains to sugar, coffee, natural gas cotton are affected by global climate, what does our crystal ball suggest for the next few months?
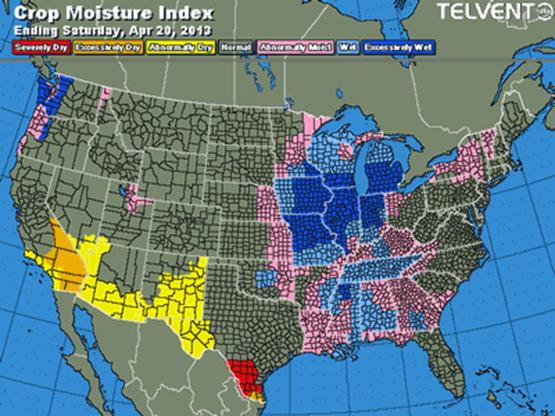
In the world of weather, things can change very quickly. One of the most dramatic weather shifts that has also altered grain market psychology and perception is that the Midwest went from drought to floods in a blink of the eye. We have seen the previously drought ridden Mississippi, Missouri and Red River Valley Rivers, go from famine to feast. These areas are now suffering from too much rain. The unparalleled cold late winter and early spring, which anointed the natural gas markets as one of the stellar commodity plays of the last 2 months, is also one that is resulting in the slowest corn planting pace for corn and spring wheat on record.
Duluth, Minnesota had record April snowfall and Peoria, Illinois (just one in many cities in the Midwest) has breached the latest spring date for not yet reaching 70 degrees. This is all garnering new concern in the grain market. However, advances in technology give Midwest farmers ample artillery to ward off most planting delays issues. If the Midwest summer is cool with ample rainfall (something I have been calling for, for months), corn and soybean prices could fall another 10-15% by July or August. 
What was a severe drought has now switched to too much moisture (blue) from the Red River Valley to the central corn belt, where some flood issues are becoming an issue. But longer term, these rains have eased the U.S. drought and may pressure grain prices further.(Roemer)
Source of Map---DTN-TELVENT
Grains
After our previously bearish attitude in corn and soybeans, which really began last fall due to our prognostications of lower world demand, big crops coming out of South America and the possibility of the U.S. drought easing (which it has except for the southern Plains wheat belt), grain market focus these next few weeks will be on planting issues. For wheat, the Kansas wheat tour begins this week and I continue to feel that 4 freezes will chop off some 100 million bushels in the Plains wheat crop estimate. Wheat prices and the ETF (WHEA) would be on much more of a longer term tear to higher prices, if the global stocks situation was tighter and if we had steeper weather issues in Ukraine, Europe or China. The wheat crop in Kansas, Oklahoma and Nebraska could still benefit from late spring wheat, due to the slow maturity of the crop, but the short term higher corn prices and slow planting pace of spring wheat in the Dakotas and Minnesota, will keep this market from falling very far right now.
The corn market and ETF (CORN) is on an immediate 'planting delay' ridden panic, rallying some 3% . This is still down some 20% from last summer's drought ridden highs. A return of warmer weather for plantings is likely throughout the rest of May, so any major bull market in corn is probably unlikely. Longer term, my forecast for good summer crops should eventually pressure both corn and the ETF (SOYB), but the first line of business is getting the crops planted..
Soft Commodities
The cotton market is one that is really always at the mercy of what China does. China has begun selling again, after beefing up their reserves last winter that helped prices rally from 73 cents/lb to over 90 cents/lb last month. Nevertheless, extended planting delays in the deep south may keep this market nervous. Solid demand and a potential tightening of global supplies, will probably keep cotton prices from falling much below 80 cents/lb. However, trying to predict what world crops will do in the important countries of India, Pakistan and China is almost impossible to predict this early in the growing season. The one big weather concern for the cotton market is really the Texas drought and the likelihood of a significant abandonment of cotton acreage.
If Mother Nature breeds some summer weather issues in any of these 3 other countries, cotton prices could stay strong this summer. However, since we are in a ENSO neutral phase (neither El Nino or La Nina), any major production issue may not be in the cards. Traders will also focus their attention on the Texas drought and how much land may be abandoned in coming weeks.
Sugar prices and the ETF (CANE) have been anything but sweet. A big rebound in Brazilian sugar cane production (#1 exporter) has over shadowed production short falls in India last summer. Prices have dropped some 20% from last summer's highs. Historically, sugar prices bottom in late May or early June, so a seasonal rally is possible in the weeks ahead.
Coffee prices and the ETF (JO) continue to tread water. The huge off cycle Brazil coffee crop of potentially 50-51 million bags would be a record. This realization is a key factor (two big Brazil crops the last 2 years) and coffee futures plunging more than 50% since 2011. The disease issues in Central America is pretty much the only bullish factor in this market for now, but it will take an unusual deep summertime (Brazil winter) freeze in June or July to get this market out of the gutter. The chances of a freeze this summer is about 3 to 5 times as great as it has been in any of the last 15 years, but the market will not look at this for the present time. As a cheap shot, traders may want to buy the September $140.00 July coffee call option, just in case we see a freeze situation in a couple months. However, we should point out that Brazil's coffee zone has shifted quite a bit further north the last 15 years, making the odds of a major devastating freeze a bit less likely than it was during the 1950's to 1994.
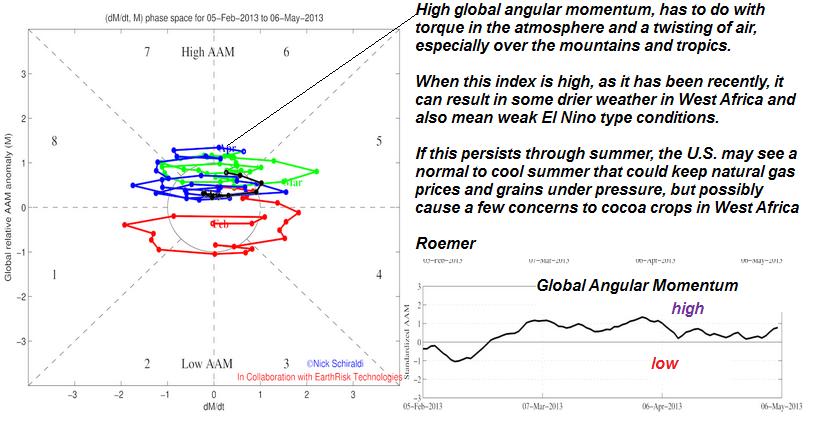
Cocoa prices and the ETF (NIB) have seen a nice 10-15% bounce in prices the last couple months. This is due to seasonal factors, stronger grind data out of Europe and the potential of a slight short fall in the mid-crop from earlier dry weather last summer. Most of that dryness was alleviated last fall and winter, however. Given what we call a relatively weak Pacific Warm Pool north of Australia, cool ocean temperatures off the coast of Peru and other criteria, the chances for any major production issue this summer for cocoa in West Africa is not high. Hence, cocoa prices may not have more than another 5%-8% more upside and could fall back later this year if production rebounds again. The one confusing climate issue, however, is the slight chance that weak El Nino conditions could form. If this happens, then the summer main cocoa crop could be compromised more than we are thinking.
While almost all climatic variables suggest few big weather related problems in West Africa this summer (60% of world's cocoa is produced), this one index, which is a measure of global angular momentum in the tropics.
Citrus greening and the Florida drought continue to keep orange juice prices strong. There are some signs that more seasonal wetter summer weather may arrive for Florida and if so, Orange prices could fall back this summer or fall. Of course, traders will also be following the hurricane season. Every time a storm brews in the Atlantic, the recollection of the infamous 2004 season, in which 4 hurricanes devastated Florida citrus groves, looms in the back of speculators' minds.
Natural Gas
Natural gas prices and the ETF (UNG) originally sold off last week on expectations that we are entering the typical 'shoulder spring months' when demand is curtailed by warmer weather. However, I continue to see the recent cold spells as a factor that has put us into a fairly modest deficit of natural gas stocks versus the 5 year average. After this week's EIA, that deficit (though not enormous) should be some 105-115 under the 5 year average. The last time this happened more than 15 months ago, natural gas prices were in the $4.30-$4.60 range. I was bullish natural gas and UNG during March and April on my original forecast for a cold late winter and spring. However, we are beginning to see some switch over to coal and we are out of the peak winter demand time of the year. Hence, the high prices in natural gas may well be in for a while.
My forecast of a potential normal to cool summer could result in a summer sell off in natural gas prices later. Articles like this may keep nervousness in this market. In the longer term picture (years out) the shale boom and need for cleaner energy will be advantageous to diversified portfolios in the natural gas storage and transmission industry. ETF's such as Fidelity Select Natural Gas (FSNGX) and many others probably have very little downside. Nevertheless, (UNG) could go back to the 18-19 area later this summer unless there are major hurricanes or hot weather.
Author's note: This piece was written on April 29, 2013
- English (UK)
- English (India)
- English (Canada)
- English (Australia)
- English (South Africa)
- English (Philippines)
- English (Nigeria)
- Deutsch
- Español (España)
- Español (México)
- Français
- Italiano
- Nederlands
- Português (Portugal)
- Polski
- Português (Brasil)
- Русский
- Türkçe
- العربية
- Ελληνικά
- Svenska
- Suomi
- עברית
- 日本語
- 한국어
- 简体中文
- 繁體中文
- Bahasa Indonesia
- Bahasa Melayu
- ไทย
- Tiếng Việt
- हिंदी
Stock Market Reaches New Highs, Most Commodity Prices Tumble
Published 05/08/2013, 03:40 AM
Updated 05/14/2017, 06:45 AM
Stock Market Reaches New Highs, Most Commodity Prices Tumble
Latest comments
Loading next article…
Install Our App
Risk Disclosure: Trading in financial instruments and/or cryptocurrencies involves high risks including the risk of losing some, or all, of your investment amount, and may not be suitable for all investors. Prices of cryptocurrencies are extremely volatile and may be affected by external factors such as financial, regulatory or political events. Trading on margin increases the financial risks.
Before deciding to trade in financial instrument or cryptocurrencies you should be fully informed of the risks and costs associated with trading the financial markets, carefully consider your investment objectives, level of experience, and risk appetite, and seek professional advice where needed.
Fusion Media would like to remind you that the data contained in this website is not necessarily real-time nor accurate. The data and prices on the website are not necessarily provided by any market or exchange, but may be provided by market makers, and so prices may not be accurate and may differ from the actual price at any given market, meaning prices are indicative and not appropriate for trading purposes. Fusion Media and any provider of the data contained in this website will not accept liability for any loss or damage as a result of your trading, or your reliance on the information contained within this website.
It is prohibited to use, store, reproduce, display, modify, transmit or distribute the data contained in this website without the explicit prior written permission of Fusion Media and/or the data provider. All intellectual property rights are reserved by the providers and/or the exchange providing the data contained in this website.
Fusion Media may be compensated by the advertisers that appear on the website, based on your interaction with the advertisements or advertisers.
© 2007-2025 - Fusion Media Limited. All Rights Reserved.
