Upcoming US Events for Today:
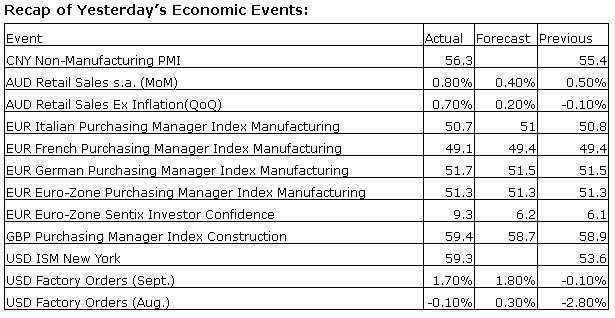
- ISM Non-Manufacturing Index for October will be released at 10:00am. The market expects 54.5 versus 54.4 previous.
Upcoming International Events for Today:
- Great Britain PMI Services for October will be released at 4:30am EST. The market expects 59.8 versus 60.3 previous.
- Euro-Zone PPI for September will be released at 5:00am EST. The market expects a year-over-year decline of 0.8%, consistent with the previous report.
- The Bank of Japan Meeting Minutes will be released at 6:50pm EST.
The Markets
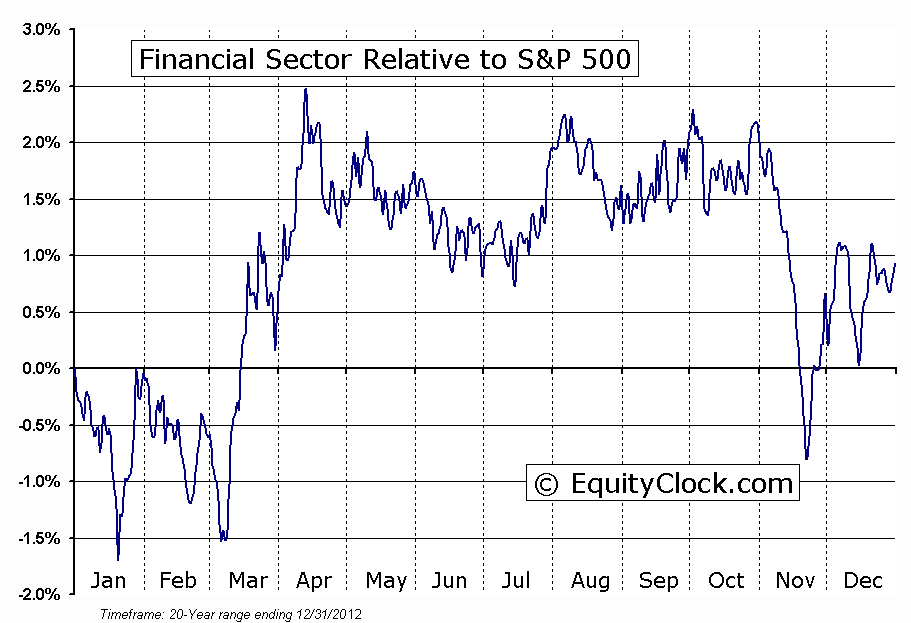
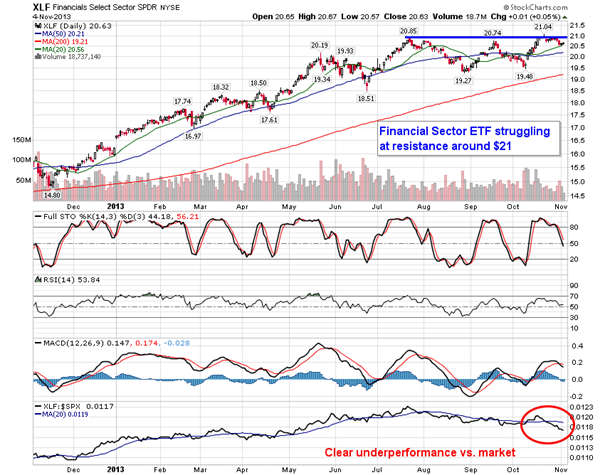
Stocks pushed higher to open the week as Energy and Material equities posted strong gains; financials continued to lag the market performance. Financials have underperformed the S&P 500 over the past couple of weeks as mortgage applications show signs of declining amidst rising rates. Weakness in the financial sector is typically a early indicator of broad financial market weakness; it can often be difficult for equity markets to remain strong without the participation of financials. Looking at the Financial Sector ETF (XLF), momentum sell signals with respect to MACD and Stochastics have recently been triggered, suggesting further downside pressures to come. Support is presently evident around the 20-day moving average, a break below which could trigger a move towards the 50-day moving average at $20.21 and then to the October lows around $19.50. November is the weakest time of the year for the financial sector, significantly underperforming the S&P 500 index by almost 3%. US Financials enter into a period of seasonal strength from January through to April.
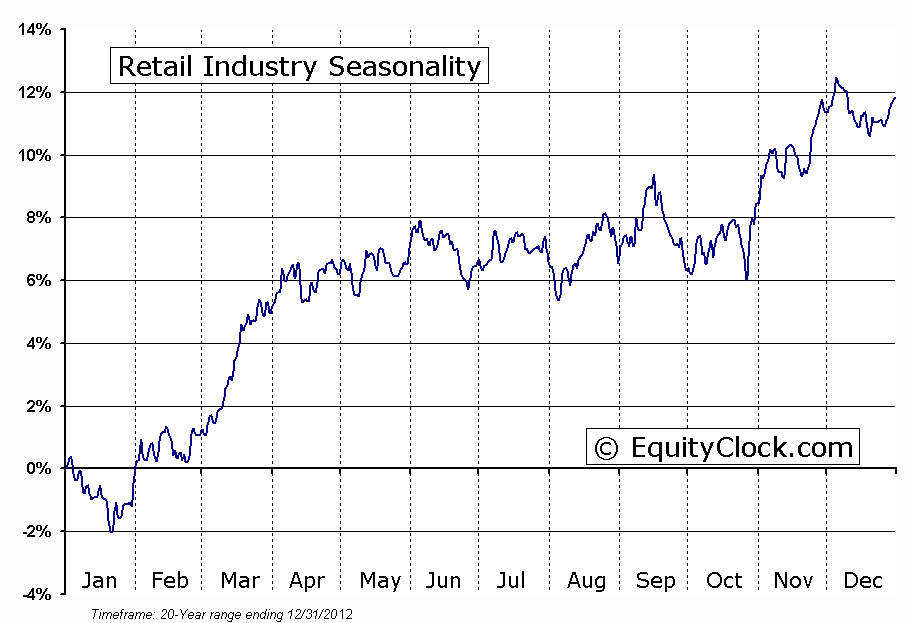
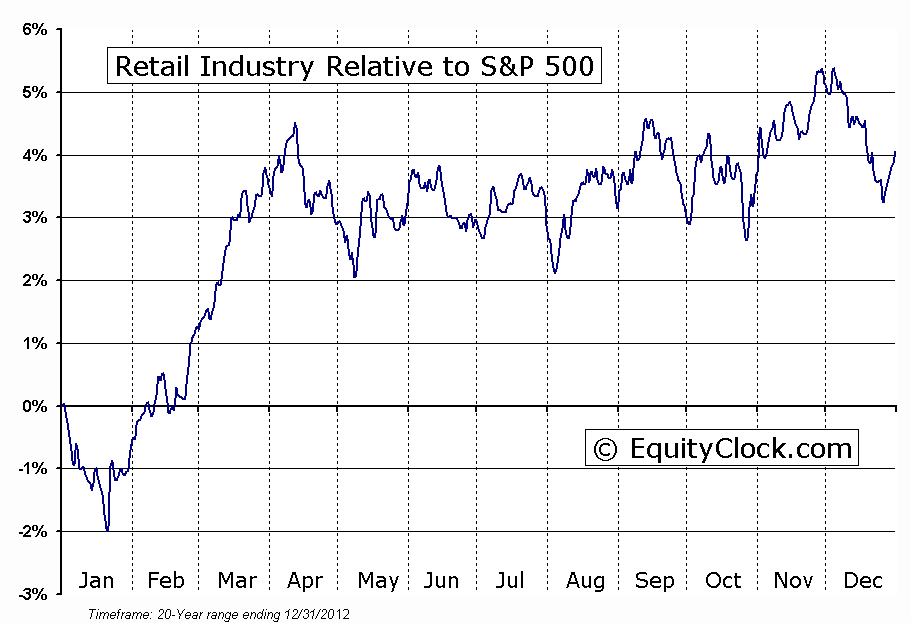
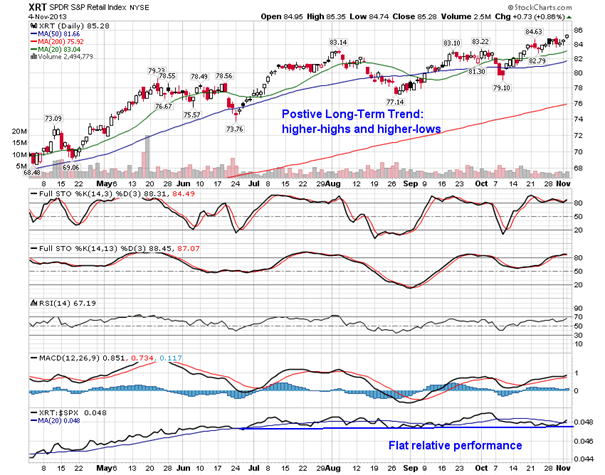
Retail stocks realized strong returns to start the week as investors await a number of data points this week pertaining the consumer, including Chain Store Sales to be released on Thursday and Personal Spending and Consumer Sentiment to be released on Friday. These reports will provide an excellent early read as to the strength of the consumer going into the always important holiday season. The retail industry is already in a period of seasonal strength that runs through to the start of December. Stocks in the industry gain an average of just over 6% between the end of October and the beginning of December. This short-term run is topped by the next period of seasonal strength that starts in January, after the Christmas sales have been realized. Average gain for the industry between mid-January and mid-April is over 8%, outperforming the S&P 500 by 6.5% during the period. The S&P Retail Index remains in a positive long-term trend, characterized by higher-highs and higher-lows. The relative performance of the industry versus the S&P 500 has remained flat since July, however, early signs of a positive change may be becoming evident.
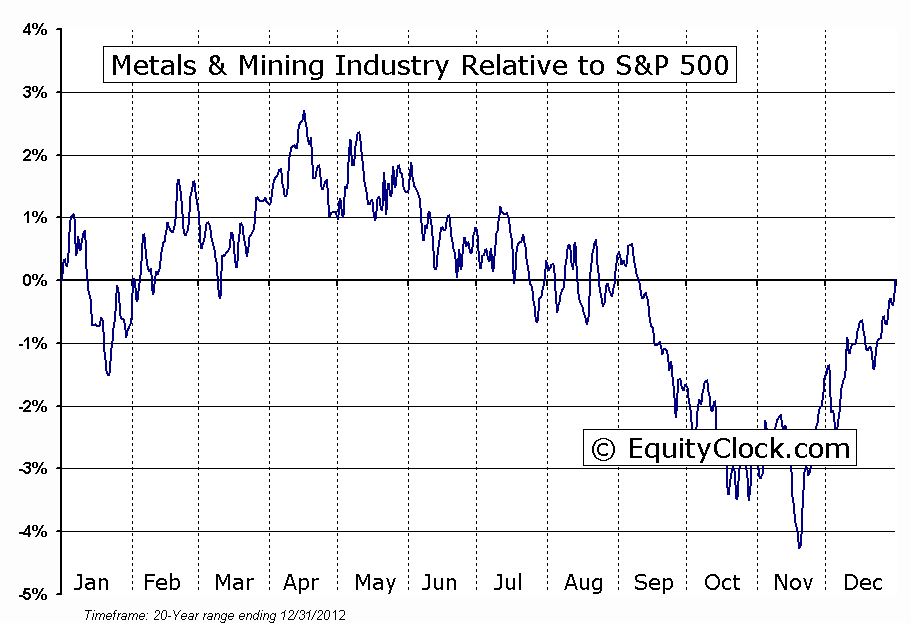
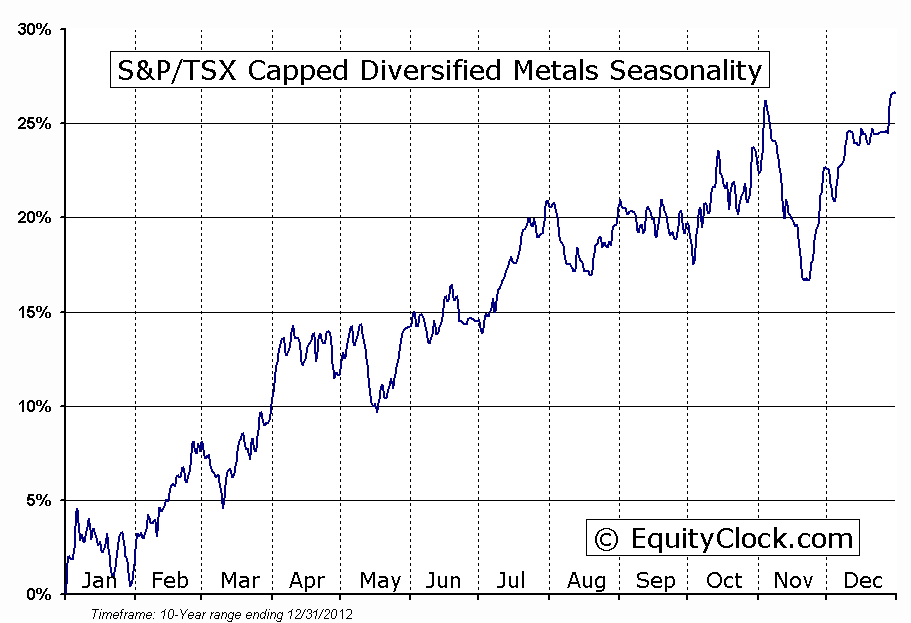
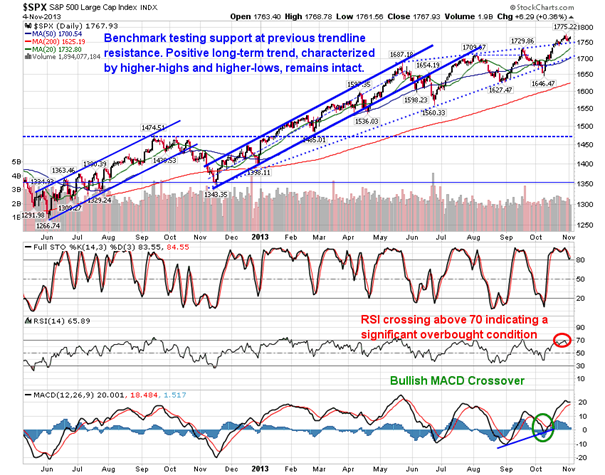
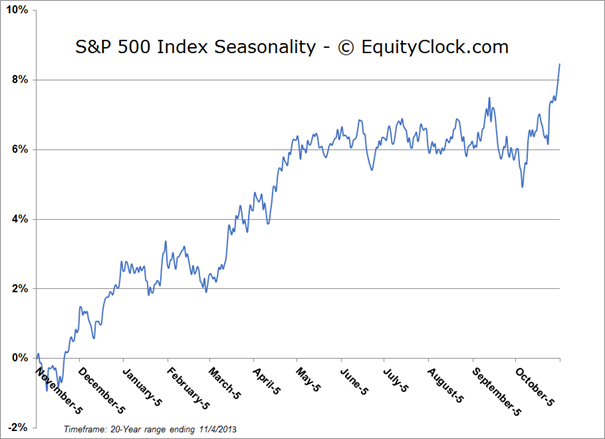
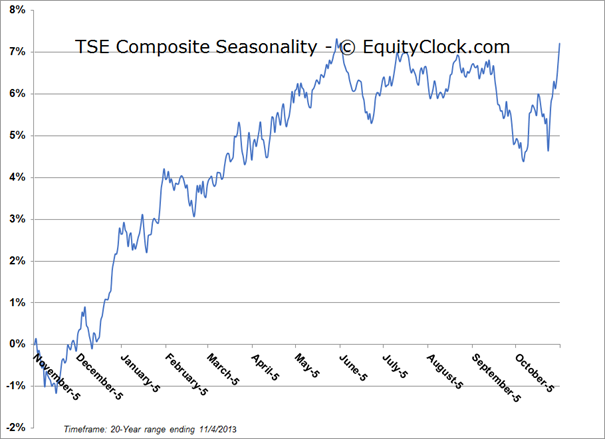
Looking at the broad market, momentum indicators across a number of benchmarks continue to roll over as stocks decline from overbought levels. Sell signals with respect to MACD and Stochastics appear imminent, which, if realized, would suggest continued downside pressures. The long-term trend of higher-highs and higher-lows remains intact and momentum indicators recently shifted from a negative to a positive trend, suggesting that any short-term term weakness will likely be minimal as the market continues on its present path to new highs. Short-term seasonal weakness is evident on the charts between November 6th and November 20th with declines for the S&P 500 averaging 0.65% over the two week period. This typically leads to buy triggers for a number of other sectors that begin positive seasonal trends a little later than the widely followed October 28th buy date, such as the metals and mining industry, which enters a period of seasonal strength closer to the end of November.
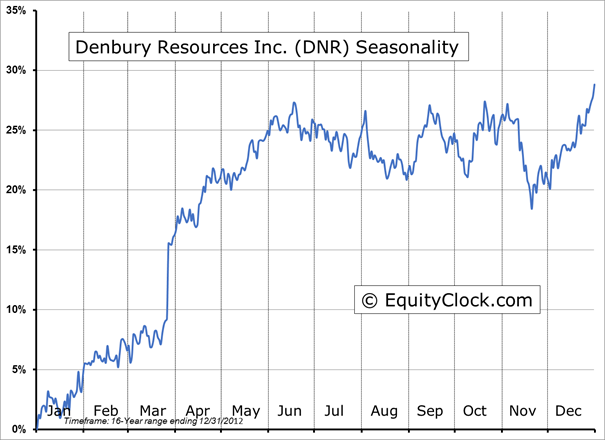
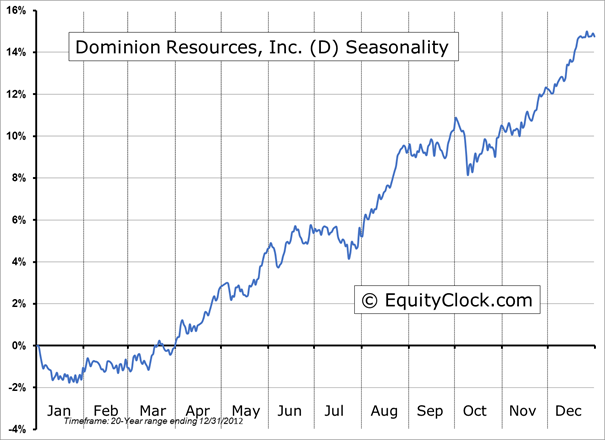
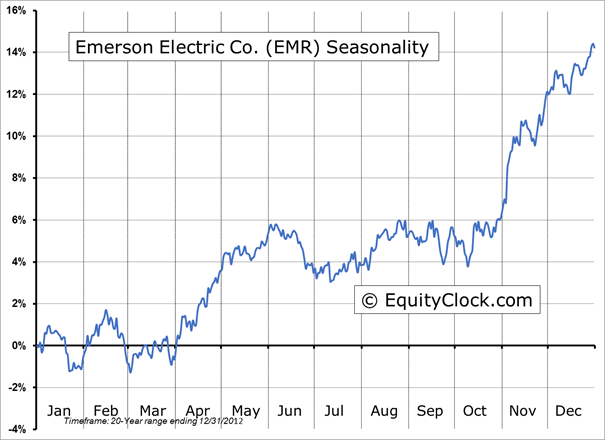
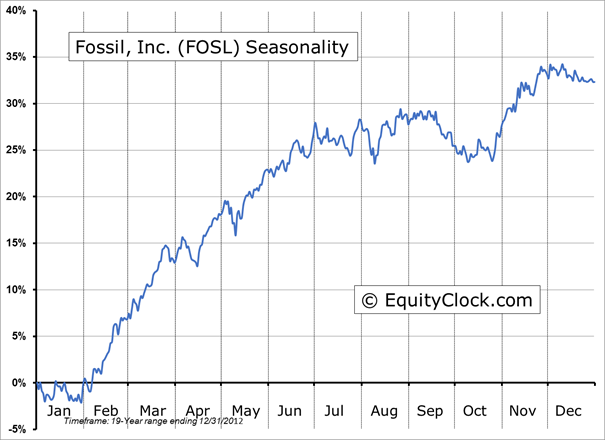
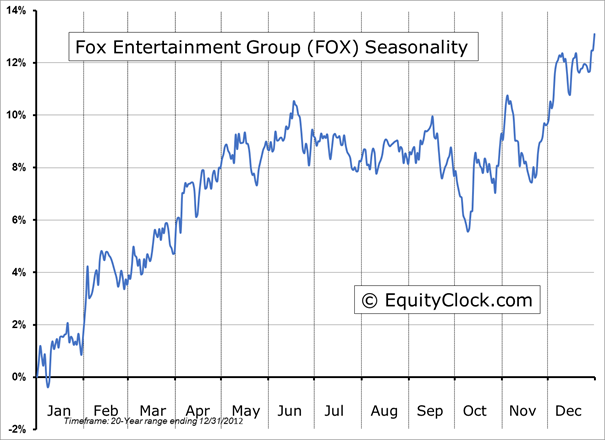
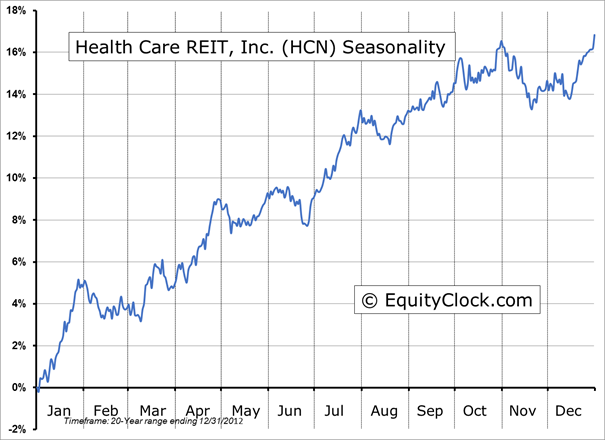
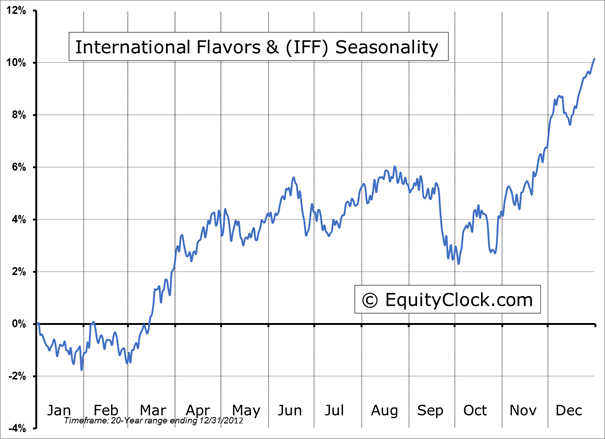
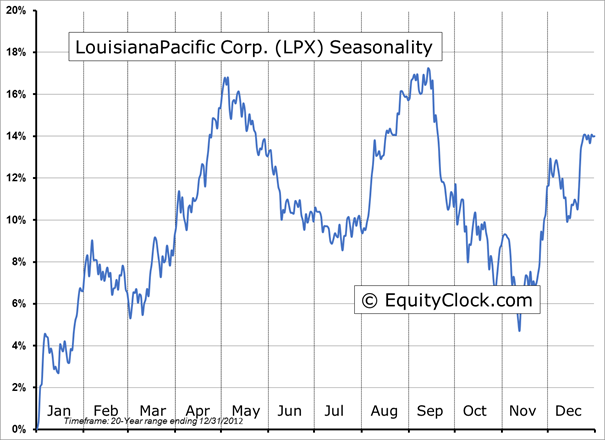
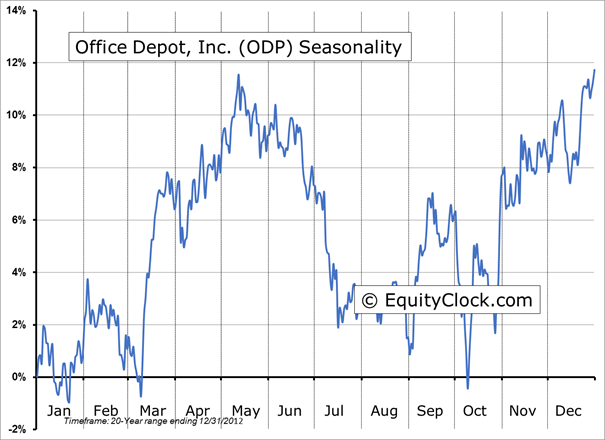
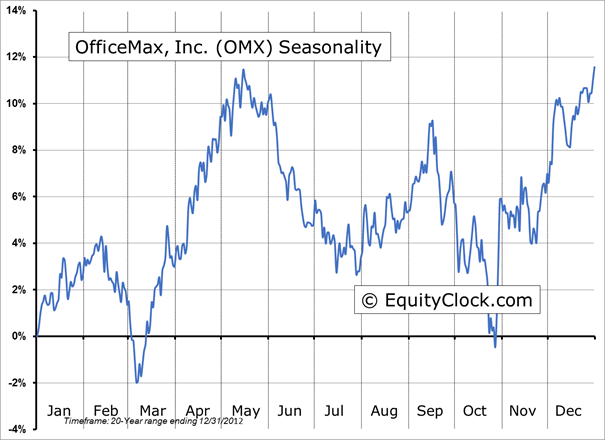
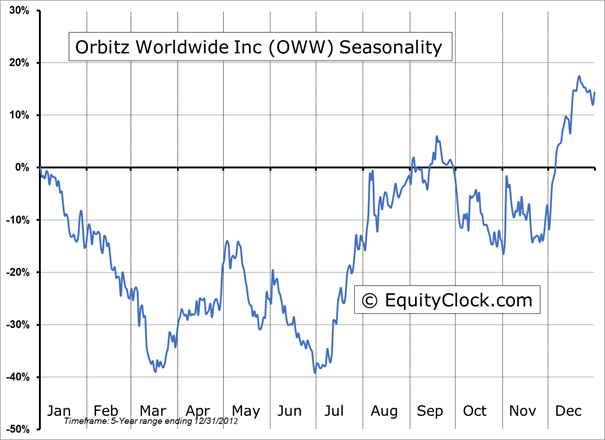
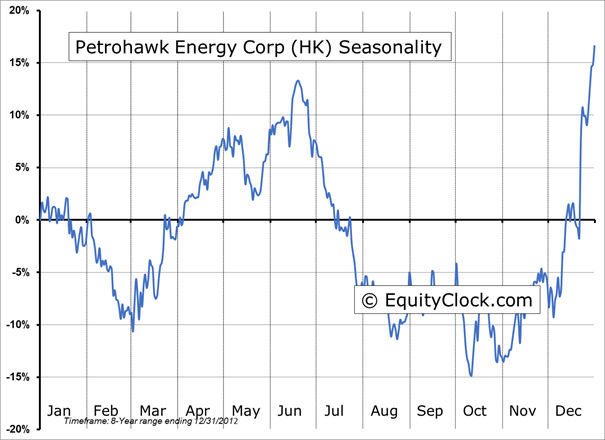
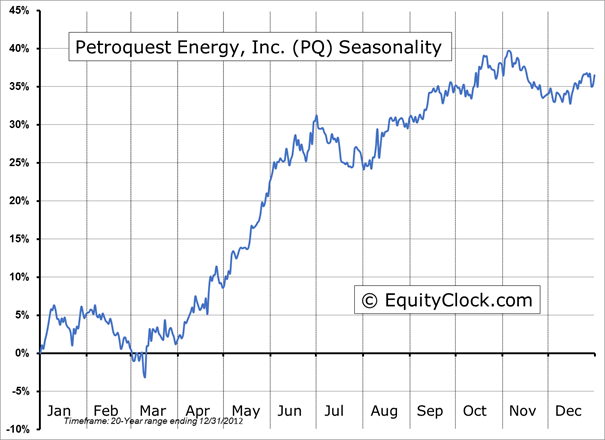
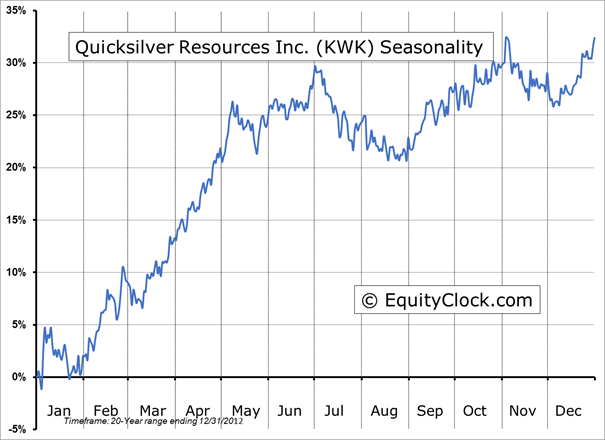
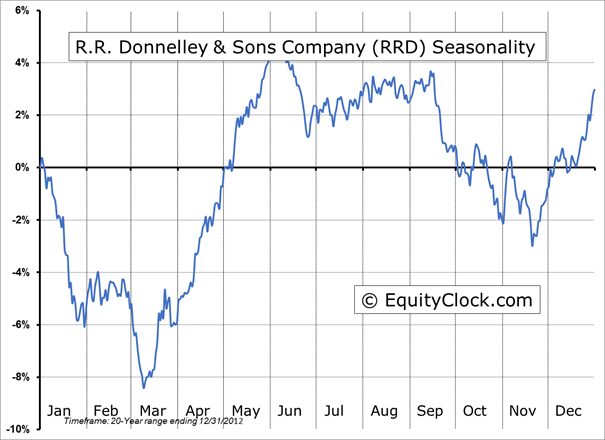
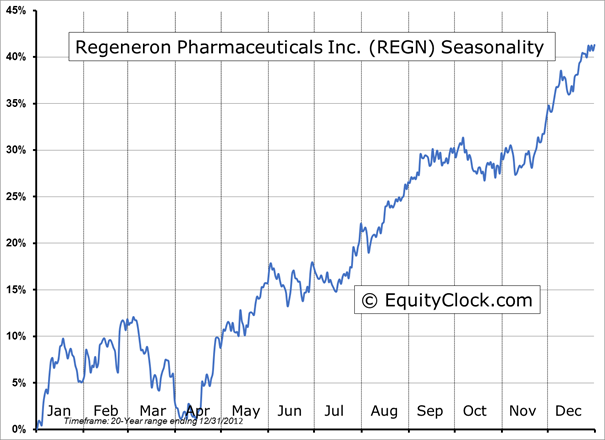
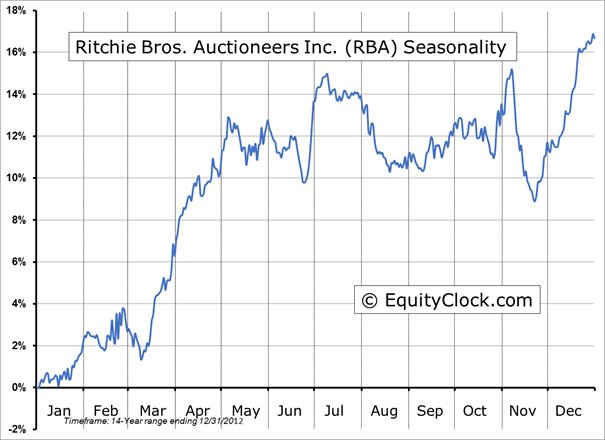
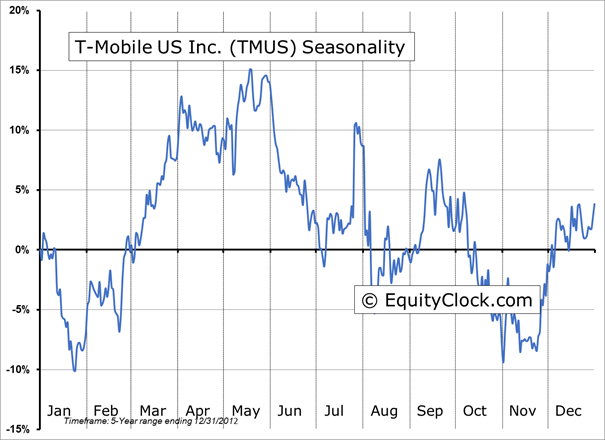
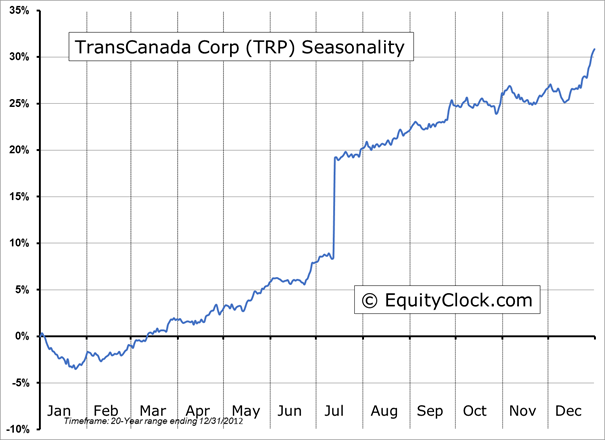
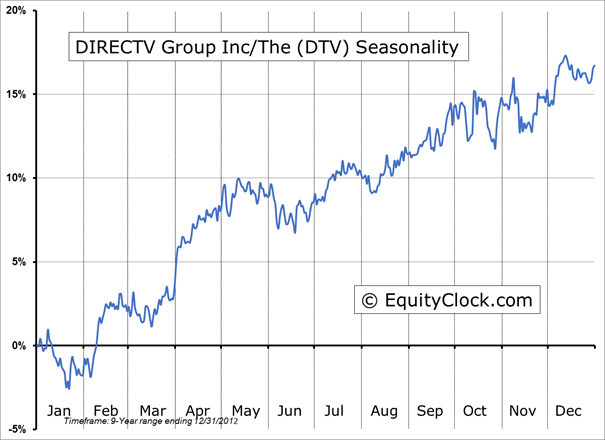
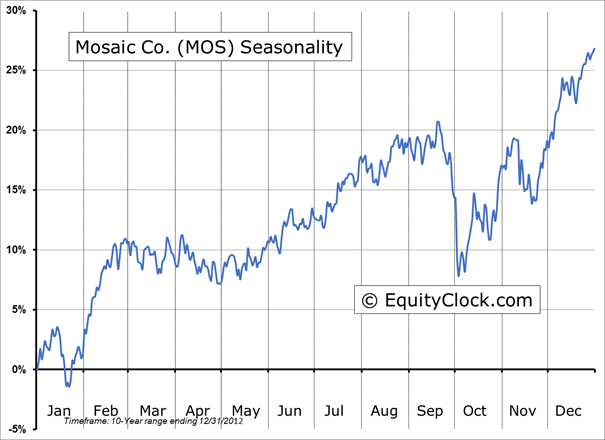
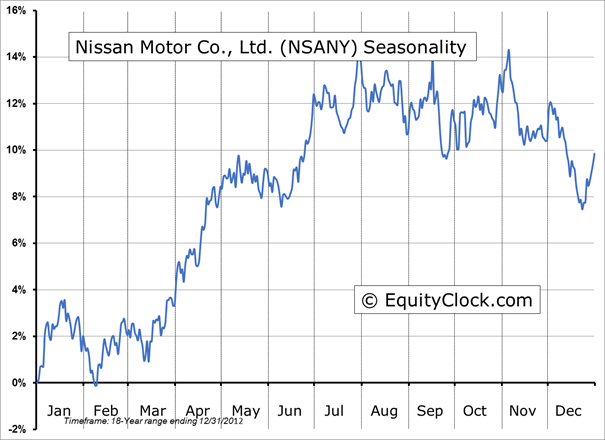
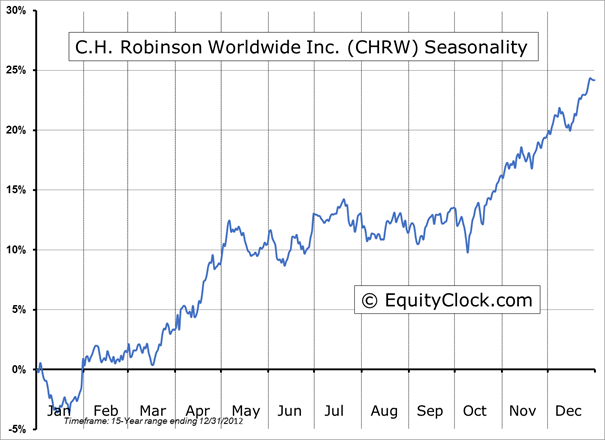
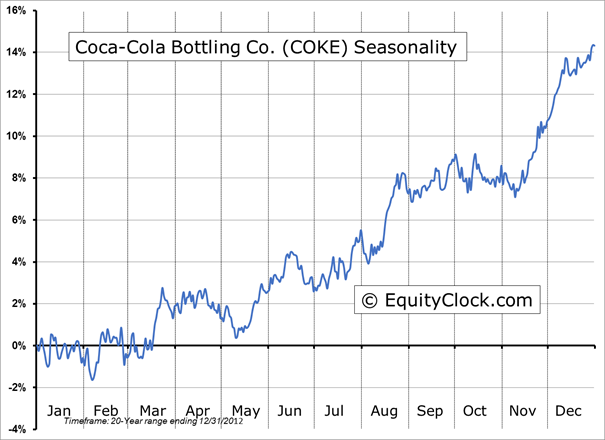
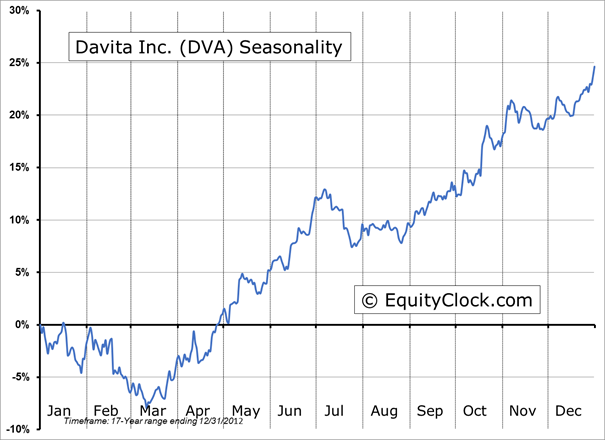
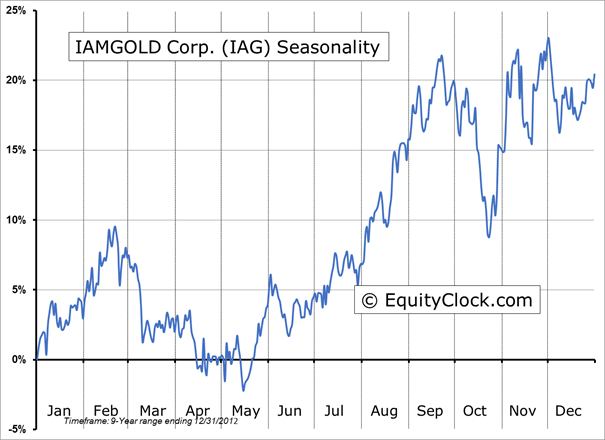
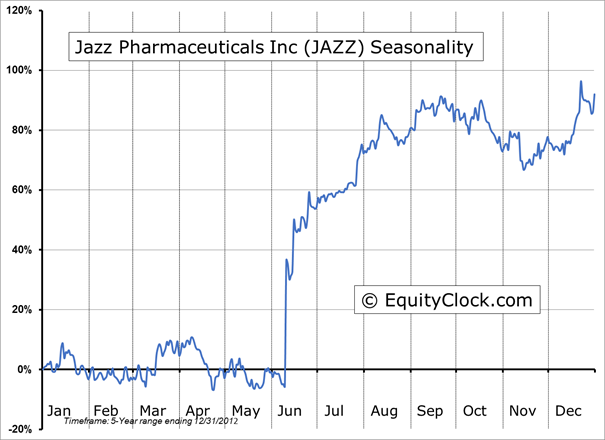
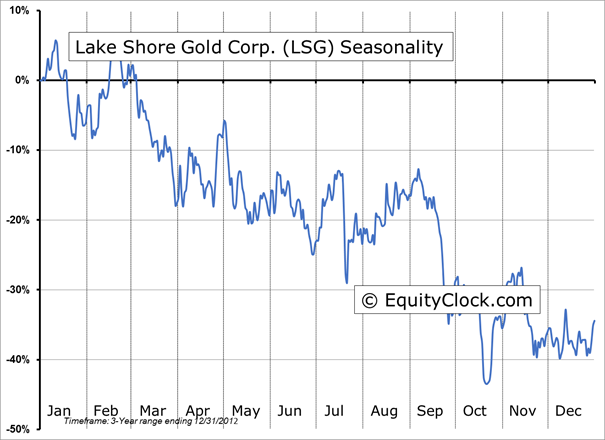
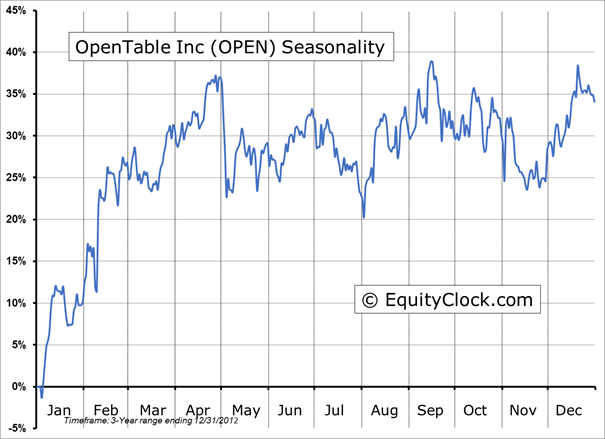
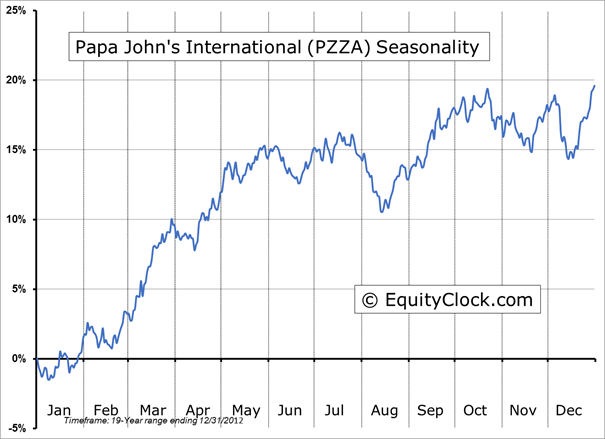
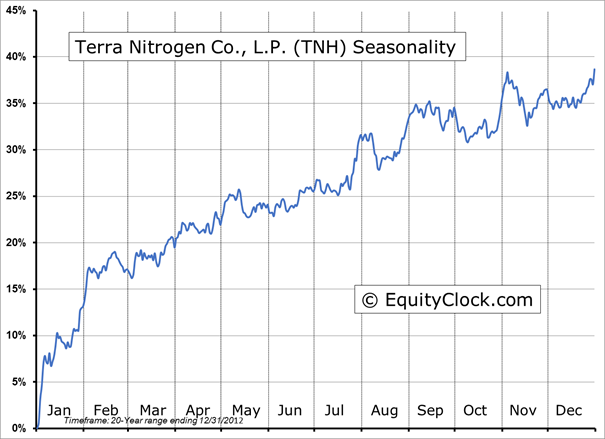
Seasonal charts of companies reporting earnings today:
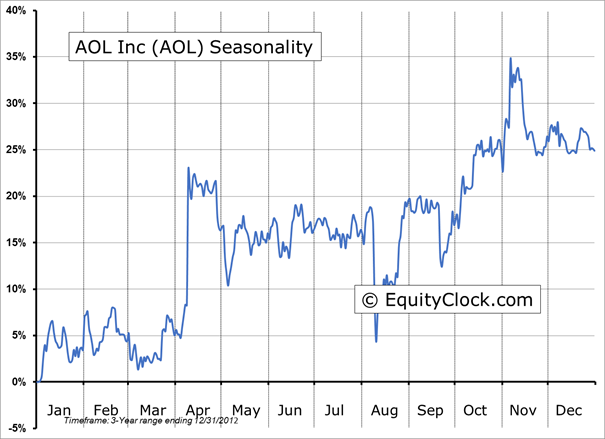
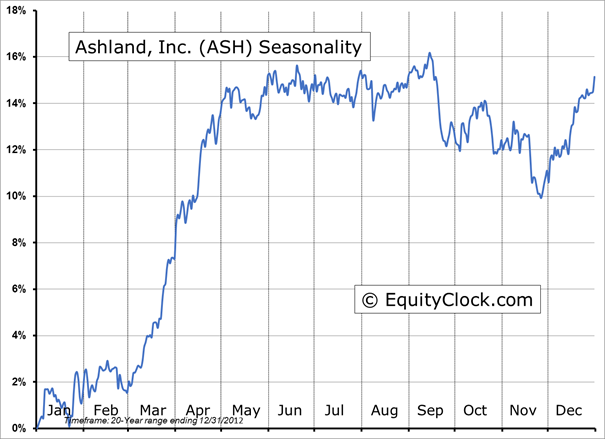
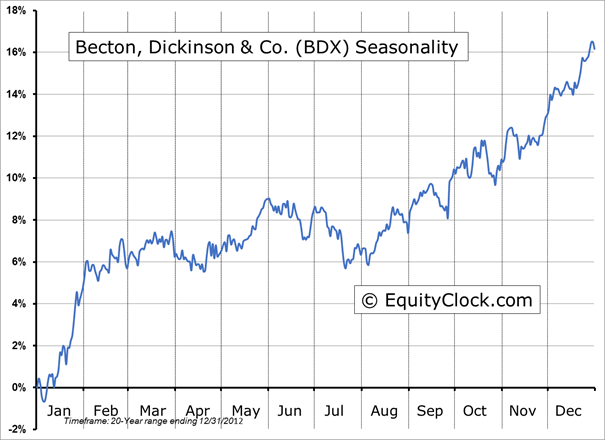
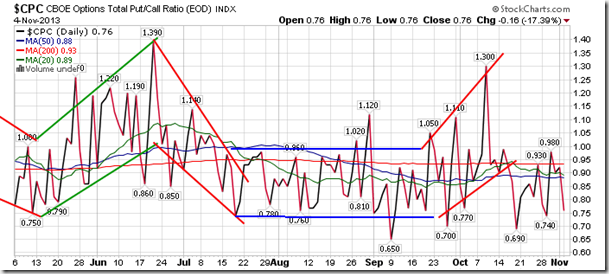
Sentiment on Monday, as gauged by the put-call ratio, ended bullish at 0.76. Once again, the ratio has pushed back to the lows of the year as more upside calls are traded as opposed to protective puts, leaning the boat to an overly bullish stance on the market. This, as always, opens the risk to shock events, which has the potential to lead to swift selling pressures in order to correct the imbalance.
S&P 500 Index
TSE Composite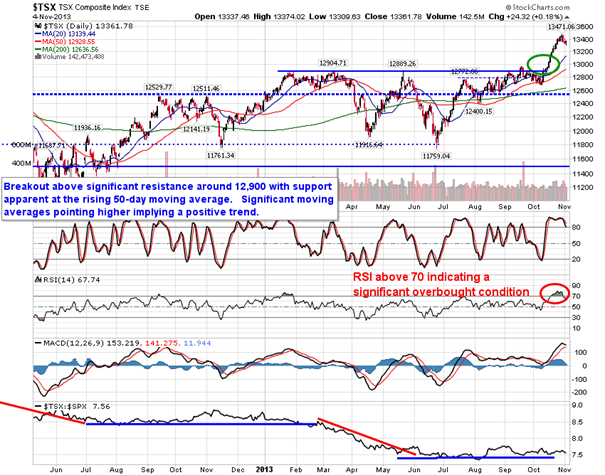
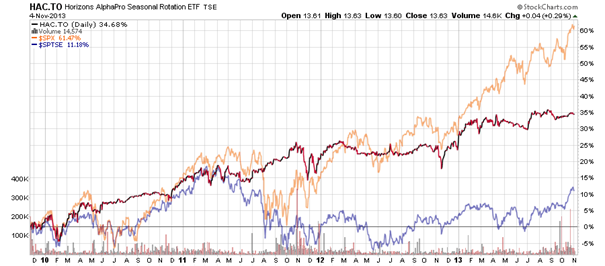
Horizons Seasonal Rotation ETF (TSX:HAC)
- Closing Market Value: $13.63 (up 0.29%)
- Closing NAV/Unit: $13.62 (up 0.27%)
Performance*
* performance calculated on Closing NAV/Unit as provided by custodian 