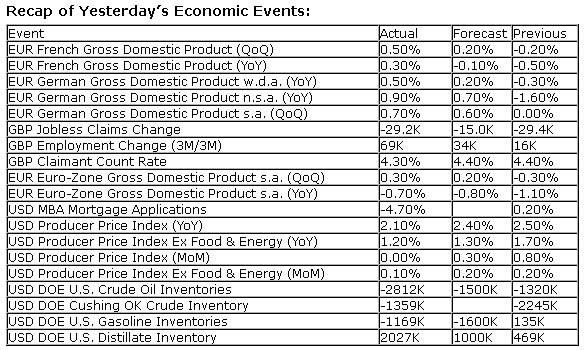
- Consumer Price Index for July will be released at 8:30am. The market expects a month-over-month increase of 0.2% versus an increase of 0.5% previous. Excluding food and energy, the increase is expected to show 0.2%, consistent with the previous report.
- Weekly Jobless Claims will be released at 8:30am. The market expects 330K versus 333K previous.
- Empire State Manufacturing Survey for August will be released at 8:30am. The market expects 10.00 versus 9.46 previous.
- Industrial Production for July will be released at 9:15am. The market expects a month-over-month increase of 0.3%, consistent with the previous report. Capacity Utilization is expected to increase to 77.9% versus 77.8% previous.
- Housing Market Index for August will be released at 10:00am. The market expects 56 versus 57 previous.
- Philadelphia Fed Survey for August will be released at 10:00am. The market expects 15.0 versus 19.8 previous.
- Great Britain Retail Sales for July will be released at 4:30am EST. The market expects a year-over-year increase of 2.7% versus an increase of 2.2% previous.

The Markets
Equity markets finished lower on Wednesday, continuing to roll over from a peak hit at the beginning of the month. The S&P 500 is now 1.4% below the all-time high set on August 2nd, while the Dow Jones Industrial Average is lower by just over 2%. The hourly chart of the S&P 500 currently shows a bearish setup that suggests further declines to come. Since the start-of-month peak, the large cap benchmark has derived a series of lower highs; support has remained evident around 1685, forming the lower limit of an apparent descending triangle continuation pattern. A break of this level of support implies a downside move of 25 points to approximately 1660, potentially testing the 50-day moving average level. Momentum indicators for broad market indices continue to roll over suggesting a pullback is in the works. Seasonal tendencies for the broad market between now and October remain flat to negative.
Investors continue to be drawn to the activity in the commodity market as Gold, Silver, Copper, and Oil continue to show strength amidst this equity market weakness. The CRB Commodity index has now charted the first higher intermediate low in almost a year; the long-term negative trend-line has been broken to the upside, suggesting a change of trend from negative to positive. But with the positive move in commodity markets, could the Canadian Dollar be poised for a move higher as well? The Canadian currency enters into a minor period of seasonal strength from around this time of year through to the end of September, gaining just over 1%, on average, over the timeframe. The currency has been on a long-term decline since September of last year, charting a series of lower-lows and lower-highs. But recently, the "Canuck Buck" charted an higher intermediate-low, similar to the CRB Commodity Index. A reverse head-and-shoulders bottoming pattern is becoming evident on the chart. Should the dollar break above the neckline, currently around $0.97, a move toward $1.02 would be expected over the course of the period of seasonal strength ahead. With more US Dollars required to purchase/convert to Canadian dollars, the appreciation in the currency could prove to be detrimental to Canadian investors that hold US positions without an appropriate hedge.

Seasonal charts of companies reporting earnings today:


Sentiment on Wednesday, according to the put-call ratio, ended bullish at 0.79, still within the neutral range that has been evident for just over a month.
S&P 500 Index

TSE Composite

Horizons Seasonal Rotation ETF (TSX:HAC)
- Closing Market Value: $13.65 (up 0.37%)
- Closing NAV/Unit: $13.63 (up 0.55%)

*
performance calculated on Closing NAV/Unit as provided by custodian
Click Here to learn more about the proprietary, seasonal rotation investment strategy developed by research analysts Don Vialoux, Brooke Thackray, and Jon Vialoux.
