Upcoming US Events for Today:
- Weekly Crude Inventories will be released at 10:30am.
- The Treasury Budget for January will be released at 2:00pm. The market expects –$30.8B versus $53.2B previous.
Upcoming International Events for Today:
- China Trade Balance for January will be released. The market expects a surplus of $23.45B versus $25.64B previous.
- Euro-Zone Industrial Production for December will be released at 5:00am EST. The market expects a year-over-year increase of 1.9% versus an increase of 3.0% previous.
- Bank of England Inflation Report will be released at 5:30am EST.
Recap of Yesterday’s Economic Events:
| Event | Actual | Forecast | Previous |
| USD NFIB Small Business Optimism | 94.1 | 93.9 | 93.9 |
| USD JOLTs Job Openings | 3990 | 3980 | 4033 |
| USD Wholesale Inventories | 0.30% | 0.50% | 0.50% |
| USD Wholesale Trade Sales (MoM) | 0.50% | 0.70% | 1.00% |
| JPY Tertiary Industry Index (MoM) | -0.40% | -0.30% | 0.80% |
| JPY Machine Orders (MoM) | -15.70% | -4.00% | 9.30% |
| JPY Machine Orders (YoY) | 6.70% | 17.40% | 16.60% |
The Markets
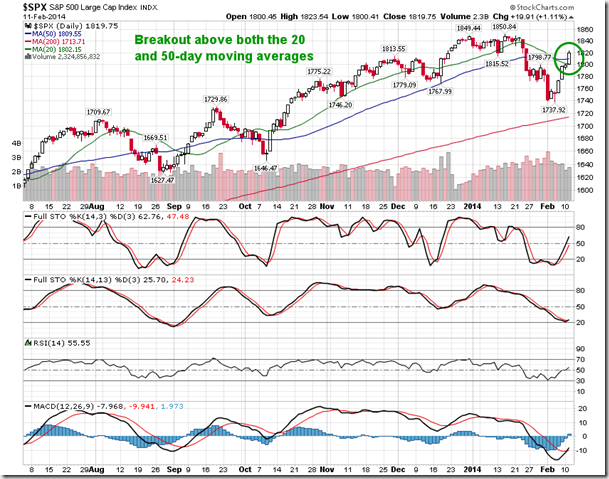
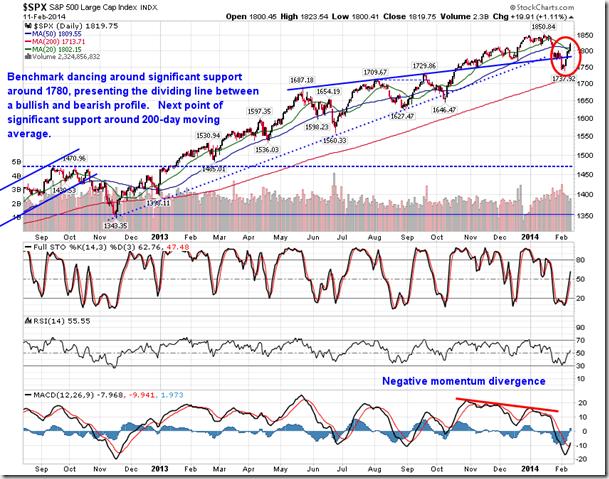
Stocks surged on Tuesday as investors expressed their approval of comments made by the new Fed Chair, Janet Yellen. Major equity benchmarks in the US climbed over one percent on the session, led by health care and energy stocks. The S&P 500 Index broke firmly above both its 20 and 50-day moving averages as stocks continue to rebound from the recent slide to oversold levels. The all-time high of 1850 remains the key hurdle in order to keep the prevailing trend of higher-highs and higher-lows alive.
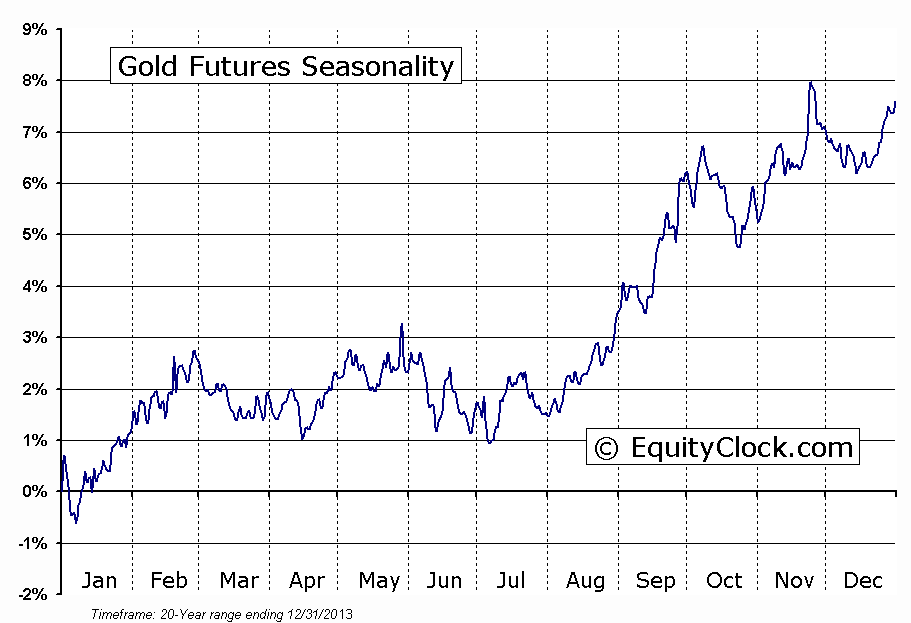
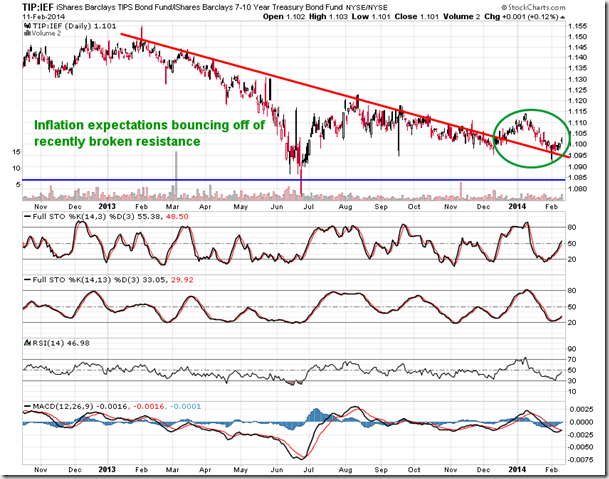
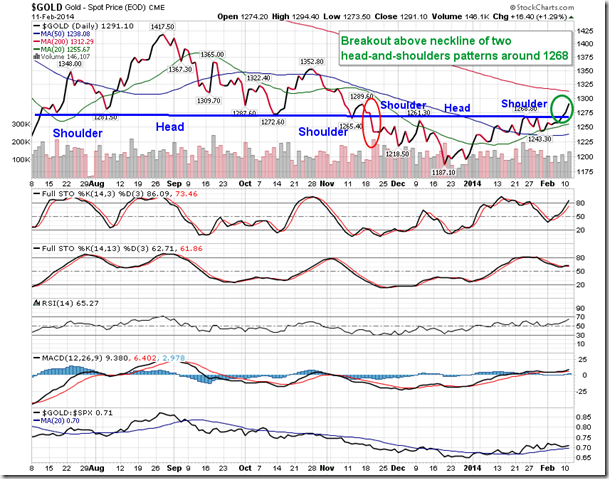
The new Fed Chair expressed her commitment to maintain an accommodative monetary policies, as long as conditions warrant. One of those conditions pertains to the rate of inflation, which remains below the Fed’s target of 2%. The Fed has attempted to influence the rate of inflation higher throughout the latest quantitative easing program, but the results have been less than successful; disinflationary pressures have dominated throughout the past year. However, it appears that now that tapering has begun, inflation expectations are beginning to perk up. The chart of the Treasury Inflation Protected ETF (TIP) versus the 7-10 Year Treasury Bond Fund (IEF) is showing signs of bouncing from previously broken resistance derived by a long-term declining trendline. A change of trend from negative to positive is being suggested. Of course, inflationary pressures have implications on the commodity market. The CRB Commodity Index is showing a similar breakout above a long-term declining trendline as energy, agriculture, and metal commodities show signs of pointing higher. Gold has just broken above resistance presented by the neckline of a reverse head-and-shoulders pattern, suggesting upside potential to $1350, or around 4.5% higher than present levels. Seasonal tendencies for Gold remain positive through to the end of February, while many other commodities show seasonal strength through to May.
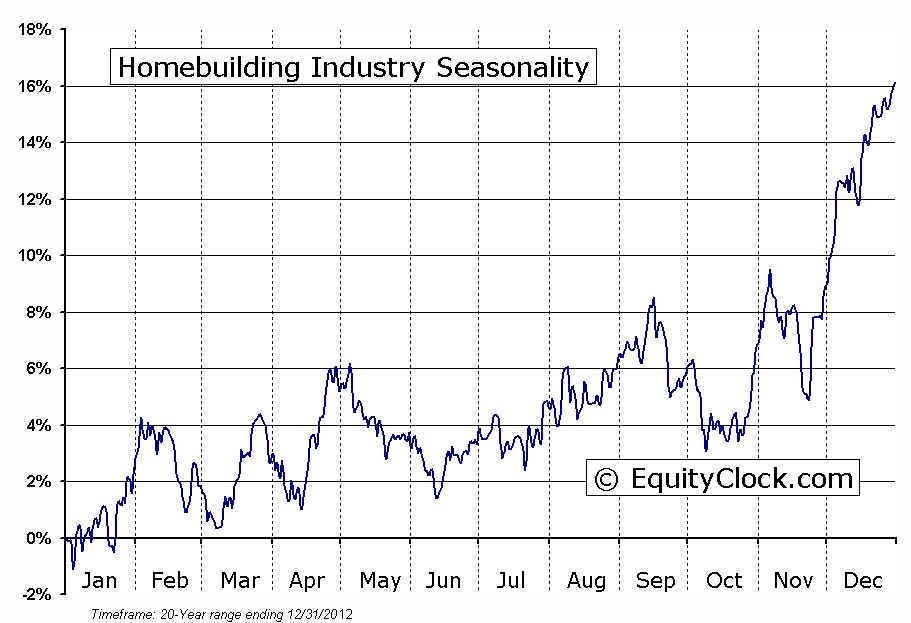
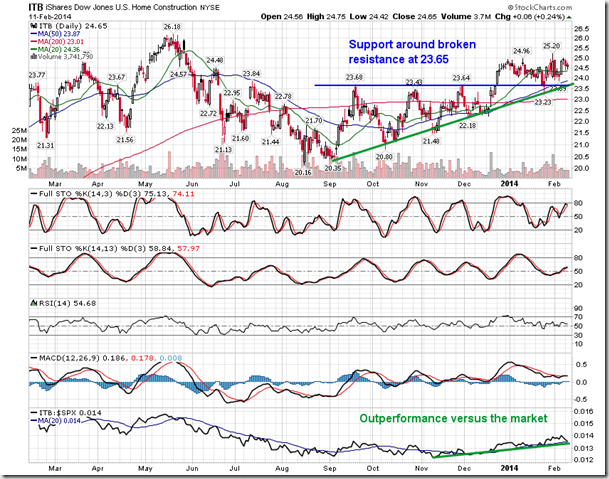
Flipping back to the stock market, the seasonal trade in the home building/construction industry is coming to an end. Stocks within the industry seasonally gain from the middle of October to the middle of February, gaining around 16% on average; this year the trade returned precisely that amount. The Home Construction ETF (ITB) charted a higher low in the middle of October around $21.25, providing an ideal entry point to the seasonal trend ahead. With Tuesday’s close at $24.65, the 16% target has been hit. The trend of the industry ETF remains firmly positive, with converging levels of support directly underneath. Outperformance versus the broad equity market also continues to trend higher. With the average end to the seasonal run upon us, rotation to other areas of the market should be considered.
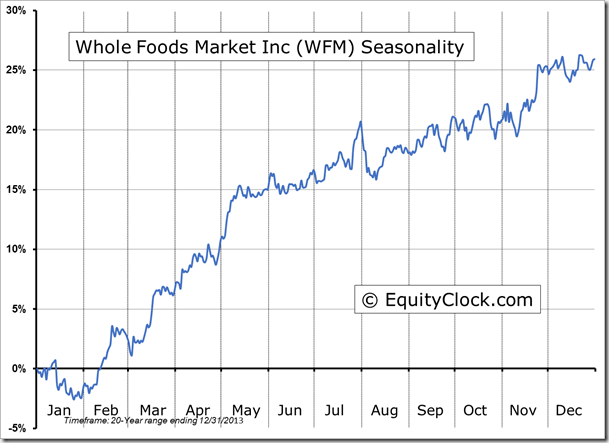
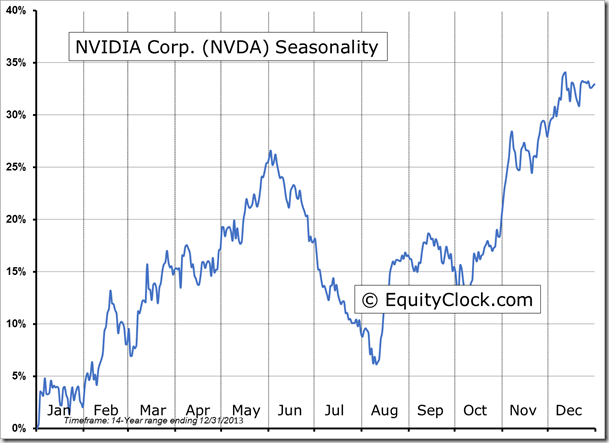
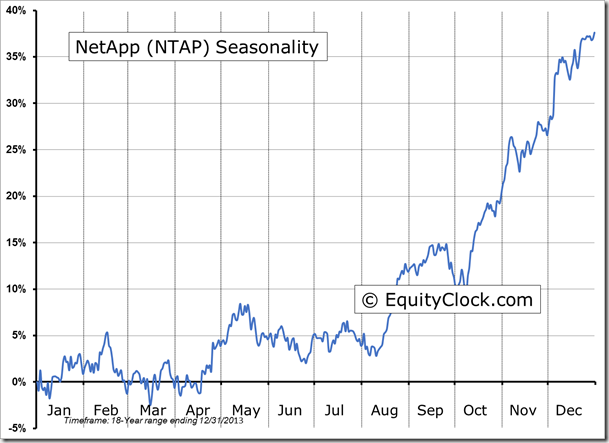
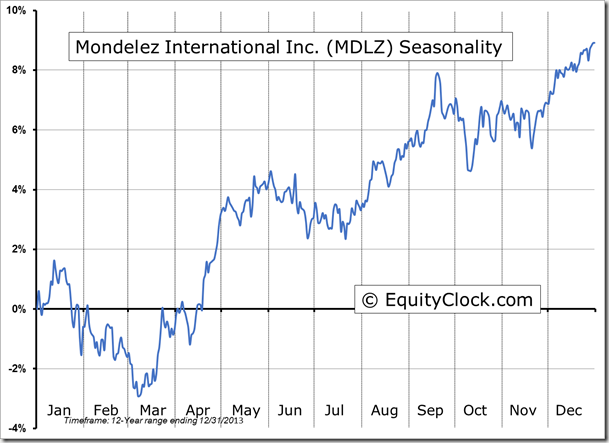
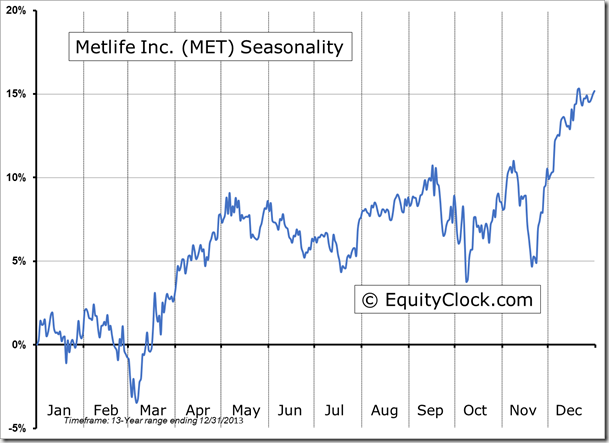
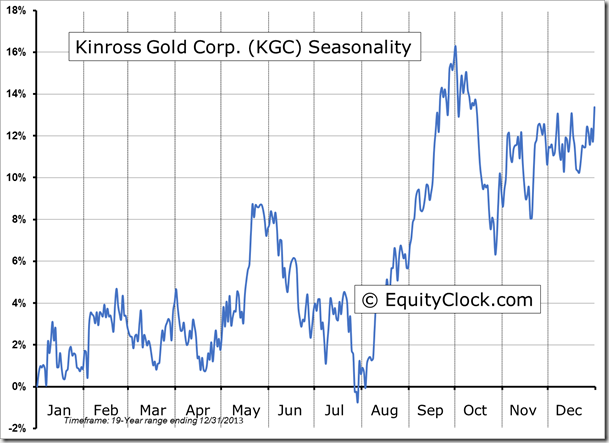
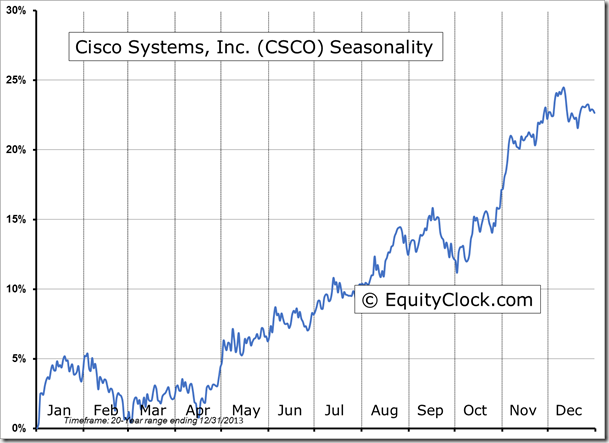
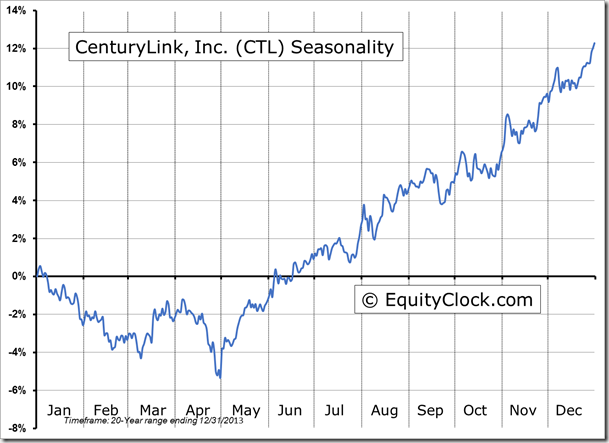
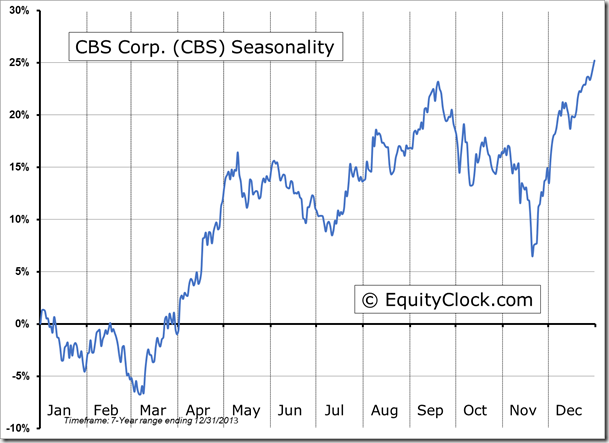
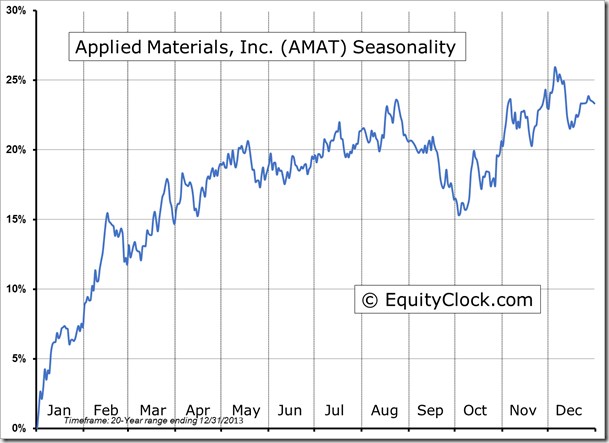
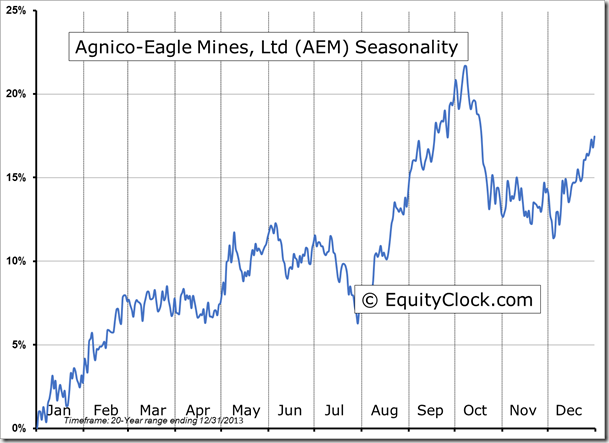
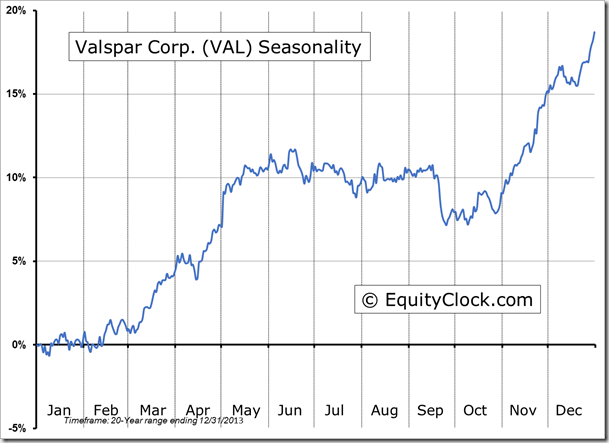
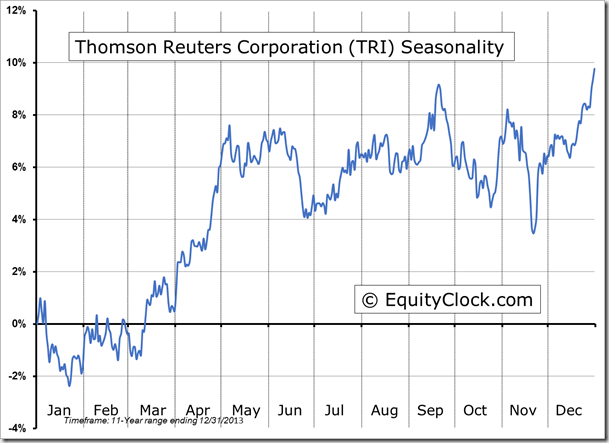
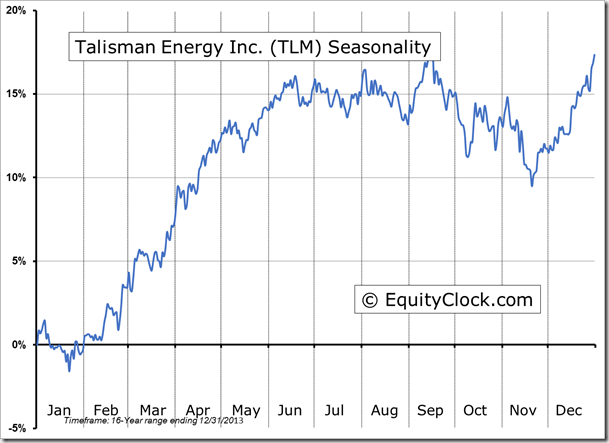
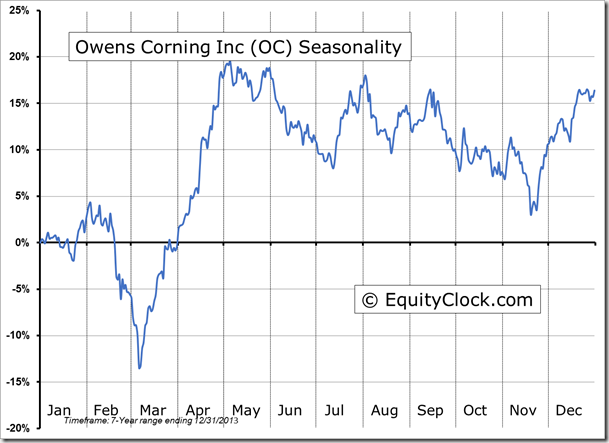
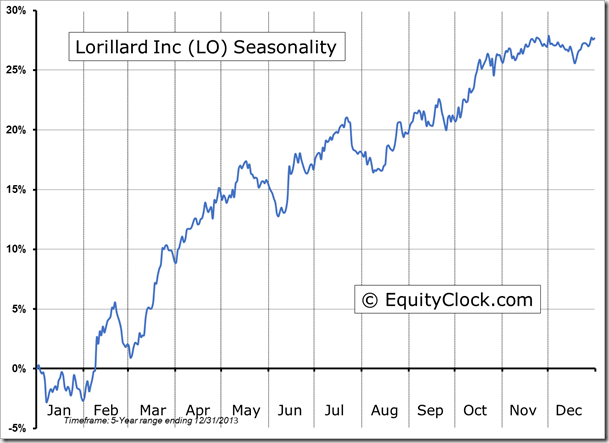
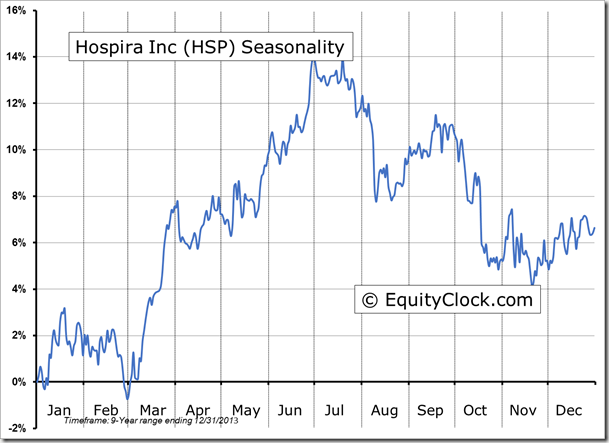
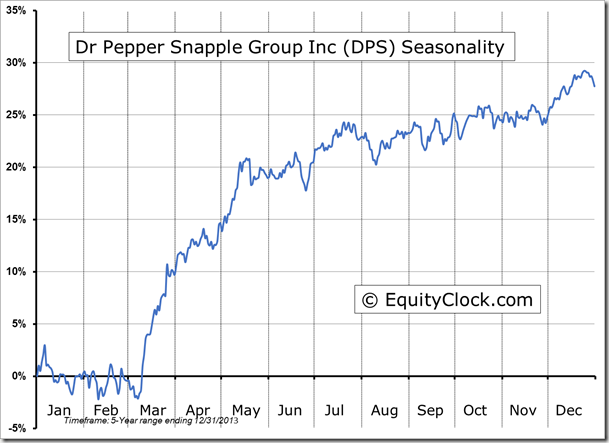
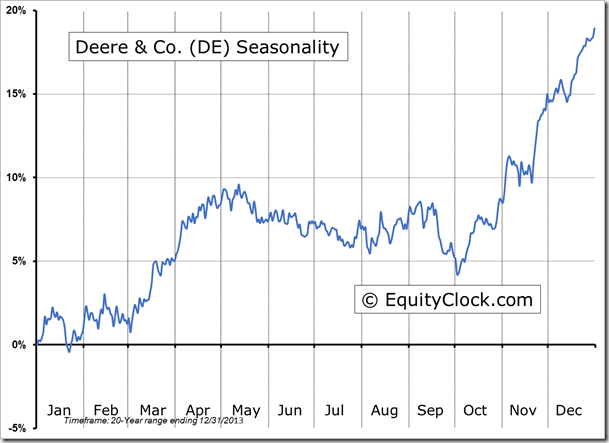
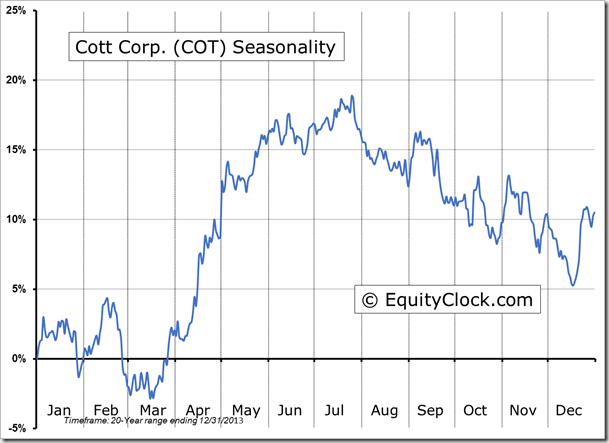
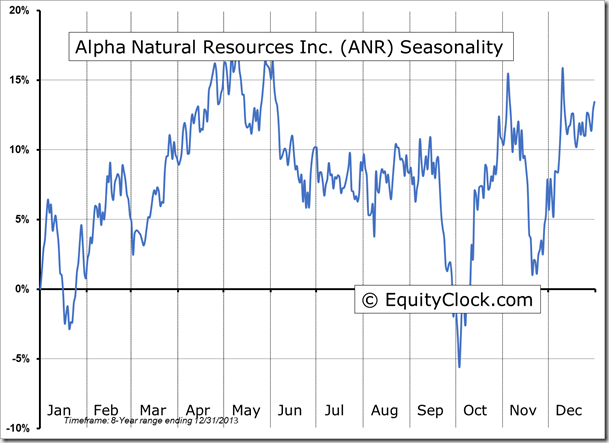
Seasonal charts of companies reporting earnings today:
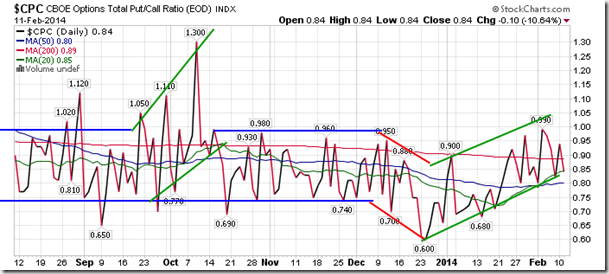
Sentiment on Tuesday, as gauged by the put-call ratio, ended bullish at 0.84
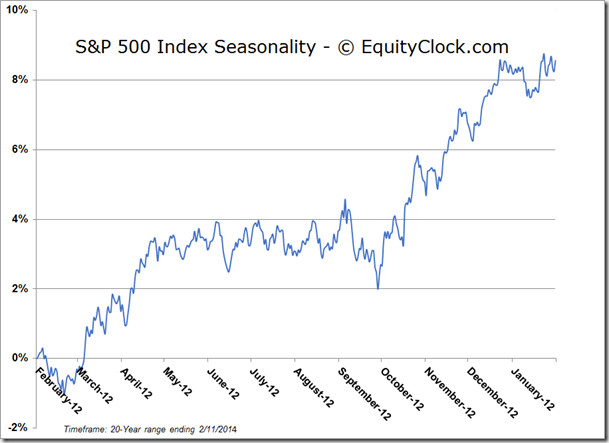
S&P 500 Index
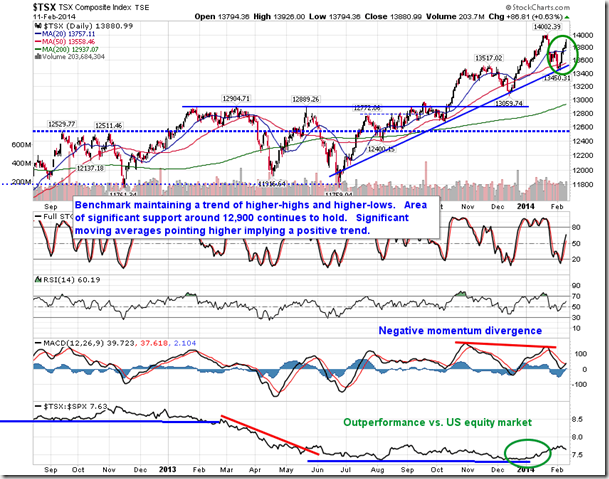
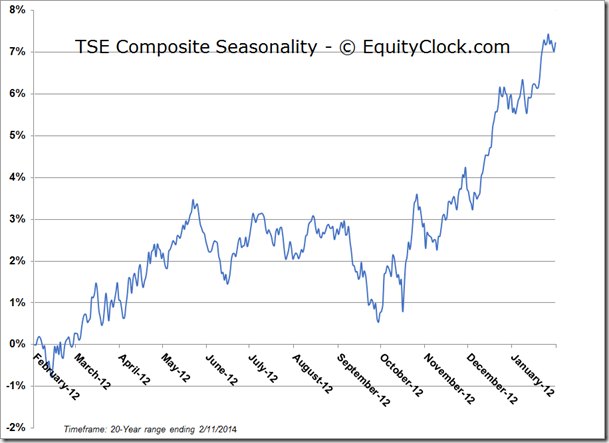
TSE Composite
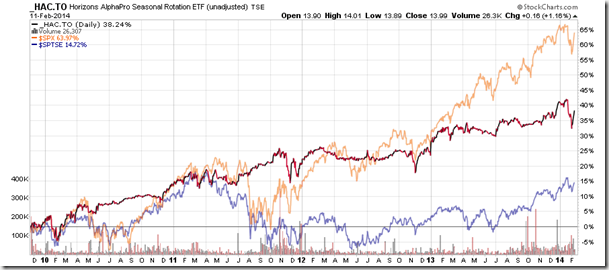
Horizons Seasonal Rotation ETF (TSX:HAC)
- Closing Market Value: $13.99 (up 1.16%)
- Closing NAV/Unit: $14.01 (up 1.00%)
Performance*
| 2014 Year-to-Date | Since Inception (Nov 19, 2009) | |
| HAC.TO | -2.03% | 40.1% |
* performance calculated on Closing NAV/Unit as provided by custodian
