Upcoming US Events for Today:
- Chicago Fed National Activity Index for January will be released at 8:30am.
- Dallas Fed Manufacturing Survey for February will be released at 10:30am. The market expects 2.5 versus 3.8 previous.
Upcoming International Events for Today:
- German IFO Survey for February will be released at 4:00am EST. Economic Sentiment is expected to show 110.8 versus 110.6 previous. Current Conditions is expected to show 112.9 versus 112.4 previous.Business Expectations is expected to show 108.4 versus 108.9 previous.
- Euro-Zone Consumer Price Index for January will be released at 5:00am EST. The market expects a year-over-year increase of 0.7%, consistent with the previous report.
- China Conference Board Leading Economic Index for January will be released at 9:00pm EST.
Recap of Friday’s Economic Events:
| Event | Actual | Forecast | Previous |
| GBP Public Sector Net Borrowing (Pounds) | -6.4B | -9.1B | 9.0B |
| GBP Retail Sales (MoM) | -1.50% | -1.20% | 2.70% |
| GBP Retail Sales (YoY) | 4.80% | 5.00% | 6.10% |
| GBP Public Finances (PSNCR) (Pounds) | -25.4B | -31.0B | 9.1B |
| CAD Retail Sales (MoM) | -1.80% | -0.40% | 0.50% |
| CAD Retail Sales Less Autos (MoM) | -1.40% | -0.10% | 0.30% |
| CAD Consumer Price Index (MoM) | 0.30% | 0.10% | -0.20% |
| CAD Consumer Price Index (YoY) | 1.50% | 1.30% | 1.20% |
| CAD Bank Canada Consumer Price Index Core (MoM) | 0.20% | 0.10% | -0.40% |
| CAD Bank Canada Consumer Price Index Core (YoY) | 1.40% | 1.30% | 1.30% |
| CAD CPI SA (MoM) | 0.20% | 0.20% | |
| CAD CPI Core SA (MoM) | 0.20% | 0.20% | |
| CAD Consumer Price Index | 123.1 | 122.7 | |
| USD Existing Home Sales | 4.62M | 4.67M | 4.87M |
| USD Existing Home Sales (MoM) | -5.10% | -4.10% | 0.80% |
The Markets
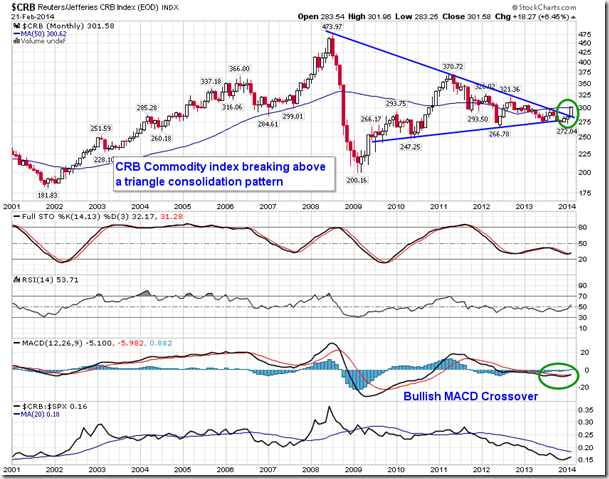
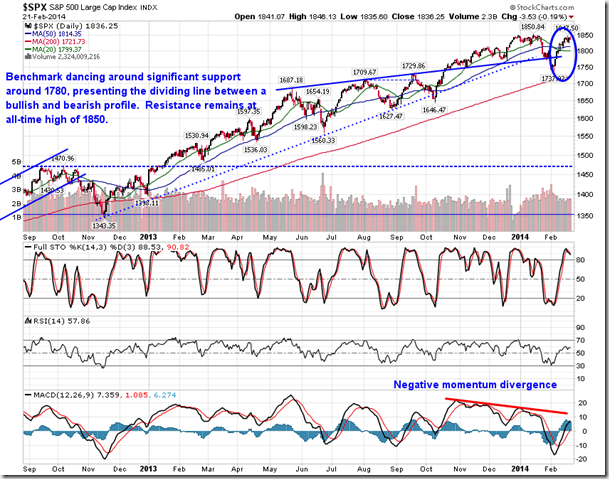
Stocks ended marginally lower on Friday, succumbing to selling pressures in the last two hours of the session as a result of options related trading ahead of the expiration. For the week, stocks were generally flat with the S&P 500 declining by 0.13% and the Dow Jones Industrial shedding 0.32%. The NASDAQ posted a respectable gain of 0.46%.The commodity market continues to attract the attention of investors. The CRB Commodity Index posted a strong gain of 2.84%, buoyed by strength in energy and metal commodity prices. The CRB Commodity index recently broke above the upper limit of a triangle consolidation pattern, which has longer-term positive implications for commodity prices and, likely, inflation related to commodity inputs. The monthly chart of the commodity benchmark also shows a bullish crossover with respect to MACD as the momentum indicator hooks up, placing it on a long-term buy signal. Commodities, in general, are seasonally strong during the first half of the year, particularly those related to energy and metals.
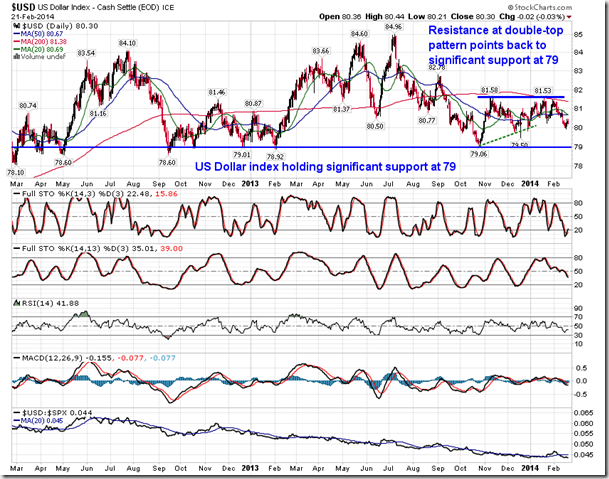
Supporting commodity prices is the recent weakness in the US Dollar Index, which rolled over after hitting double-top resistance around 81.50. The currency benchmark is now in a short-term negative trend with the 20-day moving average pointing lower; the 50-day moving average remains flat, implying a neutral intermediate trend. The target of the short-term double-top pattern points to long-term support at 79, representing a significant make-or-break point for the US currency relative to the rest of the world. A break below the long-term level of support would likely fuel significant gains in the commodity market, while a bounce from long-term support could bring an end to the recent strength in commodity prices.
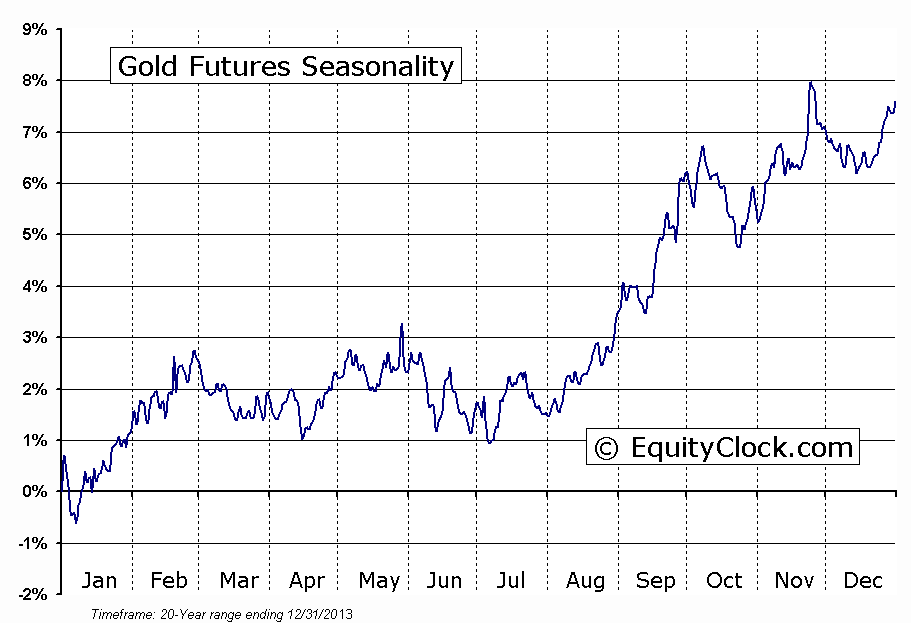
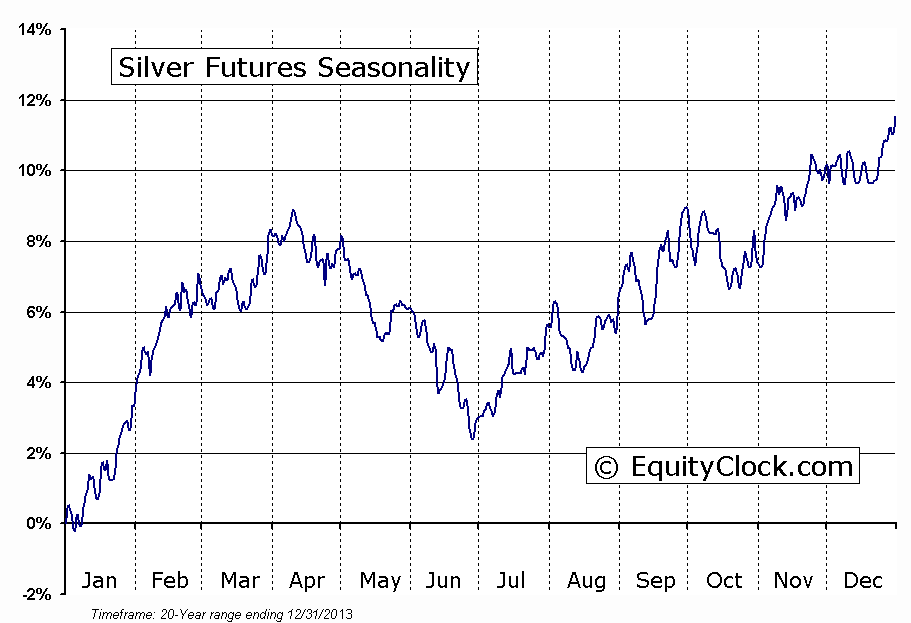
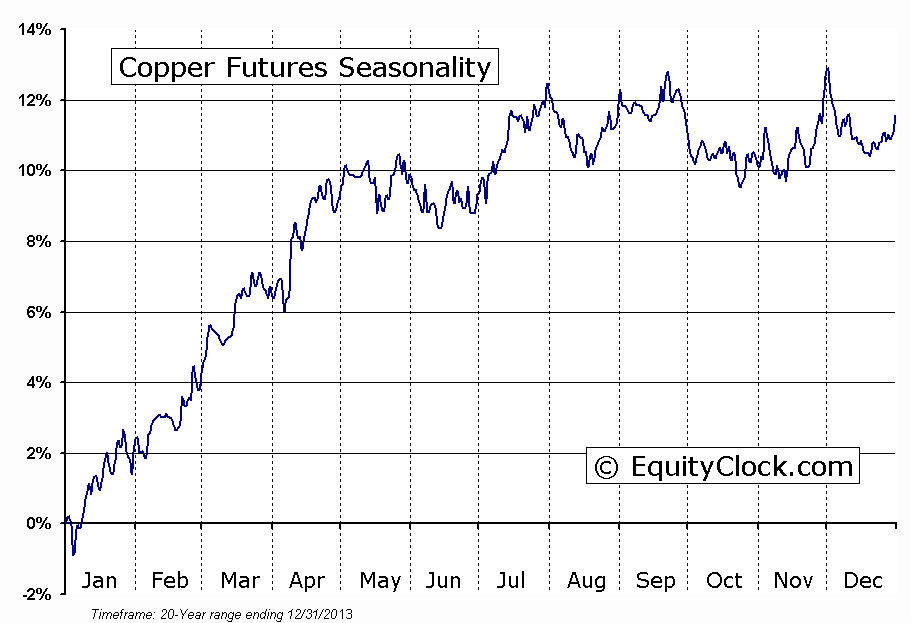
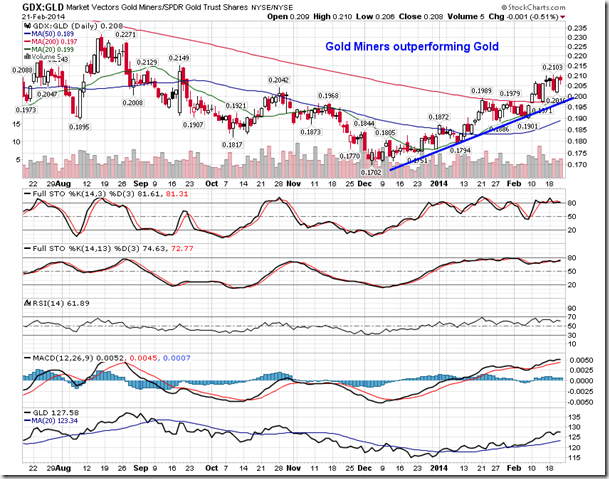
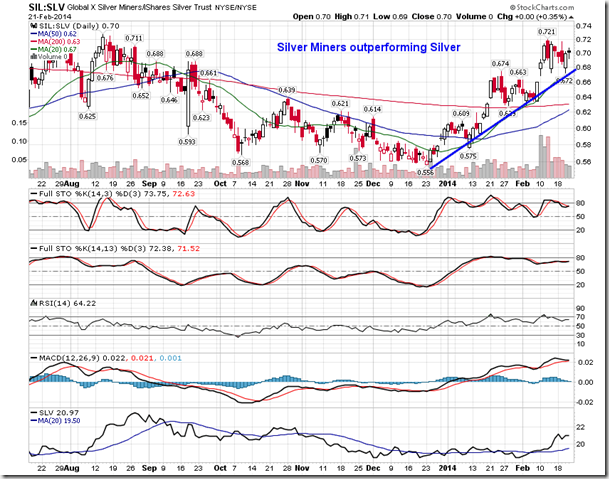
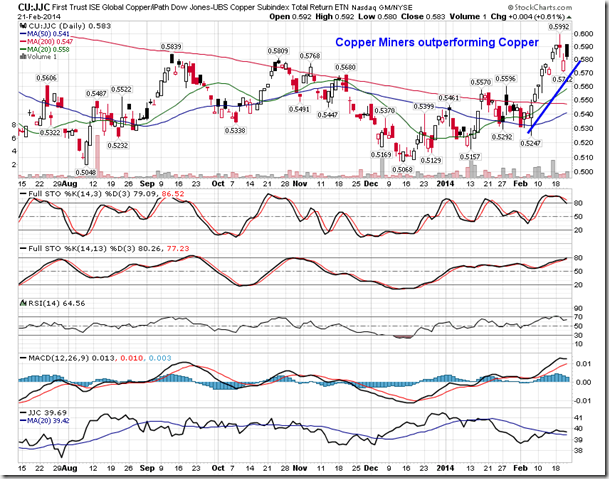
Strength in metals, such as silver, has investors wondering about the sustainability of the move given the dismal returns generated by these commodities in 2013. Generally, when investors are bullish on a commodity, the producers tend to be bid higher first, outpacing the returns of the commodity itself. Gold miners are outperforming gold bullion and silver miners are outperforming silver bullion, suggesting that investors remain bullish on the metals themselves. Even copper miners have been outperforming the price of copper, despite some rather lacklustre returns for the metal since the start of the year. As long as the miners continue to outperform the commodities, strength in the commodity prices should be expected. Metal prices, including silver and copper, remain in a period of seasonal strength through to April.
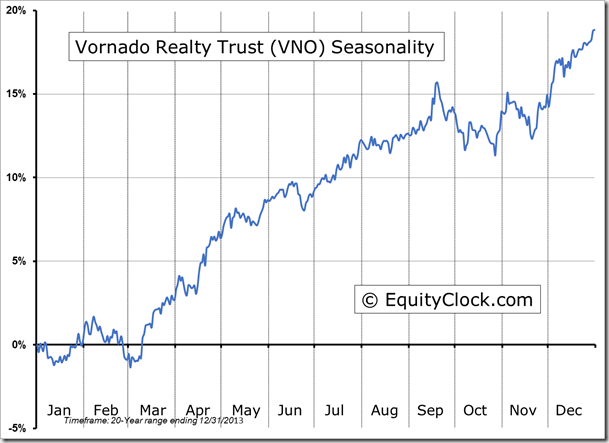
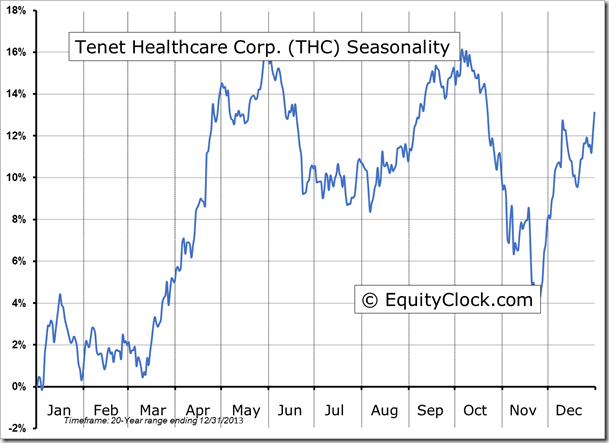
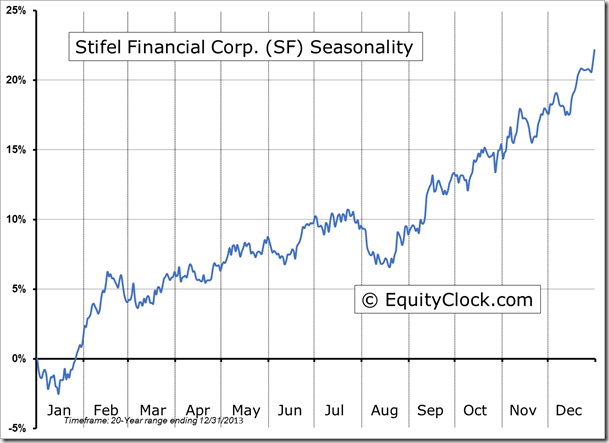
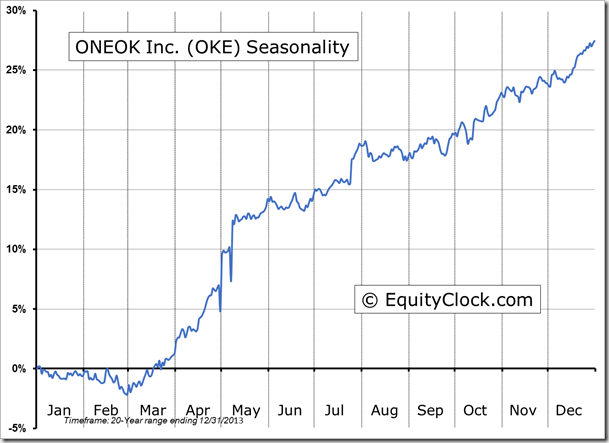
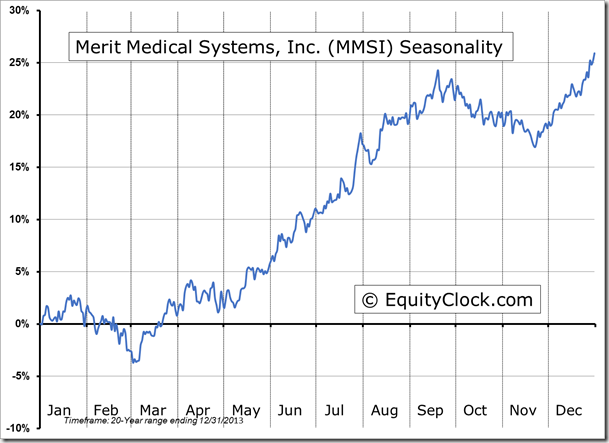
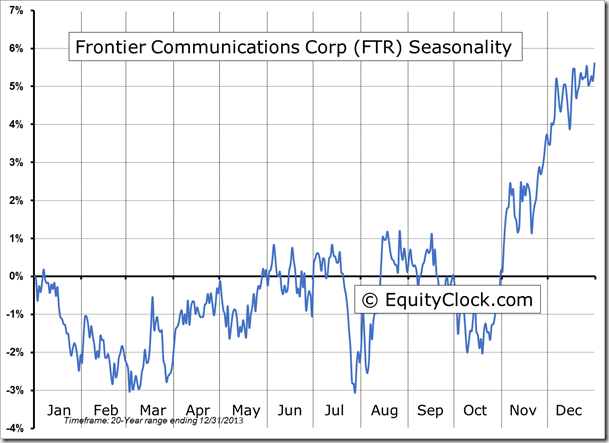
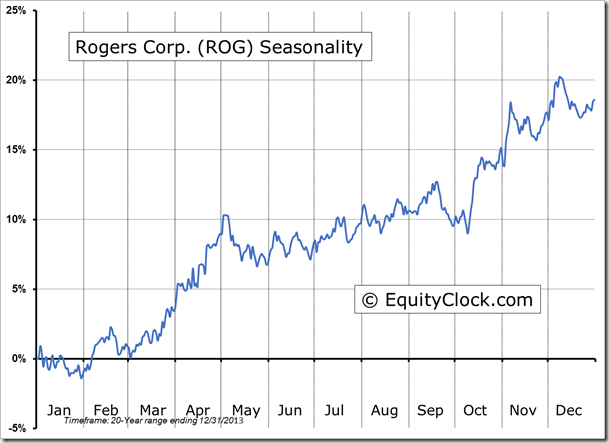
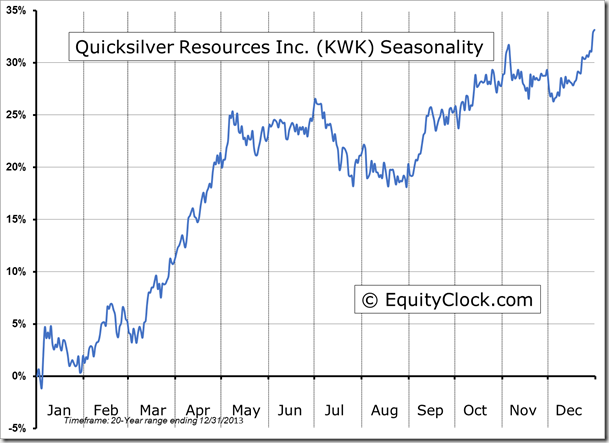
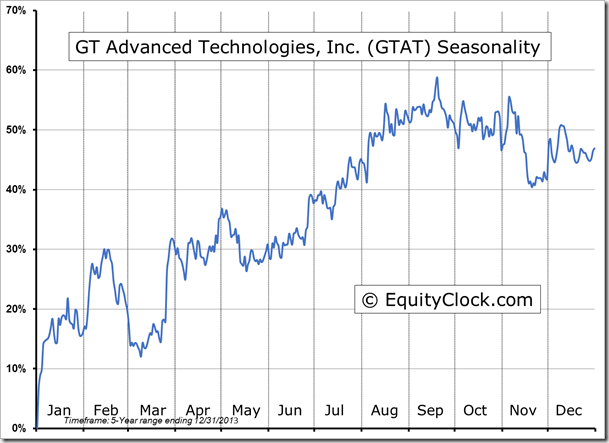
Seasonal charts of companies reporting earning today:
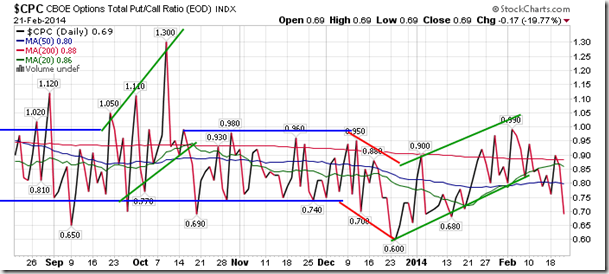
Sentiment on Friday as gauged by the put-call ratio, ended overly bullish at 0.69.
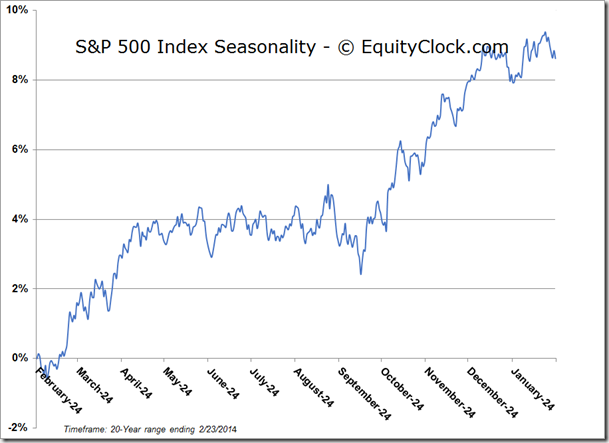
S&P 500 Index
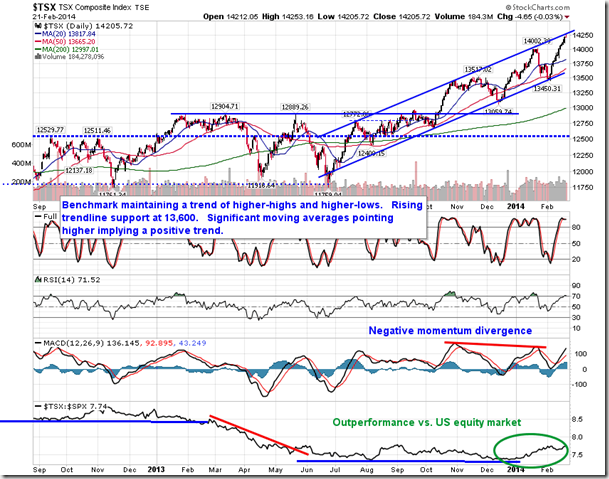
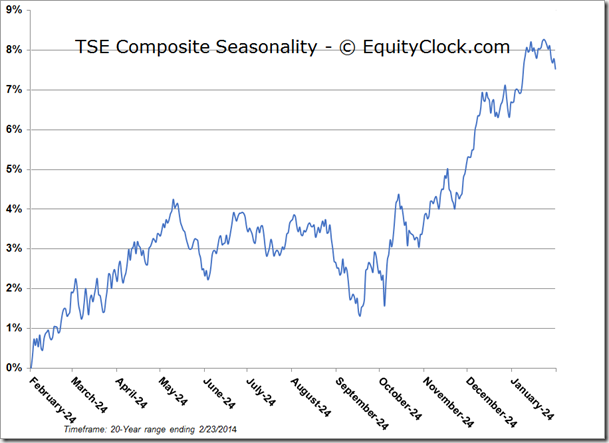
TSE Composite
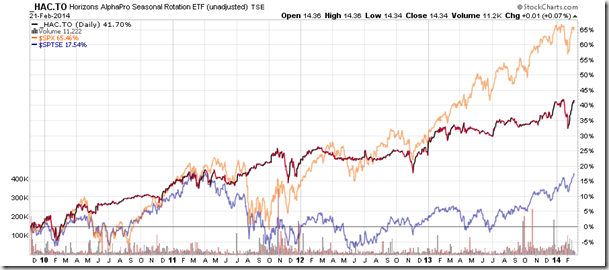
Horizons Seasonal Rotation ETF (TSX:HAC)
- Closing Market Value: $14.34 (up 0.07%)
- Closing NAV/Unit: $14.33 (down 0.03%)
Performance*
| 2014 Year-to-Date | Since Inception (Nov 19, 2009) | |
| HAC.TO | 0.21% | 43.3% |
* performance calculated on Closing NAV/Unit as provided by custodian