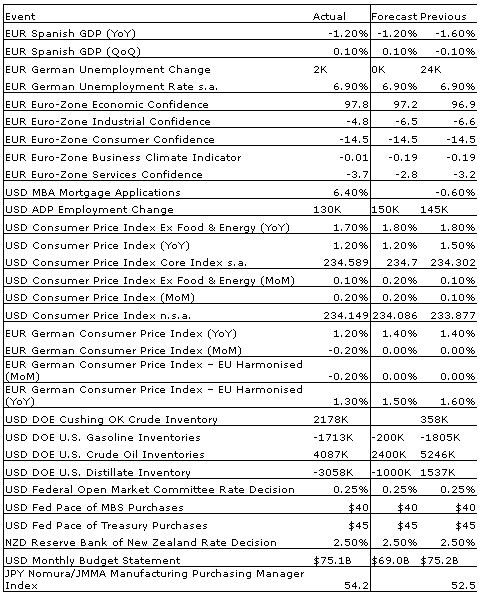
Upcoming US Events for Today:
- Weekly Jobless Claims will be released at 8:30am. The market expects Initial Claims to show 335K versus 350K previous.
- Chicago PMI for October will be released at 9:45am. The market expects 55.0 versus 55.7 previous.
Upcoming International Events for Today:
- Great Britain Nationwide House Price Index for October will be released at 3:00am EST. The market expects a year-over-year increase of 5.1% versus an increase of 5.0% previous.
- German Retail Sales for September will be released at 3:00am EST. The market expects a year-over-year increase of 0.9% versus an increase of 0.3% previous.
- Euro-Zone Unemployment Rate for September will be released at 6:00am EST. The market expects no change at 12.0%.
- Euro-Zone CPI for October will be released at 6:00am EST. The market expects a year-over-year increase of 1.1%, consistent with the previous report.
- Canadian Gross Domestic Product for August will be released at 8:30am EST. The market expects a year-over-year increase of 1.7% versus an increase of 1.4% previous.
- China Manufacturing PMI for October will be released at 9:00pm EST. The market expects 51.2 versus 51.1 previous.
- China HSBC Manufacturing PMI for October will be released at 9:45am EST. The market expects 50.7 versus 50.2 previous.
The Markets
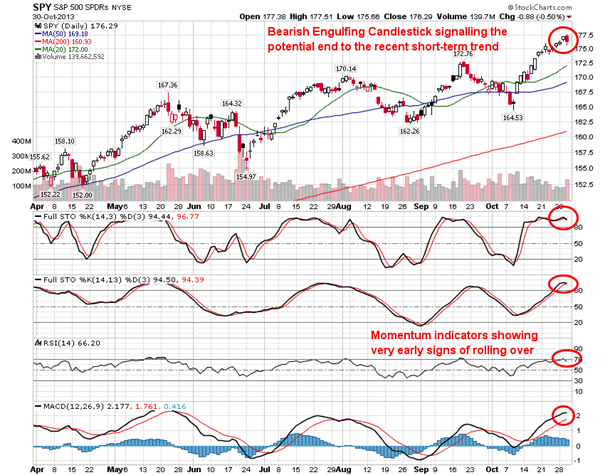
Stocks finished lower on Wednesday, despite the Fed maintaining current simulative policies given the uncertainties surrounding recent fiscal policies and ongoing softness in employment data. As a result of the losses on the session, the S&P 500 ETF (SPY) charted a bearish engulfing candle following a higher open than yesterday’s high and a lower close than yesterday’s low. Candle formations such as this are typically indicate a peak in the short-term trend. Momentum indicators are showing very early signs of rolling over as investors book profits from the substantial rally that pushed equity indices into overbought territory. Significant moving averages, such as the 20, 50, and 200 day, continue to point higher, suggesting a positive trend over a short, intermediate and long-term scale; a trend of higher-highs and higher lows remain apparent across a number of indices, suggesting that any pullback from present levels is likely to be shallow. First level of support is expected around the recently broken trendline resistance for the S&P 500 at 1750 with more substantial support expected closer to the 20-day moving average, presently at 1720.
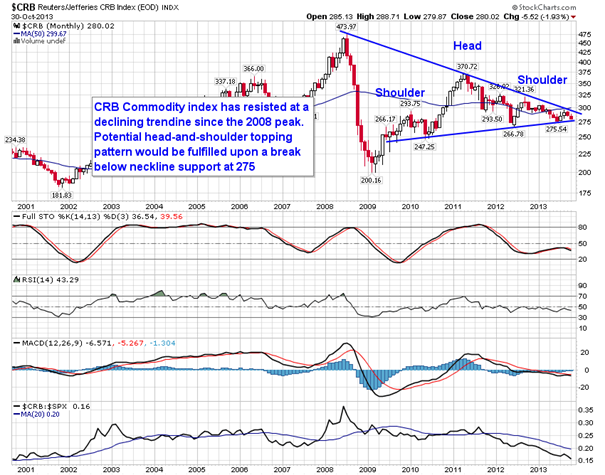
Despite equity markets trading at all time highs, having fully recovered from the 2008/2009 downturn, commodities have been stuck in a rut since the 2008 peak. The CRB commodity index has struggled at a declining trendline for over five years and now a bearish setup for further downside is becoming apparent. A potential head-and-shoulders topping pattern following the rebound from the 2009 low is showing up on the chart with the neckline at 275. Should neckline support be broken, points of support below are very few and far between suggesting a potential test of the 2009 low. On the flipside, a breakout above resistance just below 300 could suggest an end to the negative long term trend for the commodity benchmark. Commodities, from a broad perspective, are seasonally weak into the end of the year, placing the bias towards a downside break rather than a more optimistic outcome. Trends turn positive into the new year.
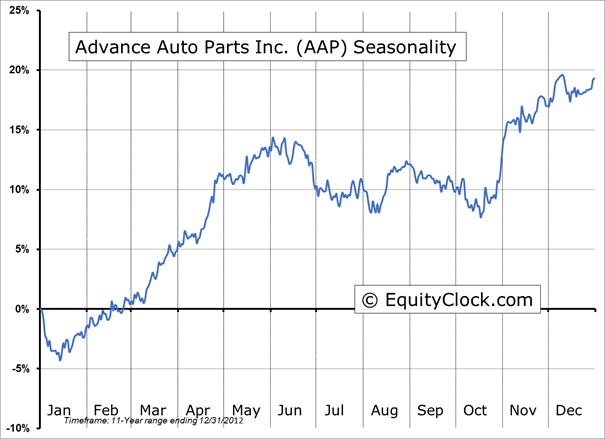
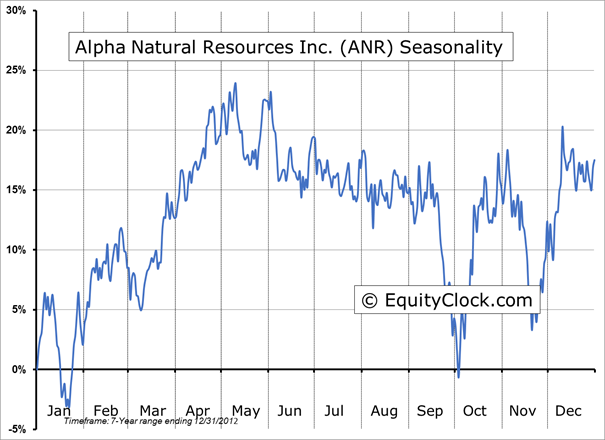
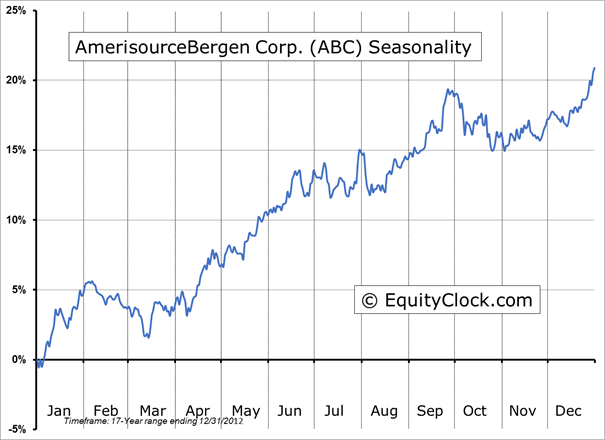
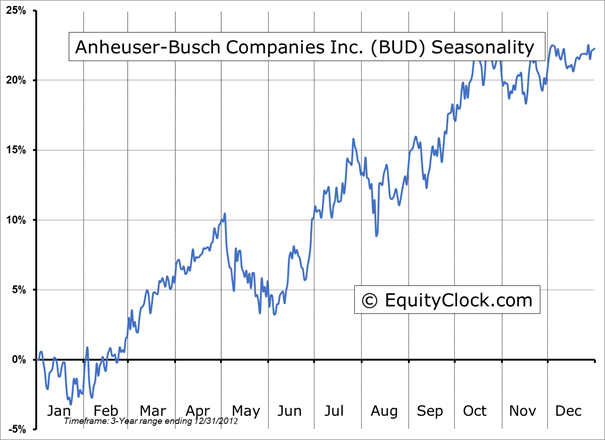
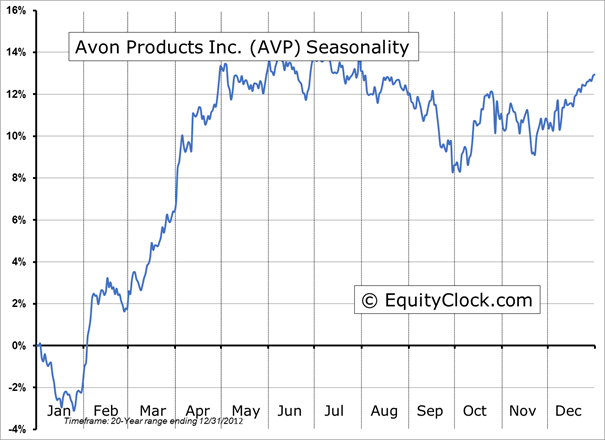
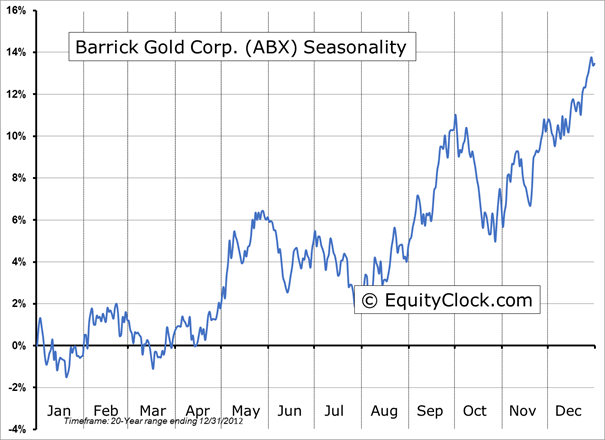
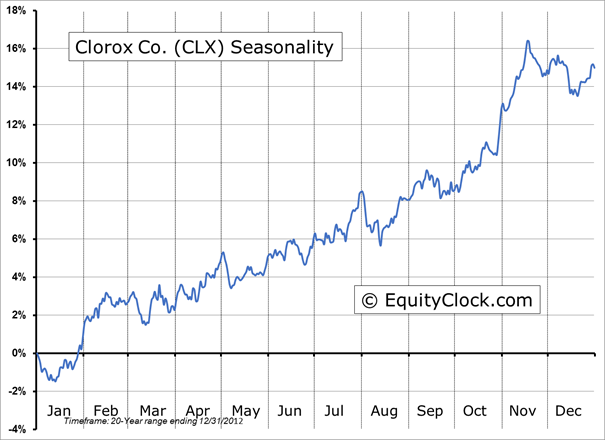
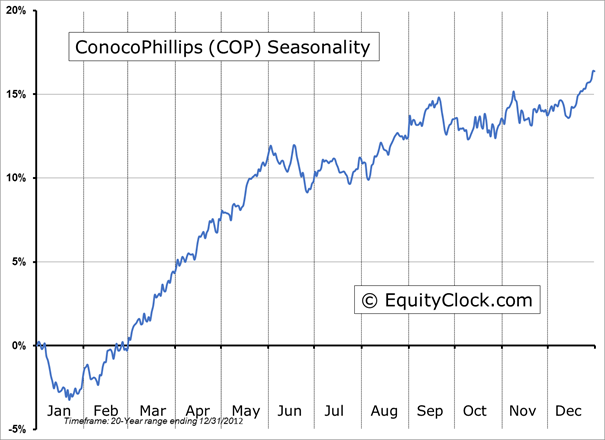
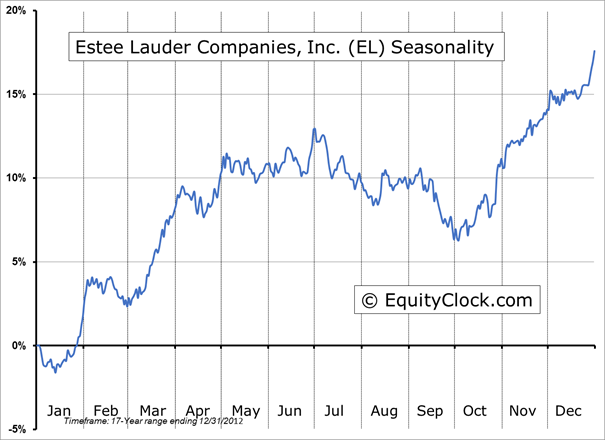
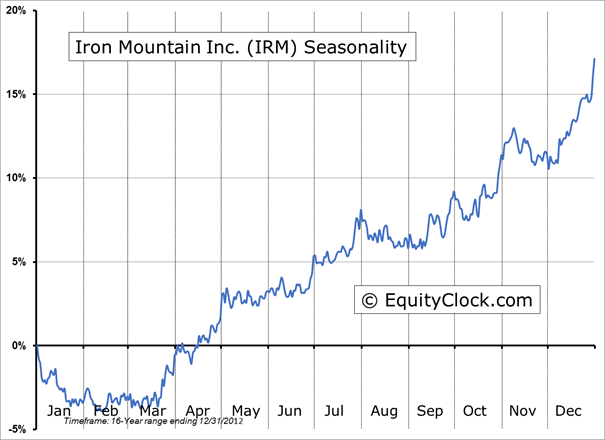
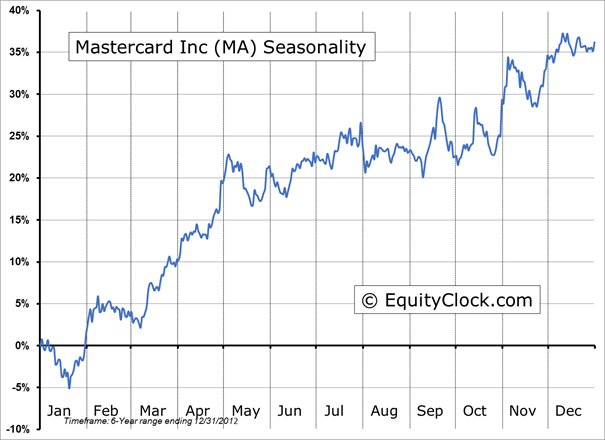
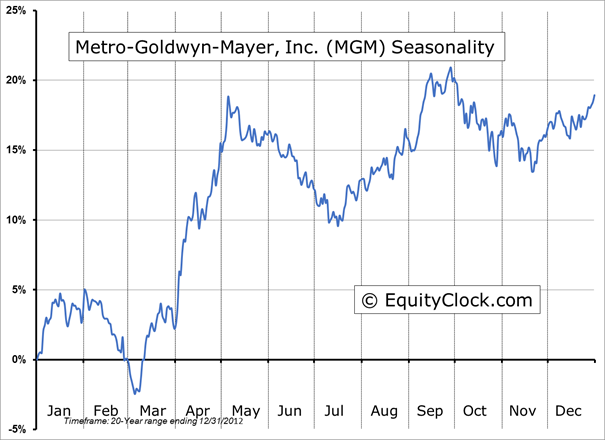
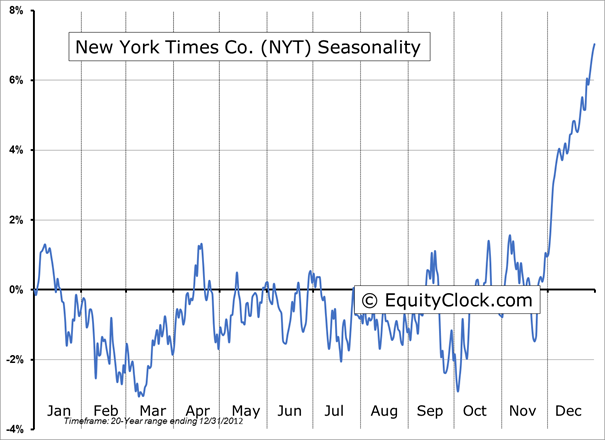
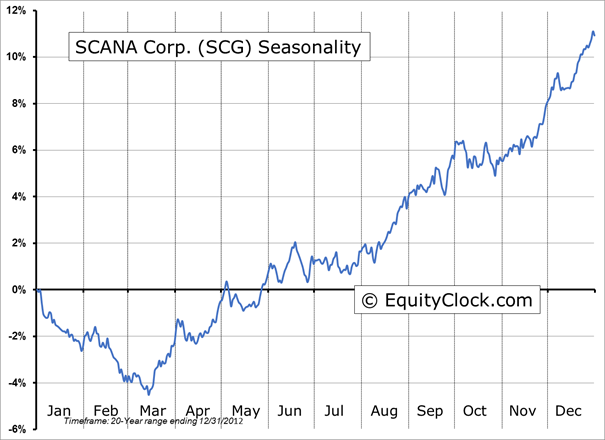
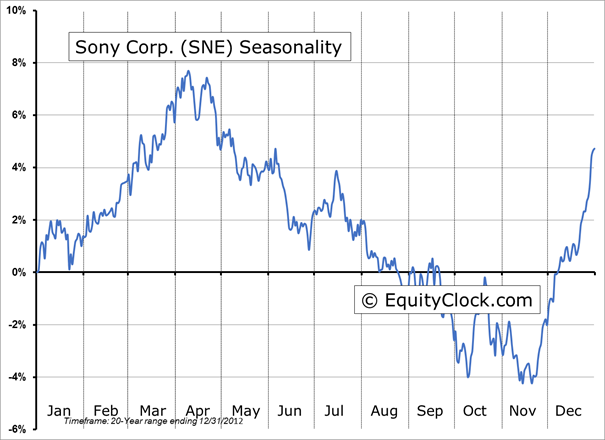
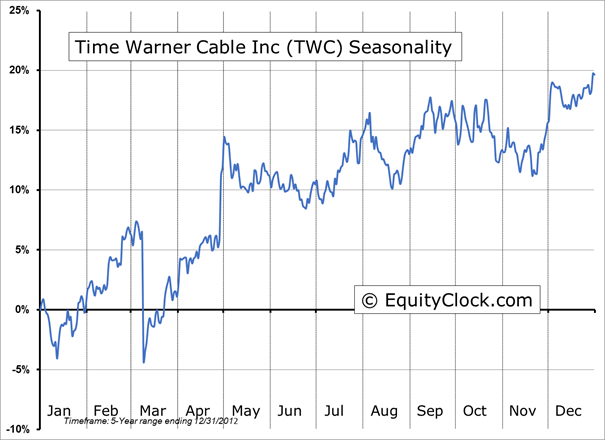
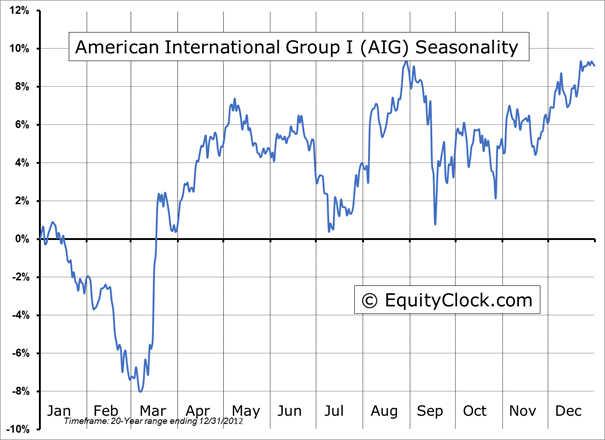
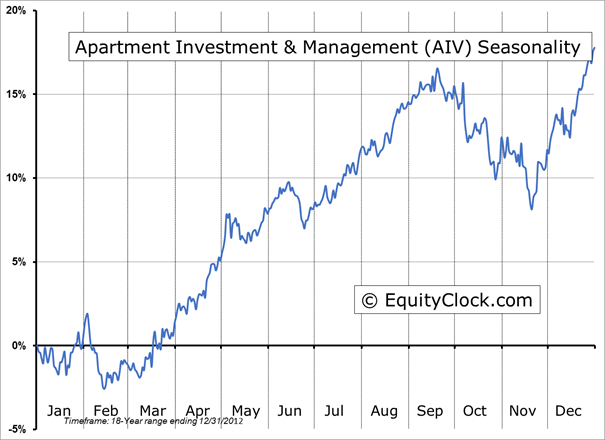
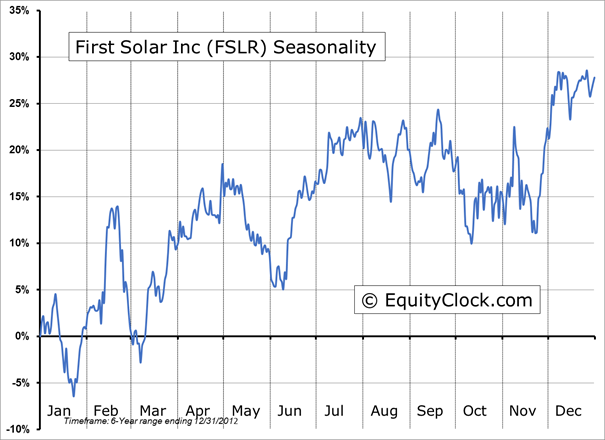
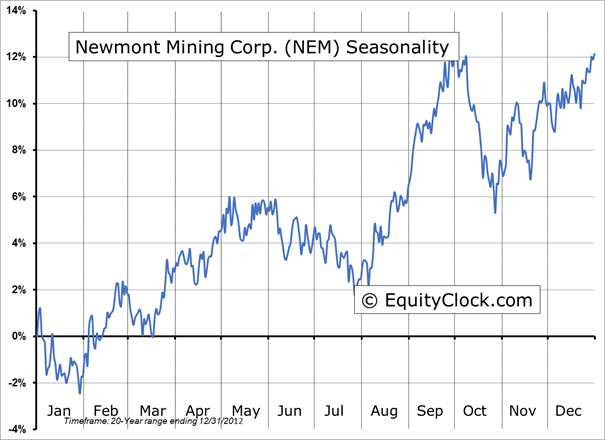
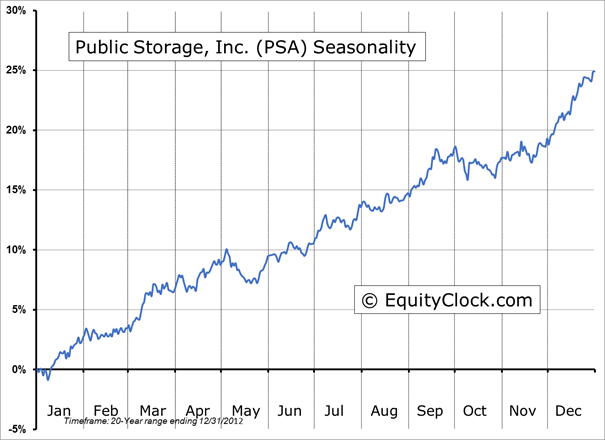
Seasonal charts of companies reporting earnings today:
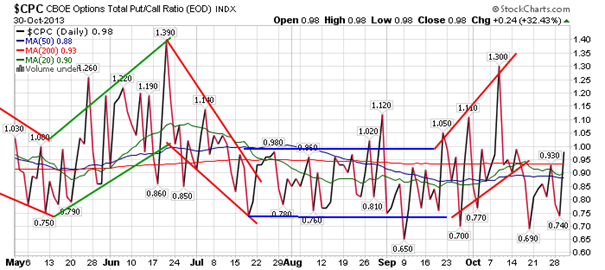
Sentiment on Wednesday, a gauged by the put-call ratio, ended close to neutral at 0.98.
S&P 500 Index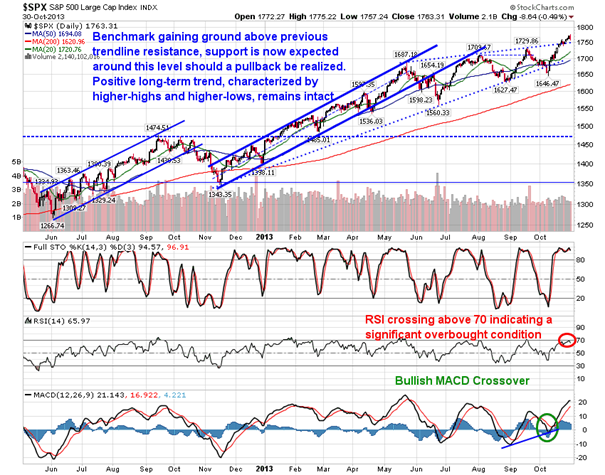
TSE Composite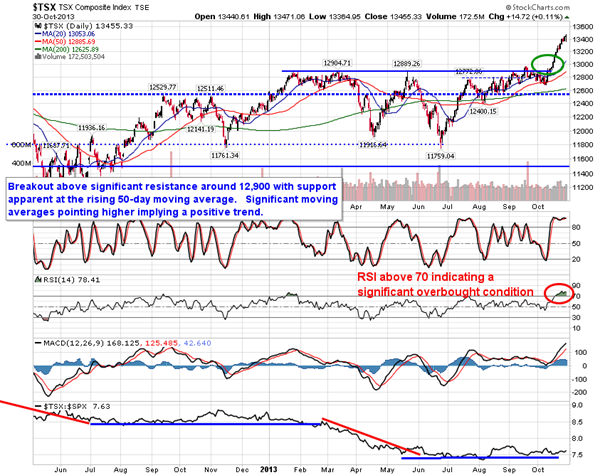
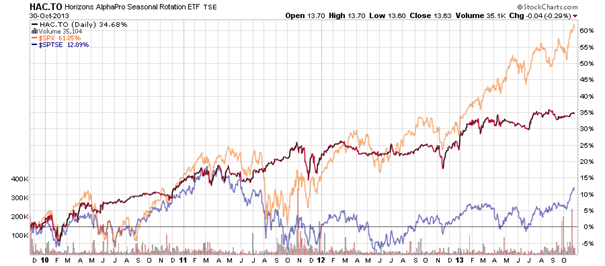
Horizons Seasonal Rotation ETF (TSX:HAC)
- Closing Market Value: $13.63 (down 0.29%)
- Closing NAV/Unit: $13.63 (down 0.19%)
Performance*
* performance calculated on Closing NAV/Unit as provided by custodian 