Upcoming US Events for Today:
- The Employment Situation Report for September will be released at 8:30am. The market expects Non-farm Payrolls to increase by 185,000 versus 169,000 previous. Private Payrolls are expected to increase by 184,000 versus 152,000 previous. The Unemployment Rate is expected to remain unchanged at 7.3%.
- Construction Spending for August will be released at 10:00am. The market expects a month-over-month increase of 0.4% versus 0.6% previous.
Upcoming International Events for Today:
- Canadian Retail Sales for August will be released at 8:30am EST. The market expects a month-over-month increase of 0.3% versus an increase of 0.6% previous.

The Markets
Stocks traded around the flat-line on Monday as investors await the much delayed monthly employment report for September. Yet, despite the apparent caution, the tone of the session was fairly bullish with Technology, Consumer Discretionary, and Industrials posting marginal gains on the day while defensive sectors (Consumer Staples, Utilities, and Health Care) all declined. With equity benchmarks at or near overbought levels, traders are looking for a reason to take down market indices by a couple of percentage points. Economic data is increasingly missing expectations as of recent, as indicated by the Citigroup Economic Surprise Index, which could provide reason for a pullback in stocks should data continue to disappoint. Earnings season picks up over the next three days with 104 companies reporting on Tuesday, 161 on Wednesday, and 279 on Thursday; reaction to results have a high likelihood of setting the near-term trend for the market as the average seasonal start date for the best six months of the year nears.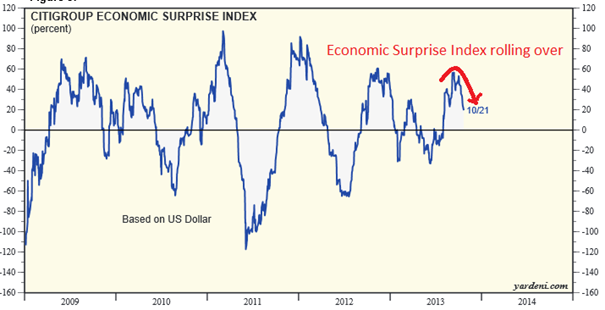
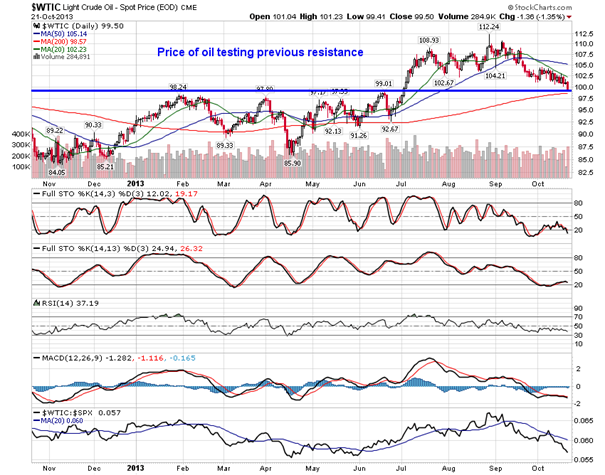
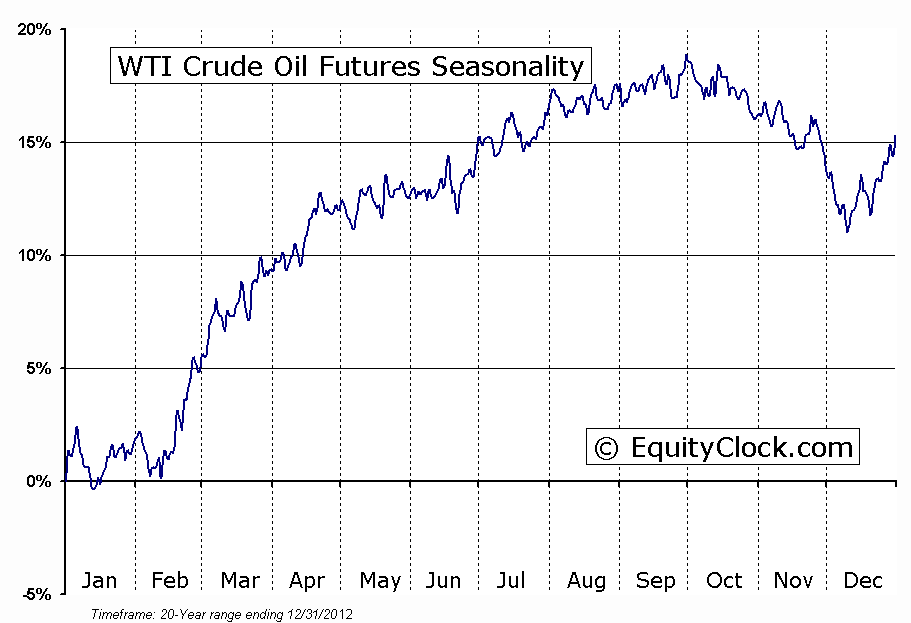
Perhaps the notable trading activity on Monday was the dip in the price of Crude Oil. A greater than expected build in inventories influenced the energy commodity lower, pushing the price below $100 for the first time since the Spring. Resistance during the first half of the year around $99 may now act as short-term support; resistance remains apparent at the 20-day moving average. Momentum indicators continue trend negative and both the 20 and 50-day moving averages are pointing lower, suggesting a negative trend over short and intermediate timescales. Seasonal tendencies for Oil coming off of the summer driving season are typically negative for the price of Oil through to the start of December.
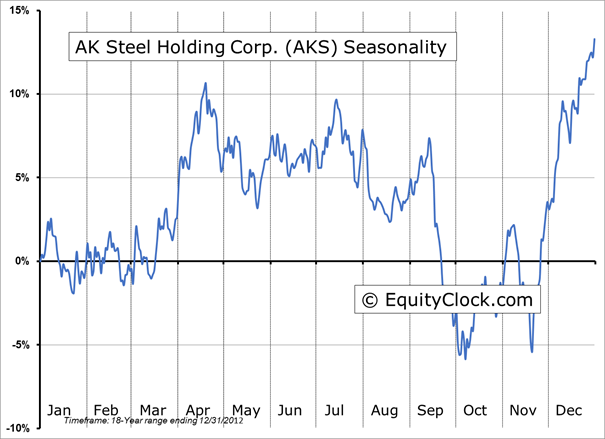
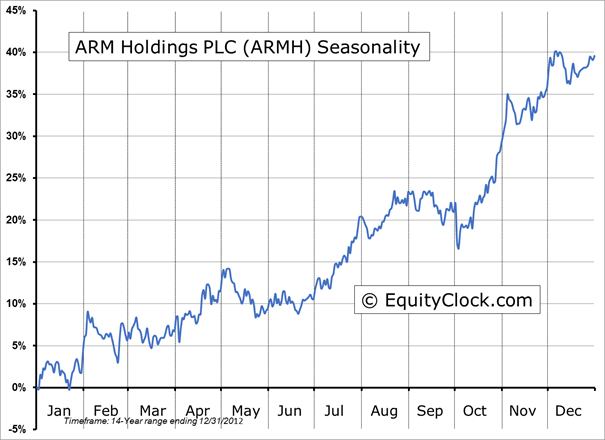
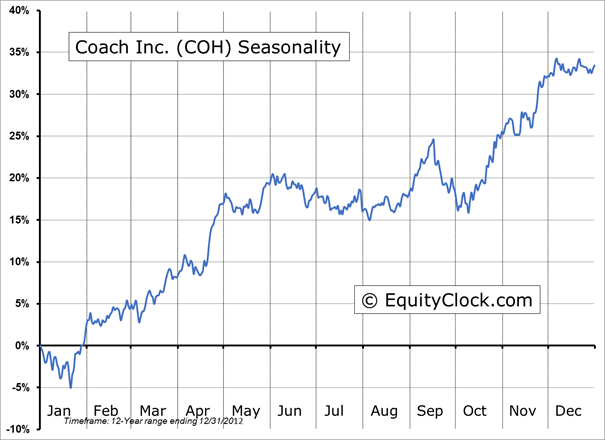
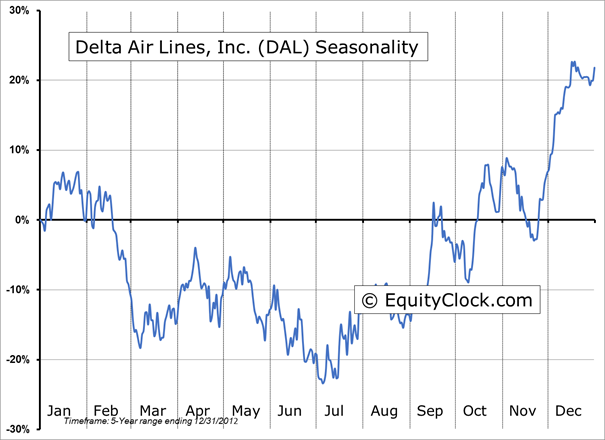
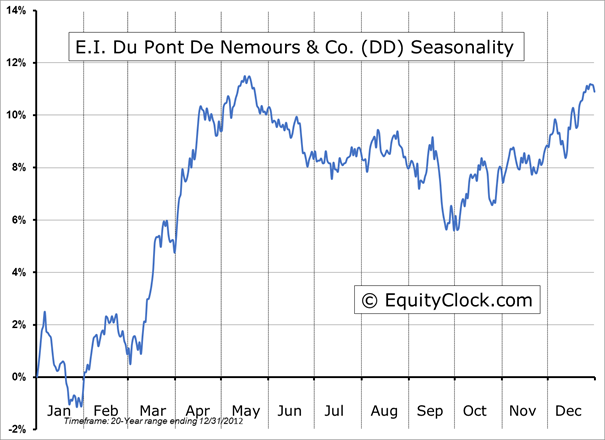
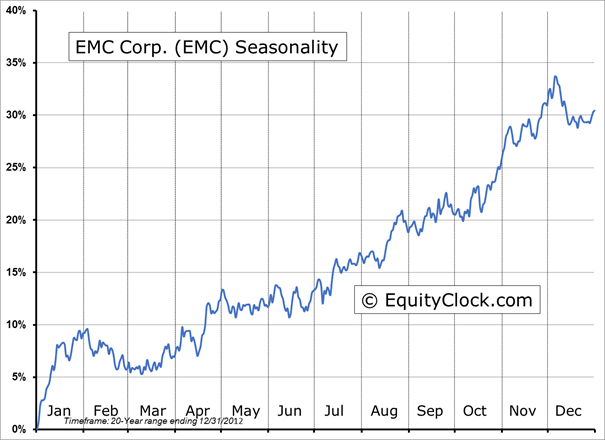
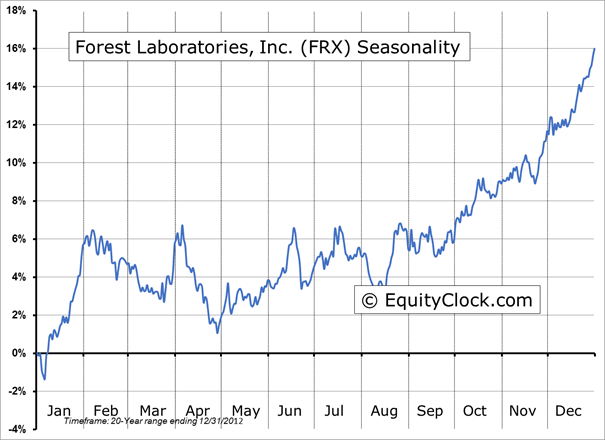
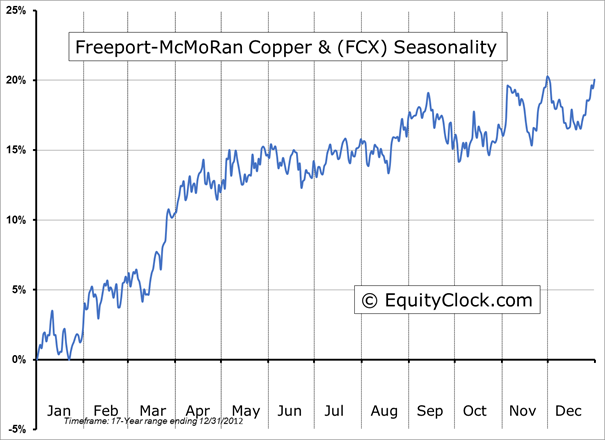
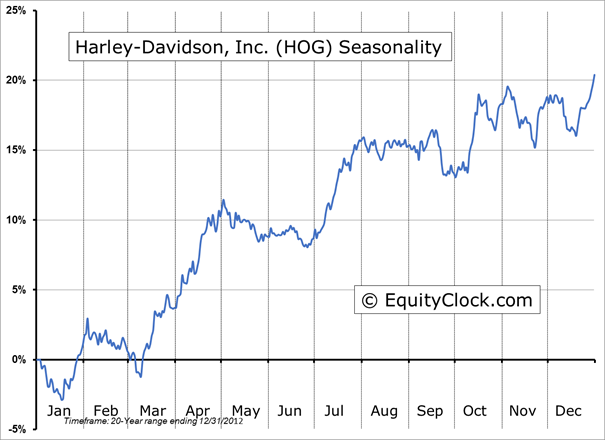
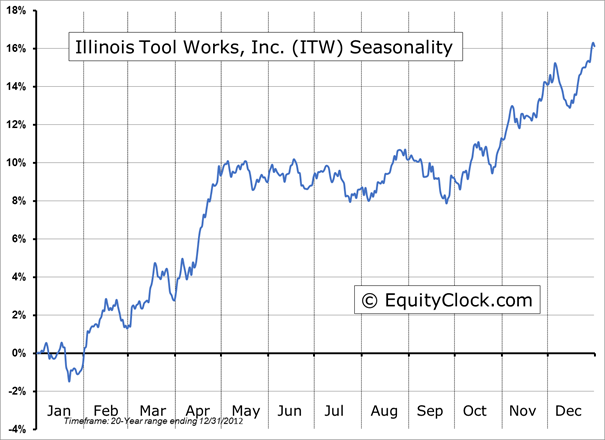
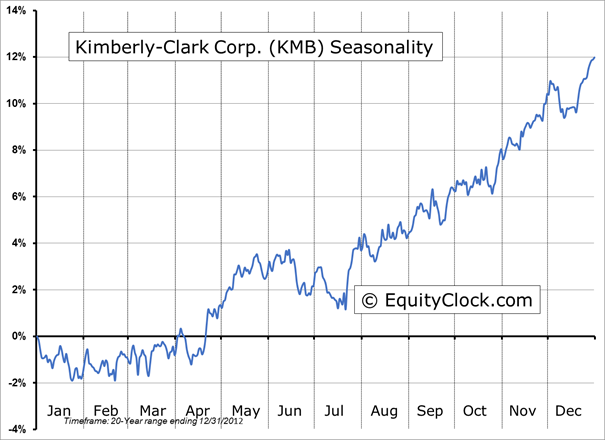
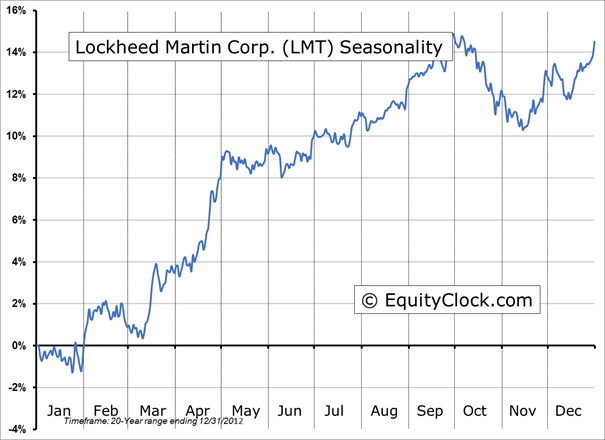
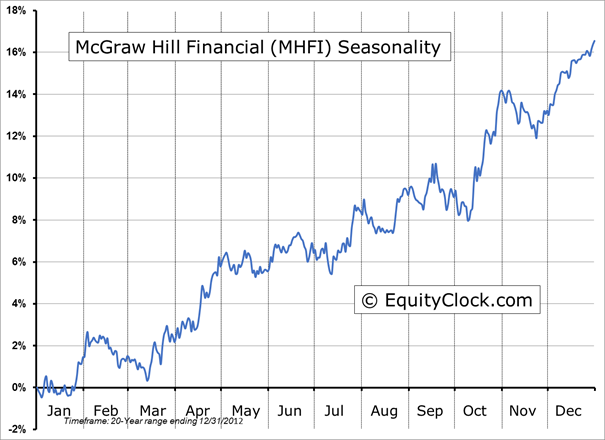
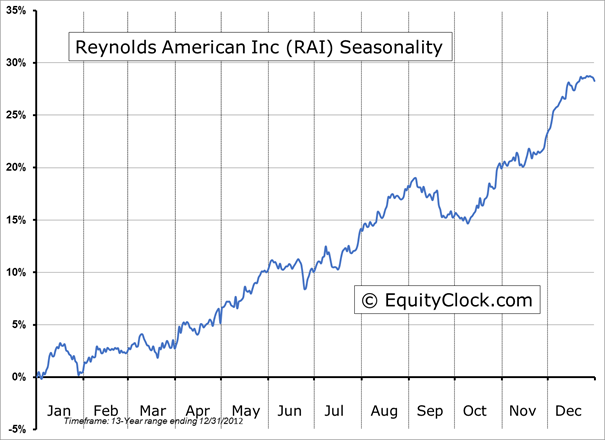
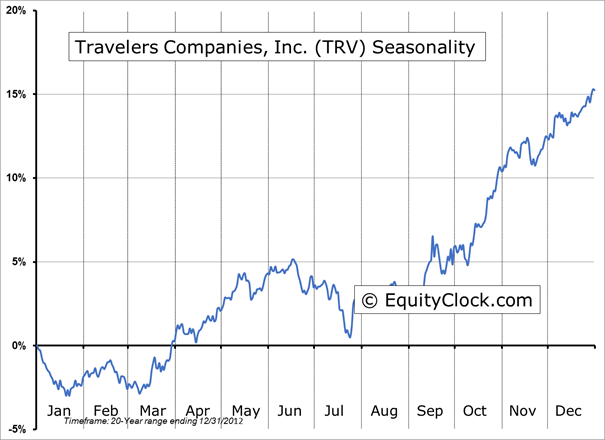
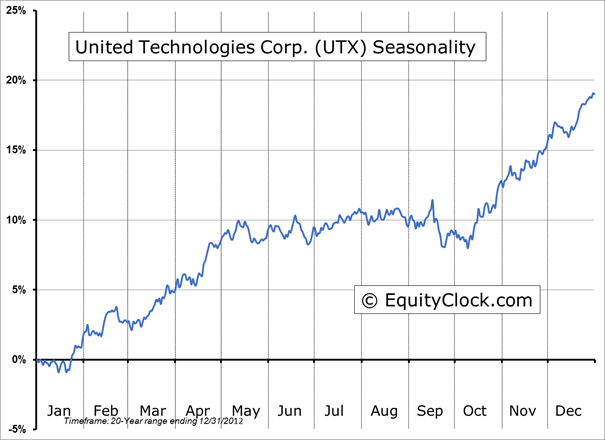
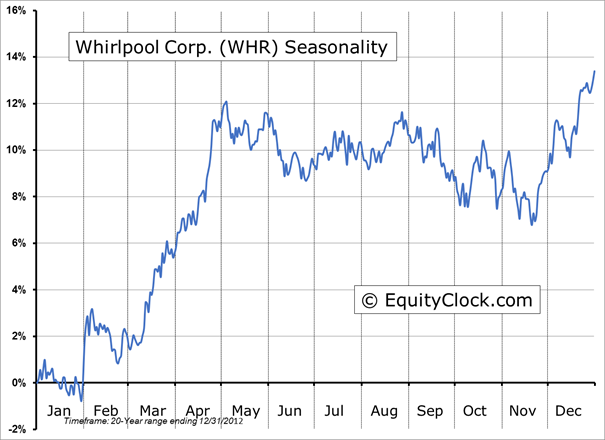
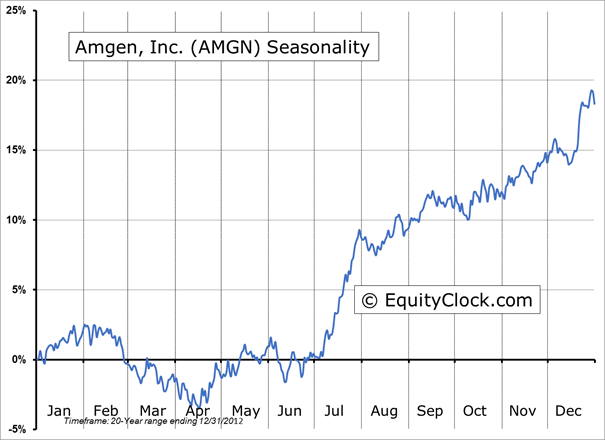
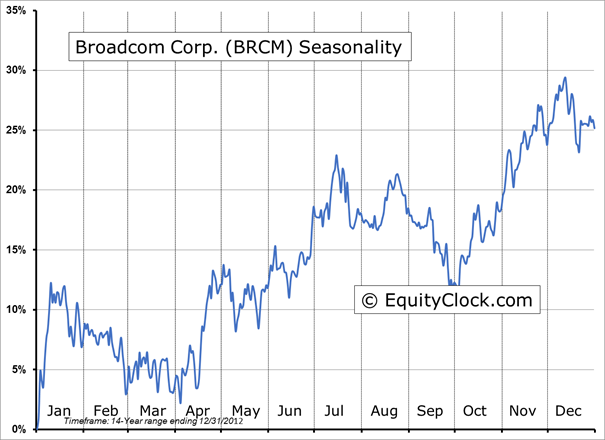
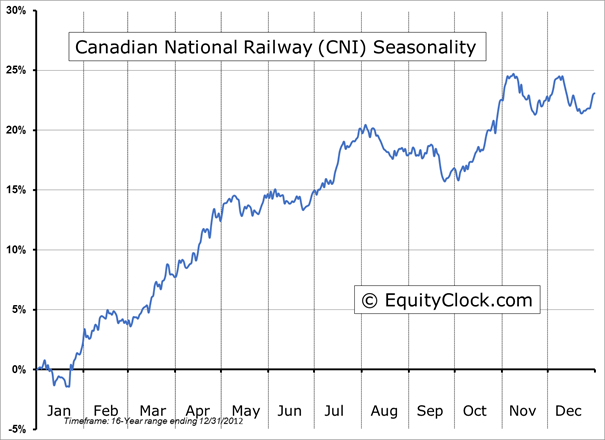
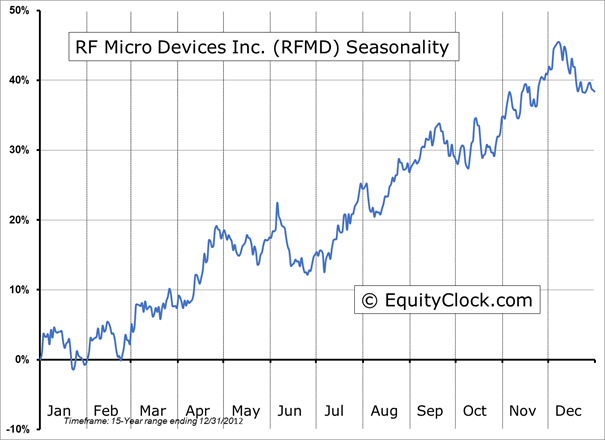
Seasonal charts of companies reporting earnings today:
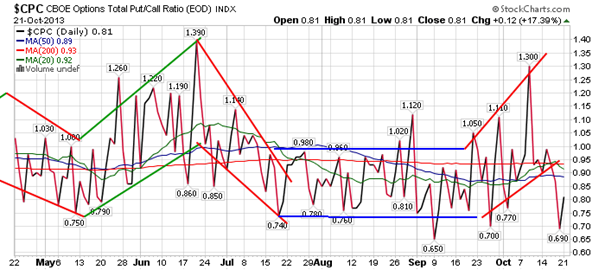
Sentiment on Monday, as gauged by the put-call ratio, ended bullish at 0.81.
S&P 500 Index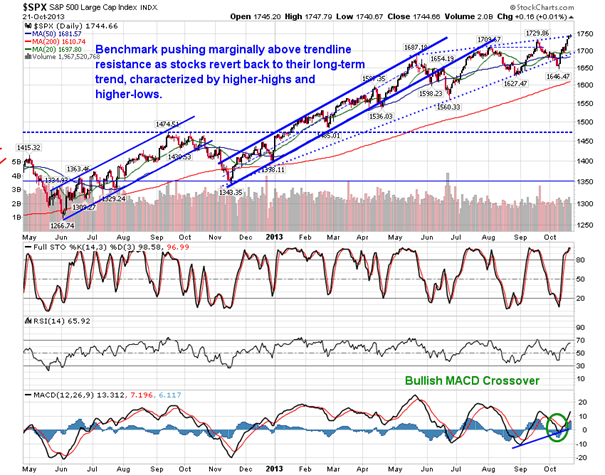
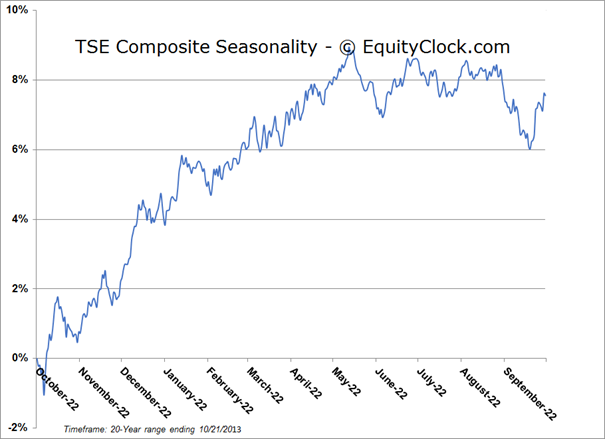
TSE Composite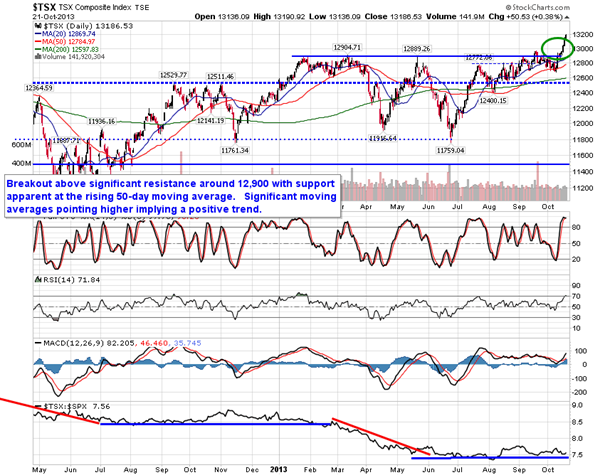
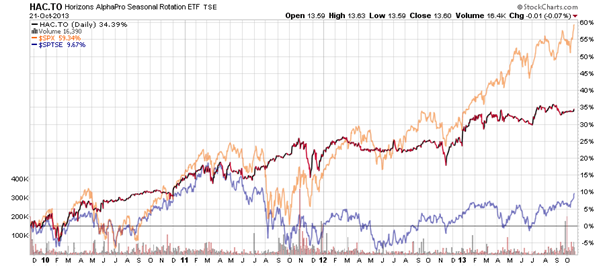
Horizons Seasonal Rotation ETF (TSX:HAC)
- Closing Market Value: $13.60 (down 0.07%)
- Closing NAV/Unit: $13.60 (up 0.09%)
Performance*
* performance calculated on Closing NAV/Unit as provided by custodian