Upcoming US Events for Today:
- Motor Vehicle Sales for September will be released throughout the day. Total Vehicle Sales are expected to show 15.5M versus 16.1M previous.
- PMI Manufacturing for September will be released at 8:58am. The market expects 52.9 versus 53.1 previous.
- ISM Manufacturing Index for September will be released at 10:00am.The market expects 55.0 versus 55.7 previous.
- Construction Spending for August will be released at 10:00am. The market expects a month-over-month increase of 0.4% versus an increase of 0.6% previous.
Upcoming International Events for Today:
- Bank of Australia Rate Decision will be released at 12:30am EST. The market expects no change at 2.50%.
- German Unemployment Rate for September will be released at 3:55am EST. The market expects 6.8%, unchanged from the previous report. Unemployment is expected to decline by 5,000 versus an increase of 7,000 previous.
- German PMI Manufacturing for September will be released at 3:55am EST. The market expects 51.3 versus 51.8 previous.
- Eurozone PMI Manufacturing for September will be released at 4:00am EST. The market expects 51.1 versus 51.4 previous.
- Great Britain PMI Manufacturing for September will be released at 4:30am EST. The market expects 57.7 versus 57.2 previous.
- Eurozone Unemployment Rate for August will be released at 5:00am EST. The market expects 12.1%, unchanged from the previous report.

The Markets
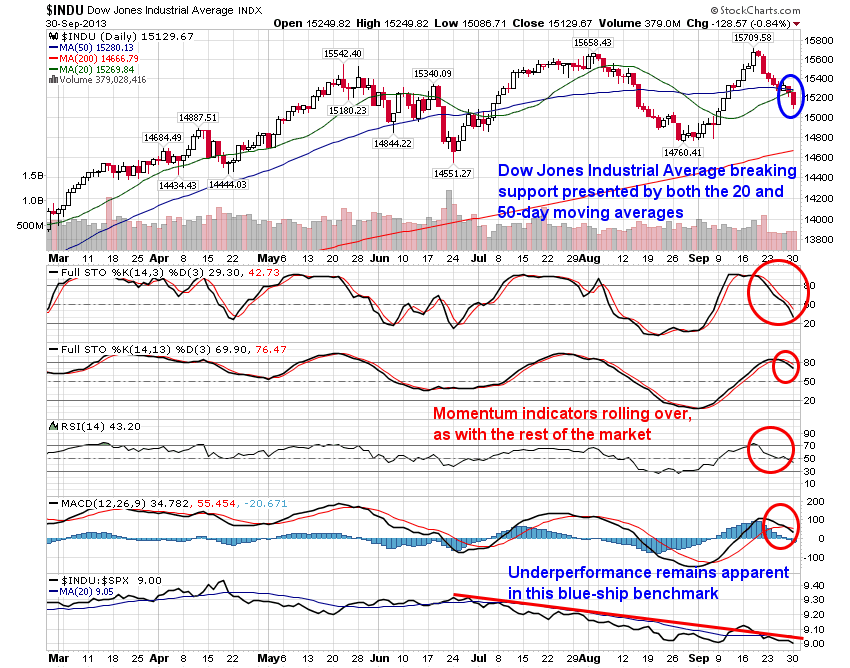
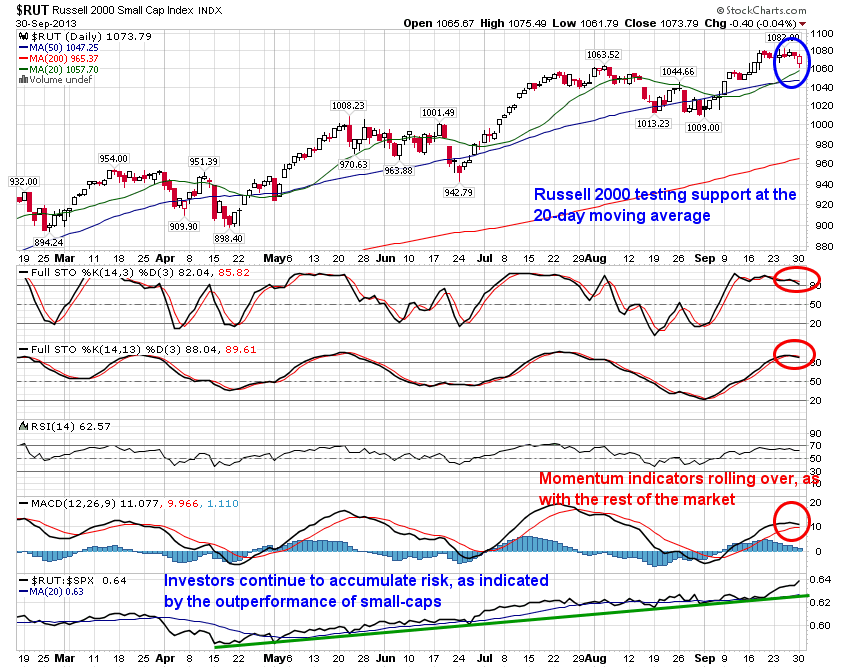
Stocks dipped on Monday as investors cut portfolio positions given the increased likelihood of a government shutdown in the US. The impact was felt to a greater extent within the Dow Jones Industrial Average, which fell around eight-tenths of a percent on the day. The Russell 2000 Small Cap index, which arguably has greater domestic exposure than international,large cap benchmarks, barely budged, declining only four basis points on the session. Outperformance in the small-cap index remains apparent as investors maintain a "risk-on" stance, looking past short-term hurdles, such as the government shutdown, and instead looking at some of the strong economic numbers reported in recent months.
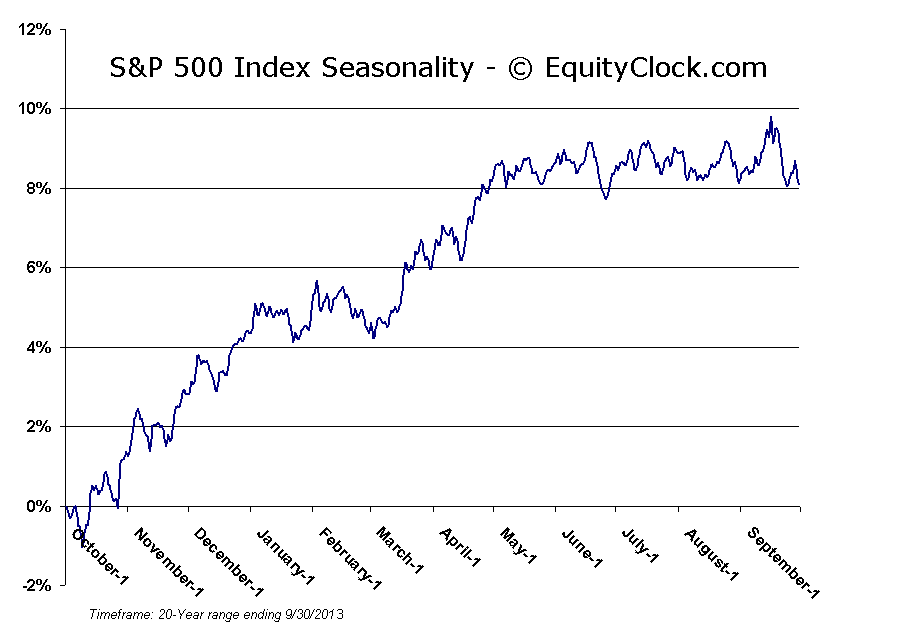
Monday brought an end to the month of September and the third quarter of the year, both of which were unseasonably strong for stocks. Despite all of the uncertainties, the S&P 500 ended higher by 2.97% for the month of September and 4.69% for the quarter over a timeframe when flat to negative returns are the norm. Unseasonably strong manufacturing and employment data, accommodative monetary policy, and a simple lack of alternatives (other than stocks) led to the increase in stock prices during this typically weak period for equity markets. Looking forward, seasonal tendencies turn positive for stocks into the fourth quarter as volatility subsides and fundamental catalysts lift stocks into year-end. Average gain for the S&P 500 (based on data from the past 20 years) in the fourth quarter is 4.5%, which includes a 1.6% average gain during the month of October. Despite average gains during the month of October, volatility typically persists through to the end of the month, which then begins the seasonally strong six months of the year for stocks. An interesting way to gauge the peak in volatility was provided in yesterday’s report, but it seems likely that it will not come until the US budget impasse is resolved and the debt limit is raised, ending the political brinksmanship that is holding equity markets hostage.
Average Returns for the S&P 500 Index:
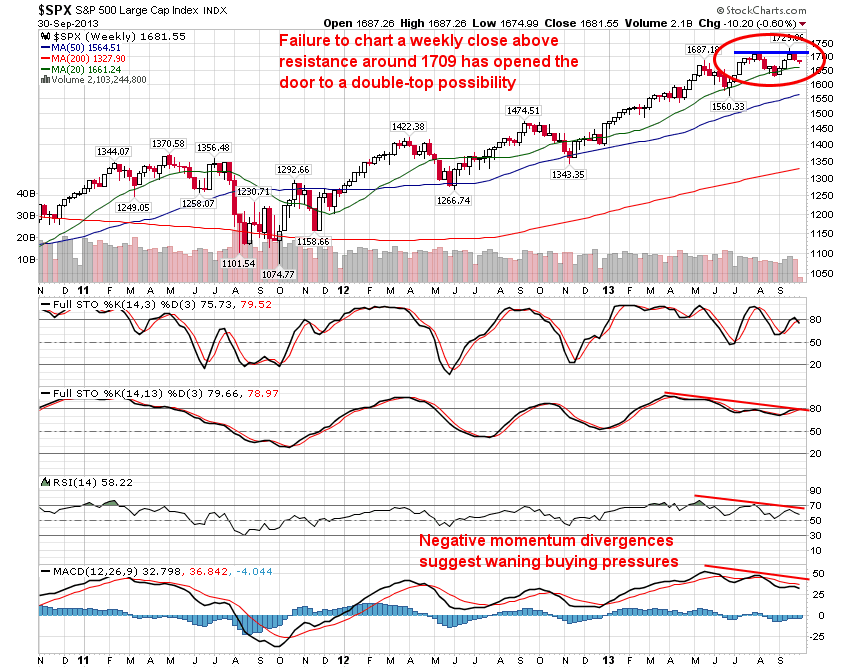
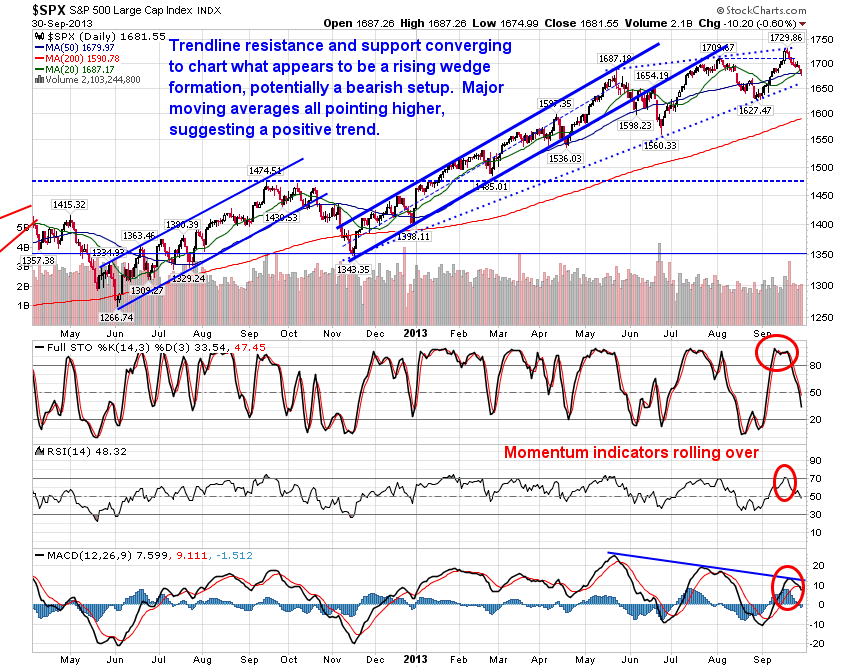
Looking at the weekly chart of the S&P 500, the breakout to new all-time highs that was recorded on the daily chart remains unconfirmed on the weekly. The large cap benchmark failed to chart a weekly close above resistance around $1709 and now double top can be implied. Momentum indicators have been negatively diverging from price since May, suggesting waning buying pressures. Some kind of market pullback seems inevitable. Support on the weekly chart can be found around $1627, a break of which could see a swift test of the 50-week moving average at $1565. The rising 50-week moving average has provided support to the long-term trend on two other occasions, therefore equity market weakness down to this level would provide appealing buying opportunities. The 20, 50, and 200-week moving averages continue to point higher, implying a positive trend across multiple timescales.
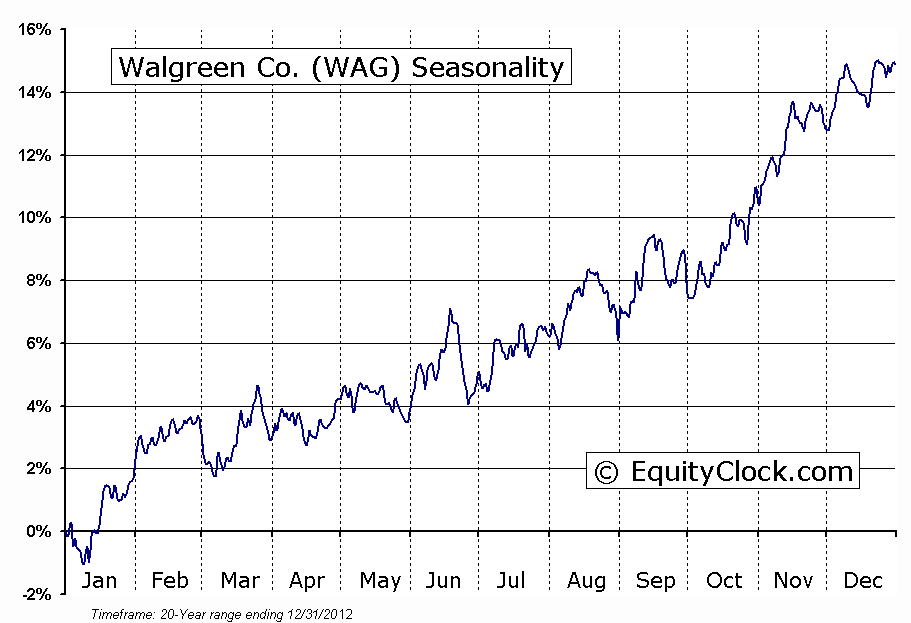
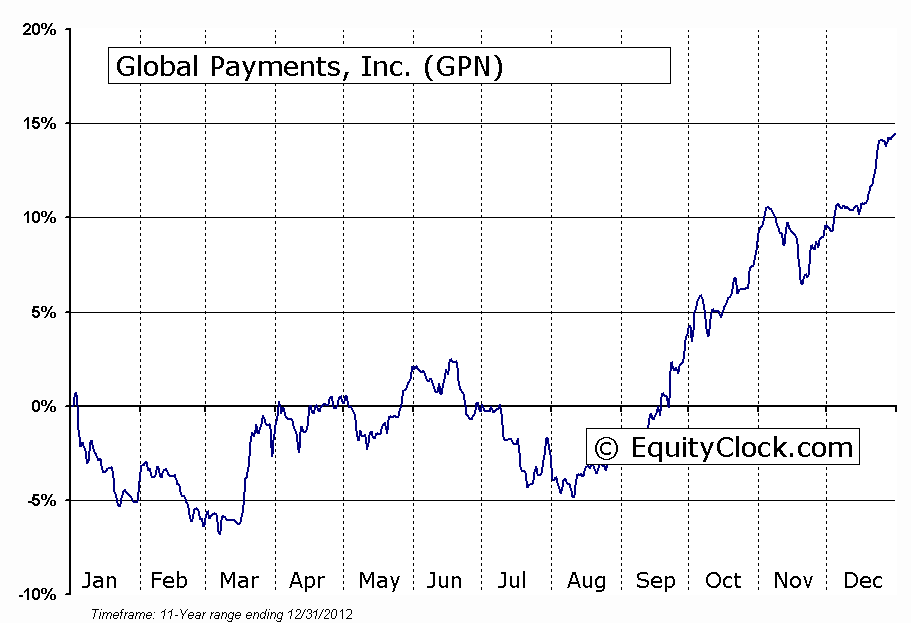
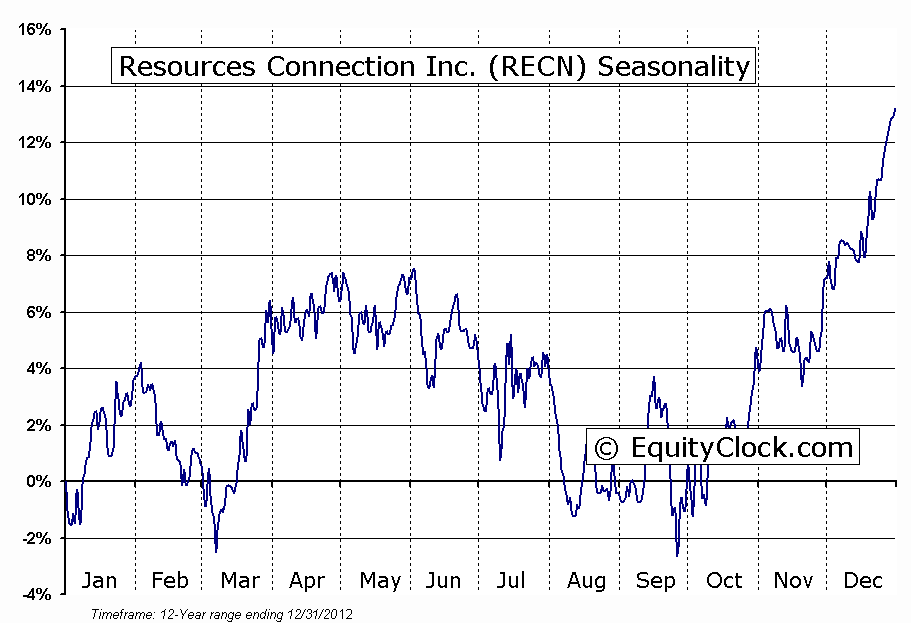
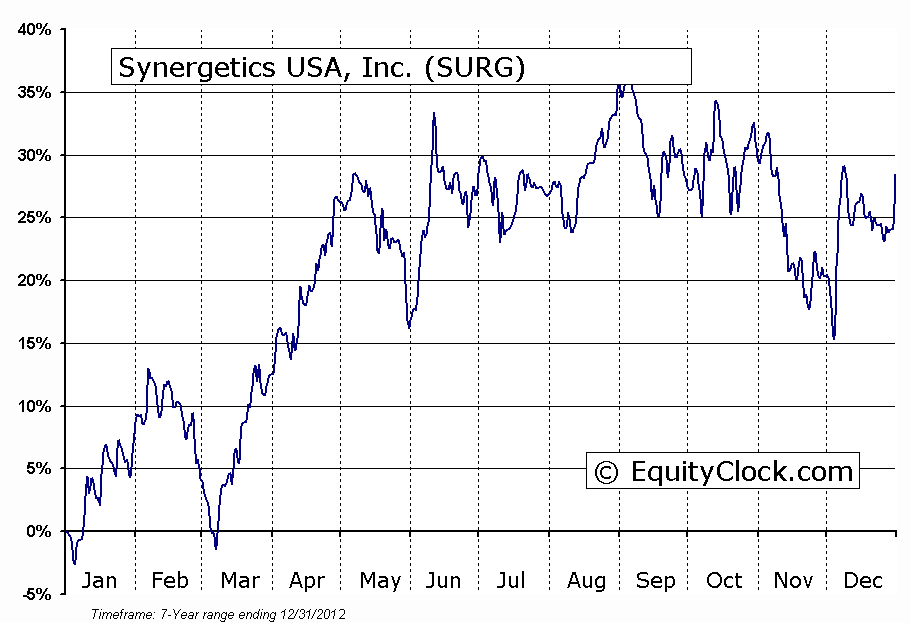
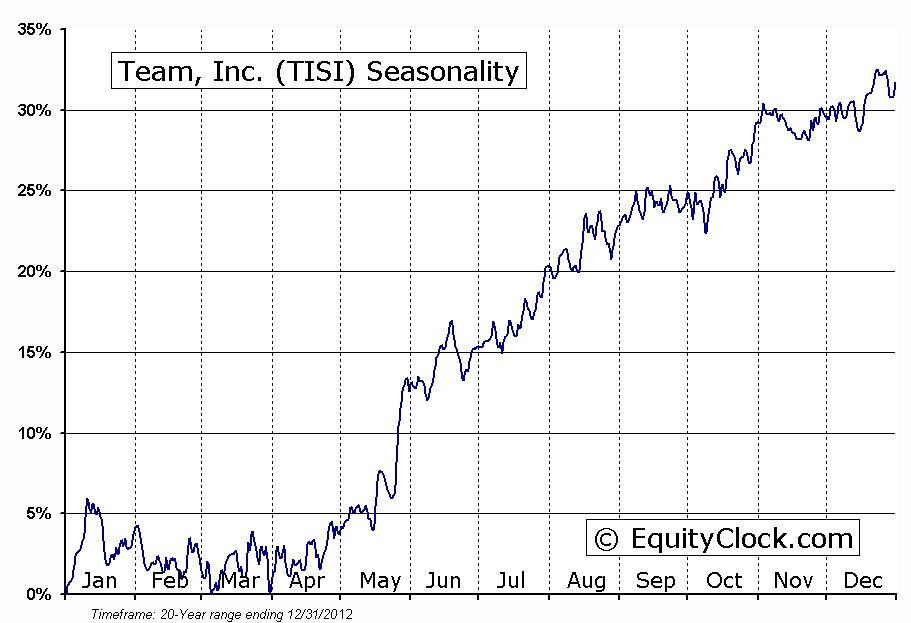
Seasonal charts of companies reporting earnings today: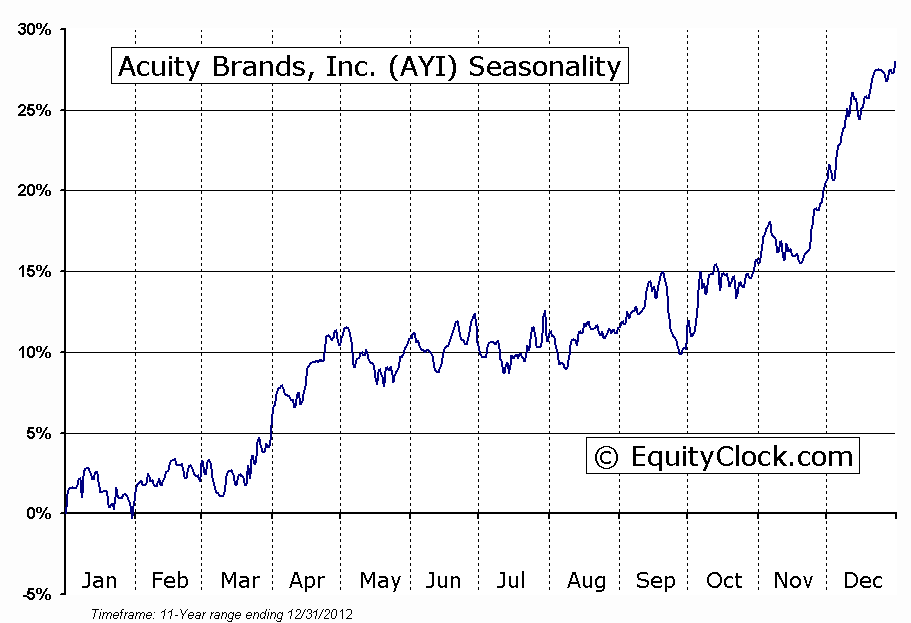
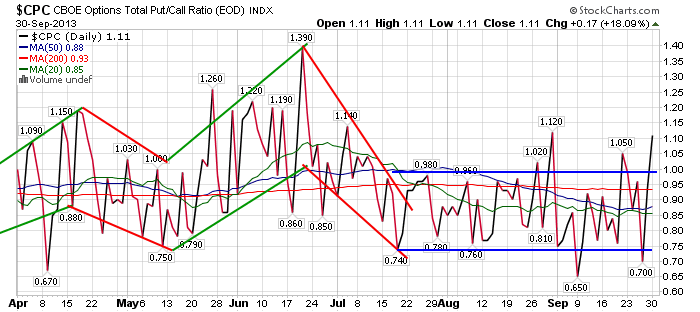
Sentiment on Monday, as gauged by the put-call ratio, ended bearish at 1.11.
S&P 500 Index
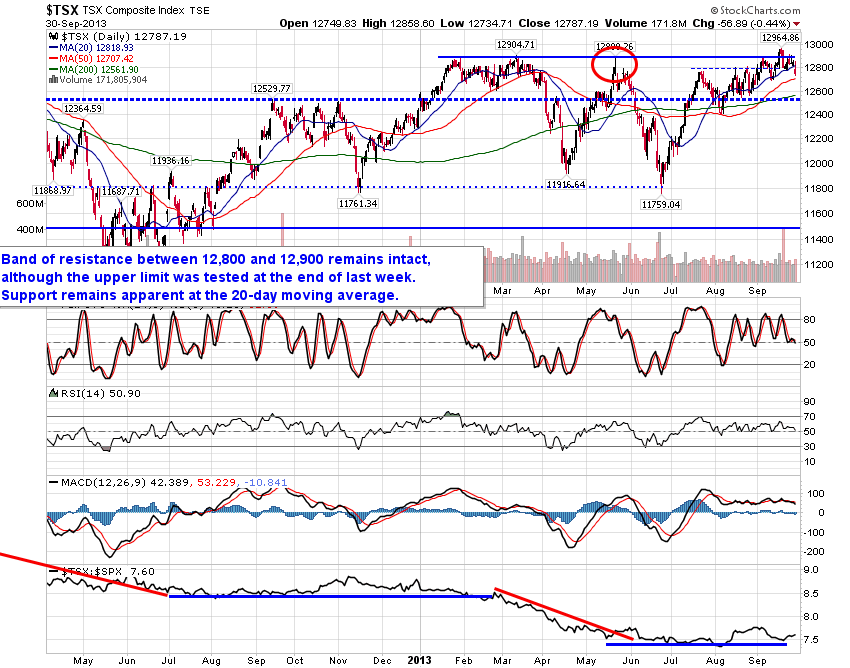
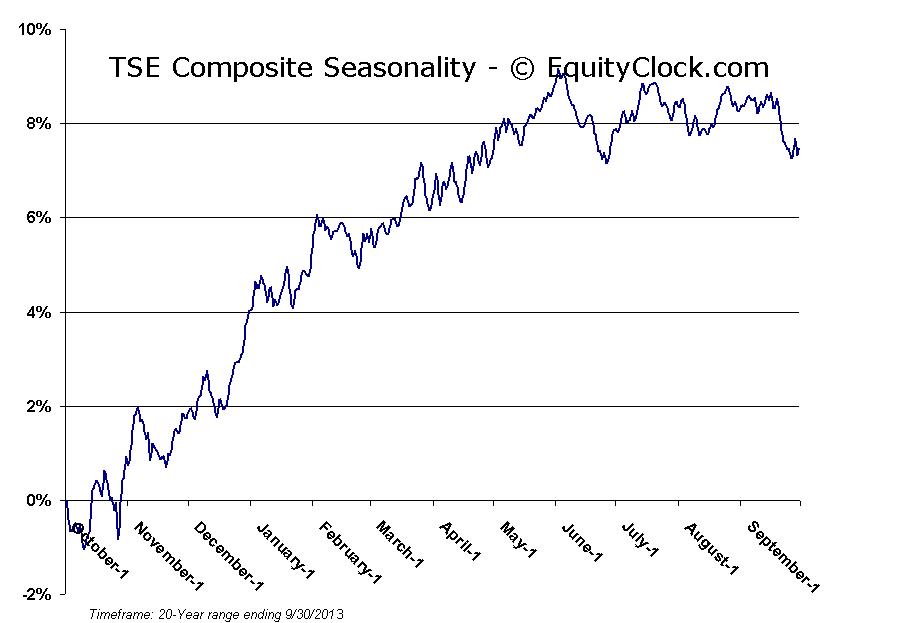
TSE Composite
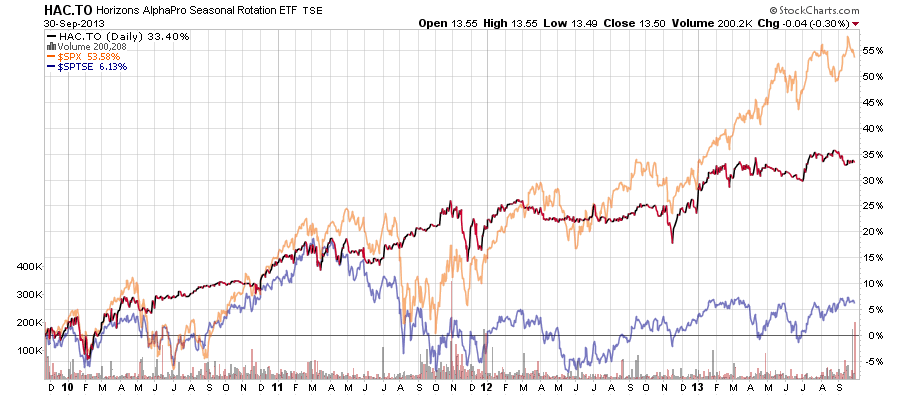
Horizons Seasonal Rotation ETF (TSX:HAC)
- Closing Market Value: $13.50 (down 0.30%)
- Closing NAV/Unit: $13.51 (down 0.03%)
Performance*
* performance calculated on Closing NAV/Unit as provided by custodian