Upcoming US Events for Today:
- NFIB Small Business Optimism Index for October will be released at 7:30am. The market expects 93.3 versus 93.9 previous.
Upcoming International Events for Today:
- German CPI for October will be released at 2:00am EST. The market expects a year-over-year increase of 1.2%, consistent with the previous report.
- Great Britain CPI for October will be released at 4:30am EST.The market expects a year-over-year increase of 2.4% versus an increase of 2.7% previous.
- Japan Machine Orders for September will be released at 6:50pm EST. The market expects a year-over-year increase of 12.3% versus an increase of 12.7% previous.
The Markets
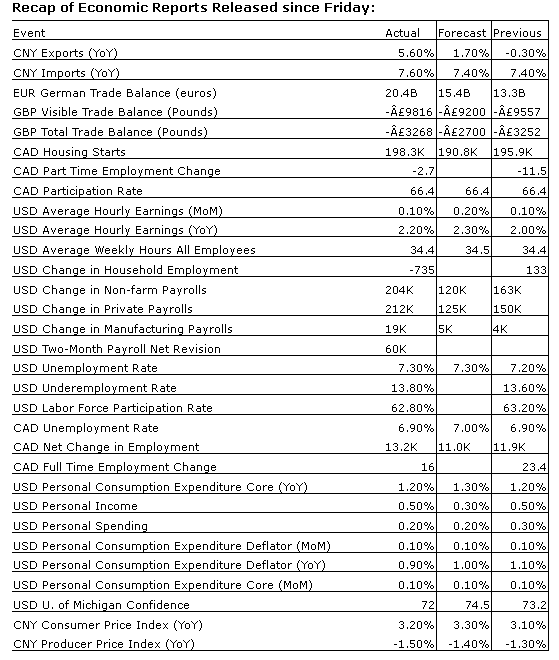
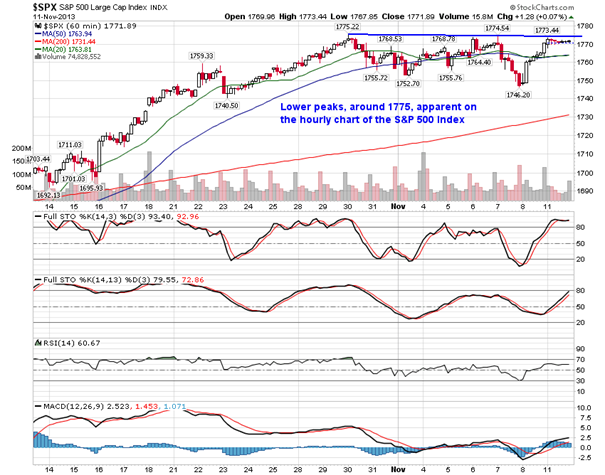
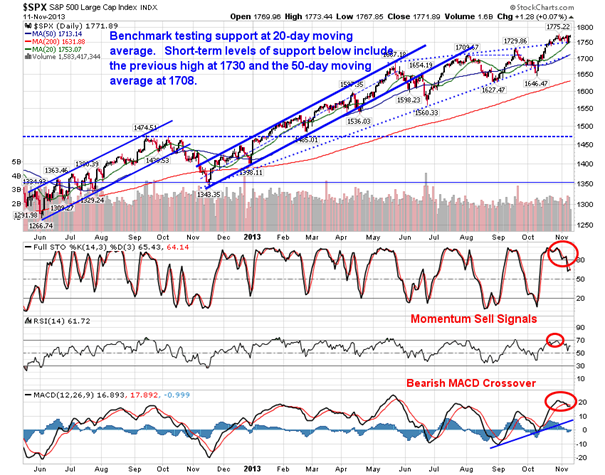
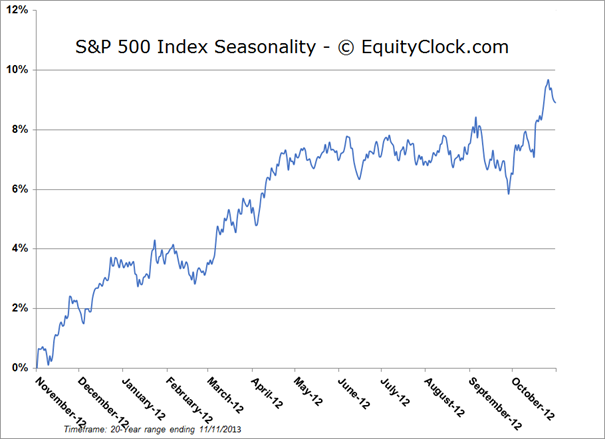
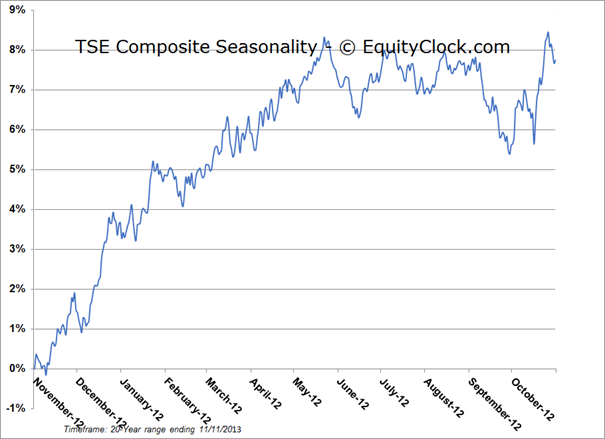
Stocks surged on Friday following a much better than expected employment report for October. The gain on the session erased the loss for the S&P 500 Index from the session prior, which saw the large cap benchmark trade down to its 20-day moving average, a level that has acted as support on a number of different occasions in the past. Resistance has now become apparent at 1775. Looking at the hourly chart, lower highs are becoming apparent ranging back to the end of October, highlighting the struggle the benchmark is facing at resistance. Moving averages, both the 20 and 50-day, have stalled on this short-term glimpse of the market, suggesting stalled upside momentum. With support directly below at the 20-day and resistance directly above at 1775, the simple law of probability places a 50/50 odds of a short-term move higher or lower. It is becoming apparent that a catalyst may be required in order to achieve either outcome. Stocks remain in a period of seasonal strength that stretches through to April and May, however, short-term weakness prior to the end of November typically provides ideal entry points for the remainder of seasonal strength ahead, including the positive tendencies surrounding the US Thanksgiving holiday at the end of this month.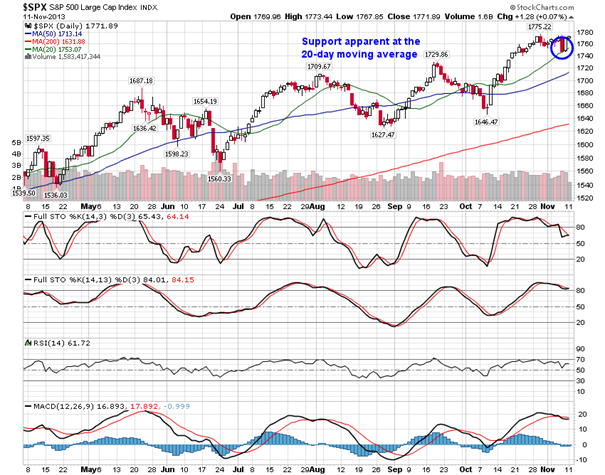
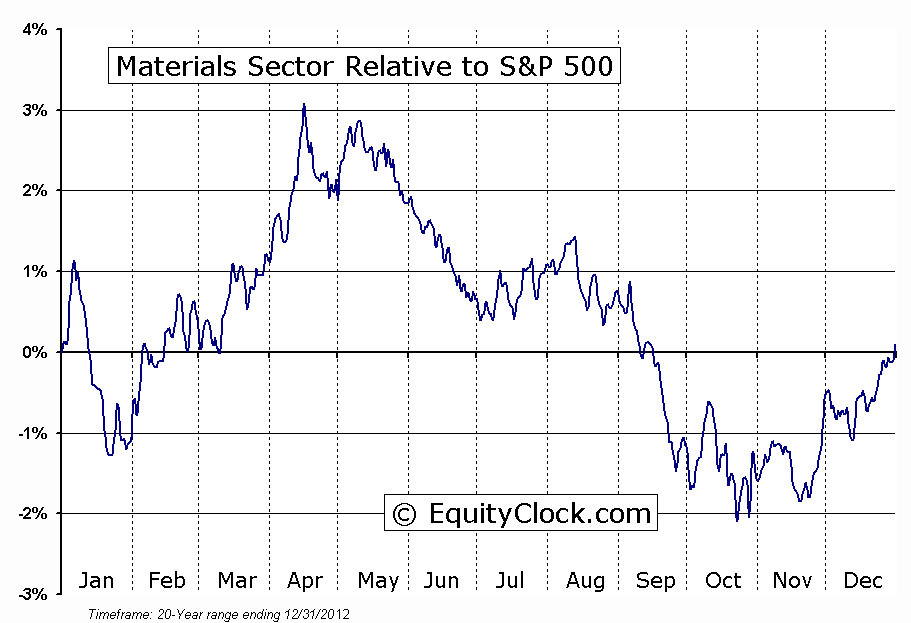
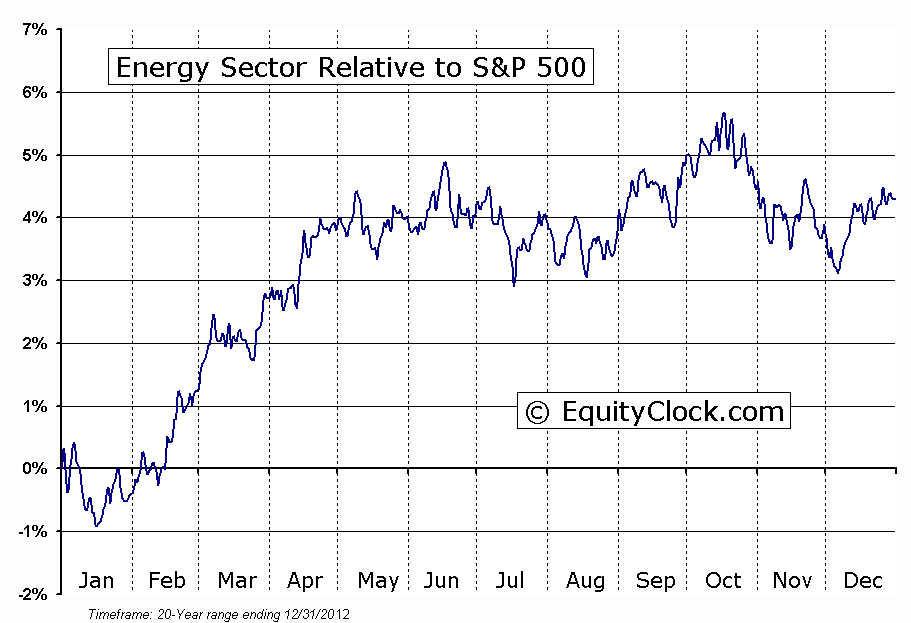
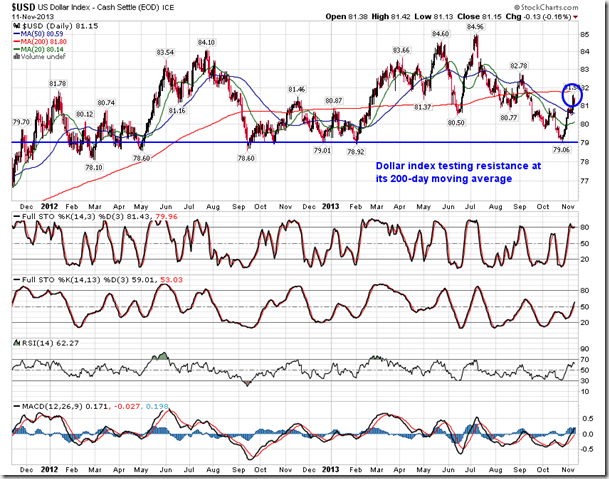
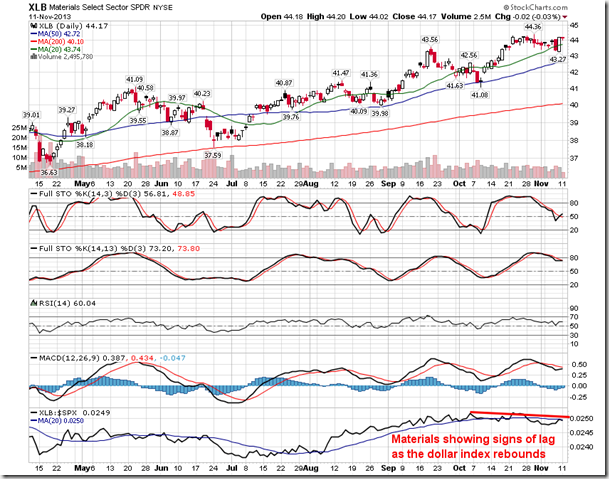
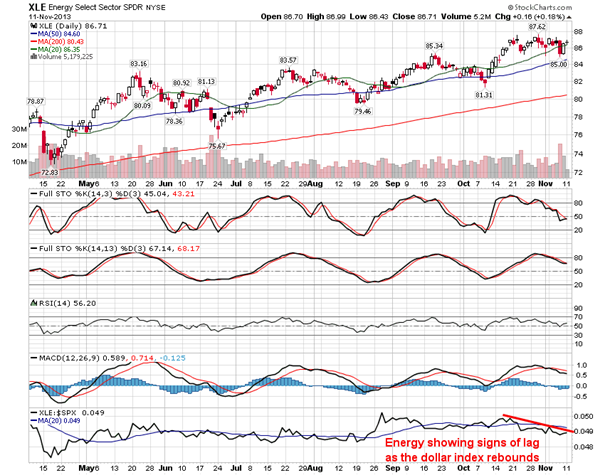
And while the S&P 500 Index battles with near-term support and resistance, so too does the US Dollar index, which is pushing up against its 200-day moving average. The currency benchmark recently bounced from a significant point of support at 79, which has taken some of the steam away from the equity markets as material and energy stocks start to show signs of lag versus the broad market. A breakout or breakdown in this index will likely continue to act as a significant influence in trading activity, depending on the direction of the break, especially with the period of seasonal strength for material stocks directly ahead of us. Material stocks, such as Metals and Mining, begin their period of seasonal strength on November 19th, on average.
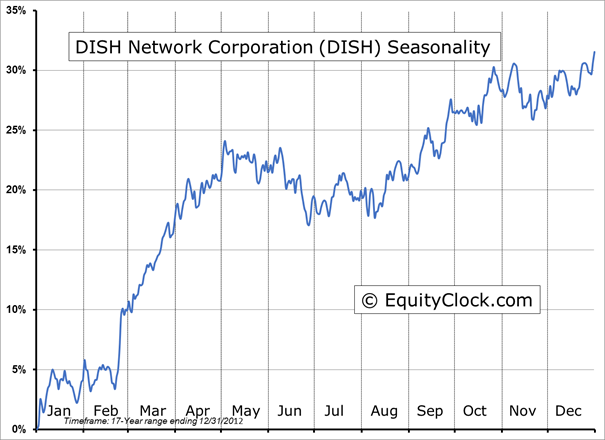
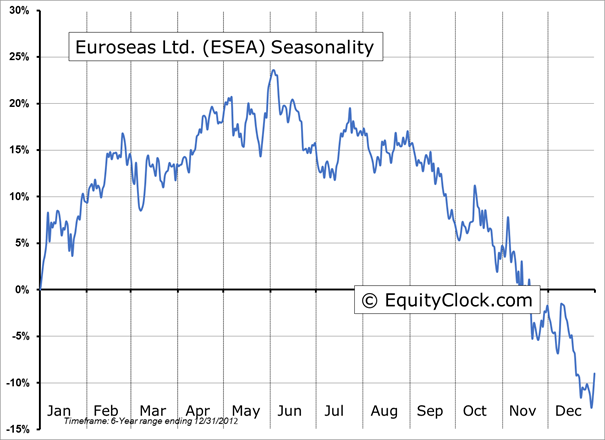
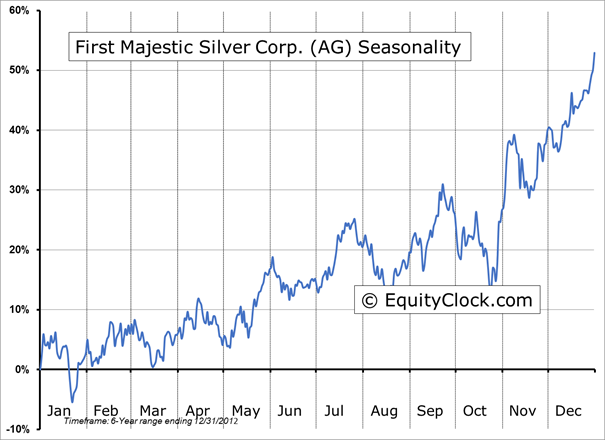
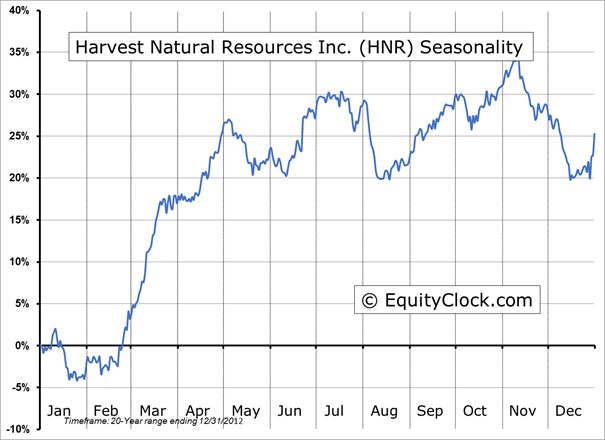
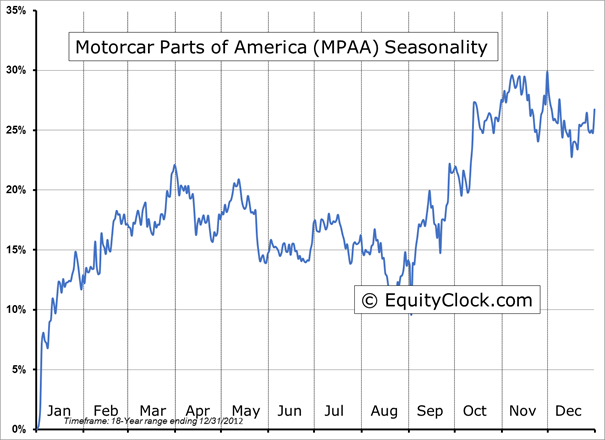
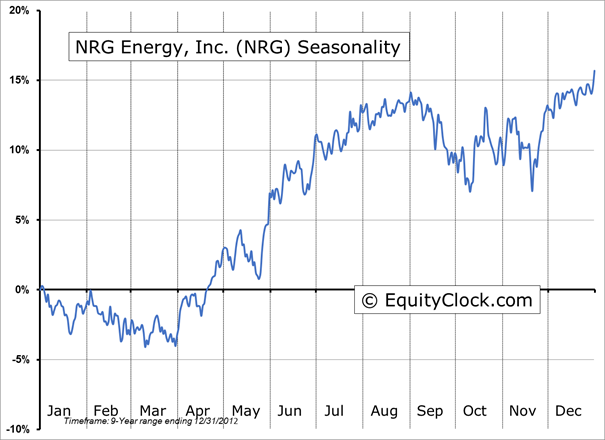
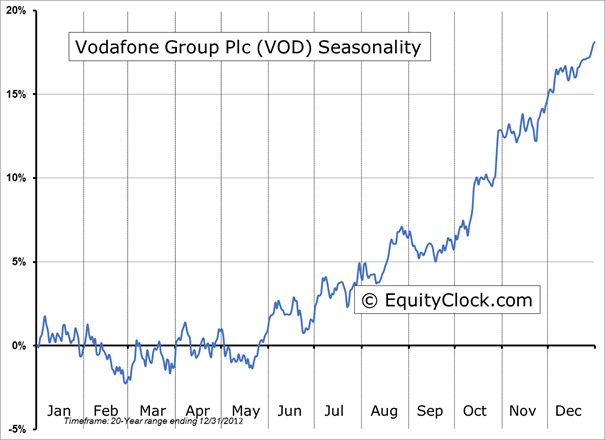
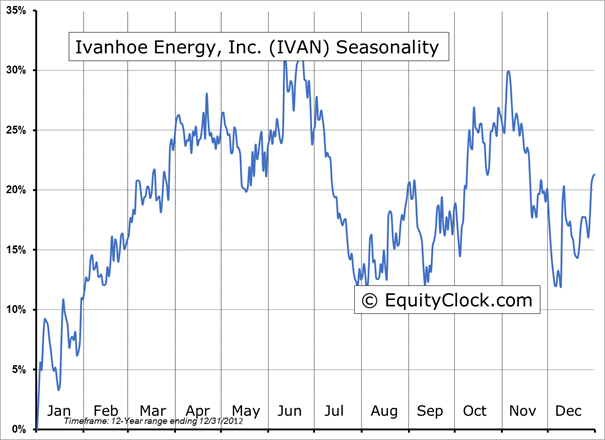
Seasonal charts of companies reporting earnings today: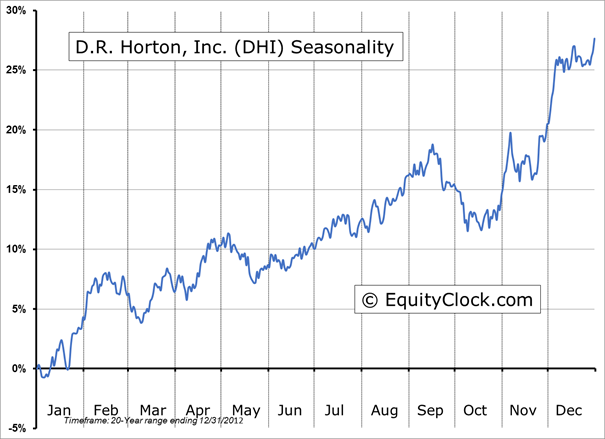
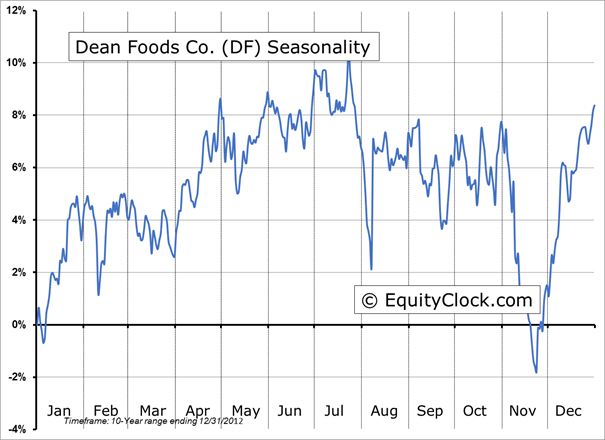
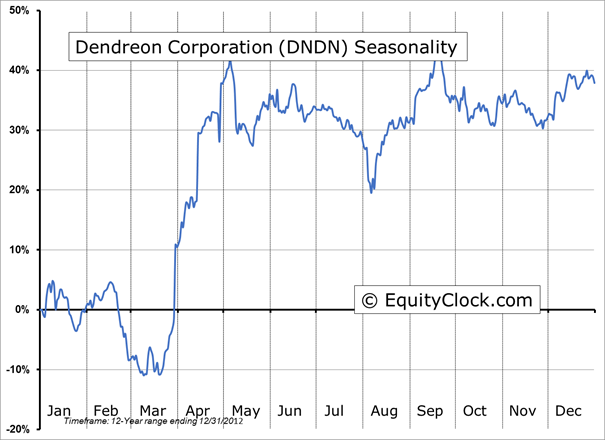
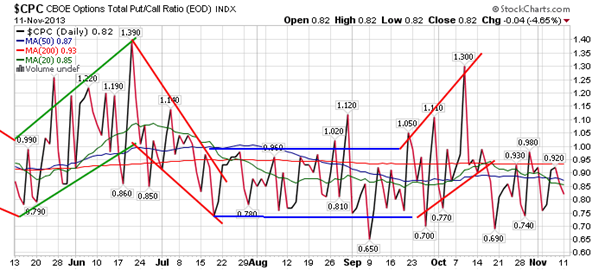
Sentiment on Monday, as gauged by the put-call ratio, ended bullish at 0.82.
S&P 500 Index
TSE Composite
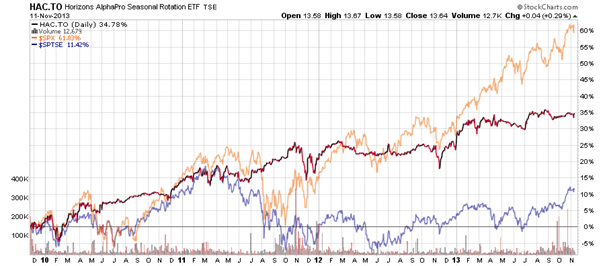
Horizons Seasonal Rotation ETF (TSX:HAC)
- Closing Market Value: $13.64 (up 0.29%)
- Closing NAV/Unit: $13.64 (unchanged)
Performance*
* performance calculated on Closing NAV/Unit as provided by custodian 