
- International Trade for June will be released at 8:30am. The market expects -$43.0B versus -$45.0B previous.
- Reserve Bank of New York Rate Decision will be released at 12:30am EST. The market expects a decline to 2.50% versus 2.75% previous.
- Great Britain Industrial Production for June will be released at 4:30am EST. The market expects a year-over-year increase of 0.8% versus a decline of 2.3% previous.
- German Factory Orders for June will be released at 6:00am EST. The market expects a year-over-year decline of 0.3% versus a decline of 2.0% previous.
- Canadian Merchandise Trade for June will be released at 8:30am EST. The market expects -$510M versus -$300M previous.


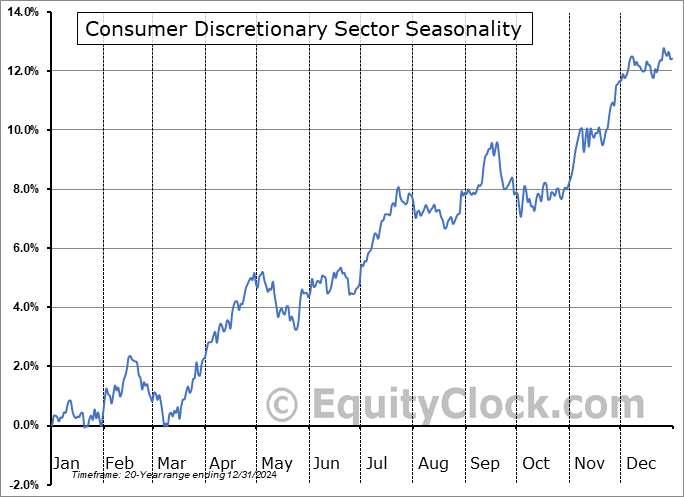
Despite Monday’s negative session for many of the broad equity benchmarks, investor risk sentiment remains quite positive. The Russell 2000 Small Cap index bucked the losses on the session and ended the day at a new all-time closing high. Small-caps have been outperforming the broad market since April, confirming a risk-on trend during a period when risk aversion is seasonally typical. Positive risk sentiment is also apparent in the ratio of Consumer Discretionary versus Consumer Staples. Seasonally, Staples typically outperform Discretionary from May through to October. Accommodative monetary policy of central banks around the globe can be highlighted as the reason for increased risk-taking during a period when low beta investments tend to outperform. The three sectors that typically influence the market lower through the summer months, Industrials, Materials, and Discretionary, are all showing outperformance versus the market. Cyclical sectors, such as these, reach peak selling pressures on a seasonal basis starting in the month of August, suggesting that investors have yet to escape the negative seasonal influences that are common during the summer months.

DISCRETIONARY Relative to the S&P 500

STAPLES Relative to the S&P 500 
Equity market momentum is showing signs of struggle as the month of August gets underway. We’ve highlighted in previous reports the negative divergence with respect to MACD on the S&P 500. The NYSE Advance-Decline line is also showing signs of struggle, resisting at the previous peak. And now the percent of stocks in the S&P 500 trading above their 200-day moving averages may be rolling over. The 50-day moving average of this technical indicator is curling lower as fewer stocks trade above their long-term moving average line, an event that typically precedes market peaks. As fewer and fewer buyers enter the market at the present peak, selling pressures over the intermediate-term may overwhelm whatever upside influences are left. 

Seasonal charts of companies reporting earnings today:


Sentiment on Monday, as gauged by the put-call ratio, ended bullish at 0.85.
S&P 500 Index

TSE Composite

Horizons Seasonal Rotation ETF (TSX:HAC)
Performance*
* performance calculated on Closing NAV/Unit as provided by custodian
Click Here to learn more about the proprietary, seasonal rotation investment strategy developed by research analysts Don Vialoux, Brooke Thackray, and Jon Vialoux.