Upcoming US Events for Today:
- Housing Starts for January will be released at 8:30am. The market expects 950K versus 999K previous. Building Permits are expected to decline to 975K versus 986K previous.
- Producer Price Index for January will be released at 8:30am. The market expects a year-over-year increase of 1.2% versus an increase of 1.1% previous.
- The FOMC Minutes from the latest meeting will be released at 2:00pm.
Upcoming International Events for Today:
- Bank of England Meeting Minutes will be released at 4:30am EST.
- Great Britain Labour Market Report for January will be released at 4:30am EST. The market expects the Claimant Count to decline by 25,000 versus a decline of 24,000 previous. The Unemployment Rate is expected to hold steady at 7.1%.
- Japan Merchandise Trade for January will be released at 6:50pm EST. The market expects -¥2,476.5B versus -¥1,302B previous.
- China Flash Manufacturing PMI for February will be released at 8:45pm EST. The market expects 49.4 versus 49.5 previous.
Recap of Yesterday’s Economic Events:
| Event | Actual | Forecast | Previous |
| CNY Foreign Direct Investment YoY | 16.10% | 2.50% | 3.30% |
| EUR Euro-Zone Current Account n.s.a. (euros) | 33.2B | 27.2B | |
| EUR Euro-Zone Current Account s.a. (euros) | 21.3B | 23.3B | |
| GBP Consumer Price Index (MoM) | -0.60% | -0.50% | 0.40% |
| GBP Consumer Price Index (YoY) | 1.90% | 2.00% | 2.00% |
| GBP Core Consumer Price Index (YoY) | 1.60% | 1.90% | 1.70% |
| GBP Producer Price Index Output n.s.a. (MoM) | 0.30% | 0.00% | 0.00% |
| EUR German ZEW Survey (Current Situation) | 50 | 44 | 41.2 |
| EUR German ZEW Survey (Economic Sentiment) | 55.7 | 61.5 | 61.7 |
| EUR Euro-Zone ZEW Survey (Economic Sentiment) | 68.5 | 73.3 | |
| CAD International Securities Transactions (Canadian dollar) | -4.28B | 9.07B | |
| USD Empire Manufacturing | 4.48 | 9 | 12.51 |
| USD Net Long-term TIC Flows | -$45.9B | $30.0B | -$28.0B |
| USD Total Net TIC Flows | -$119.6B | -$16.6B | |
| USD NAHB Housing Market Index | 46 | 56 | 56 |
The Markets
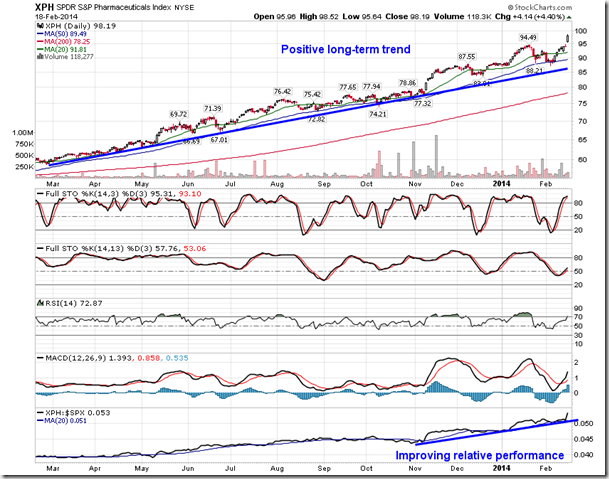
Stocks ended generally higher on Tuesday, buoyed by acquisition news out of the Health Care sector. Shares of Forest Laboratories jumped over 27% following news that it would be acquired by Actavis. The result fuelled gains in the S&P Pharmaceutical Index, which added 4.40%, charting a new all-time high. The industry ETF has maintained a very steady positive trend throughout the past year, consistently supported by a rising 50-day moving average. Outperformance versus the market is easily apparent. Pharmaceutical stocks enter their peak period of seasonal strength from August through to October.
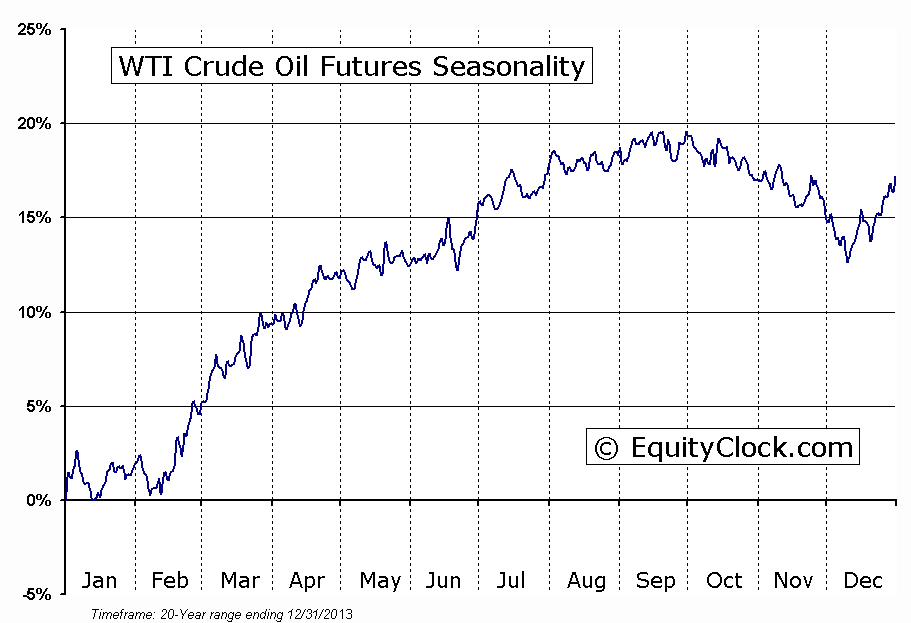
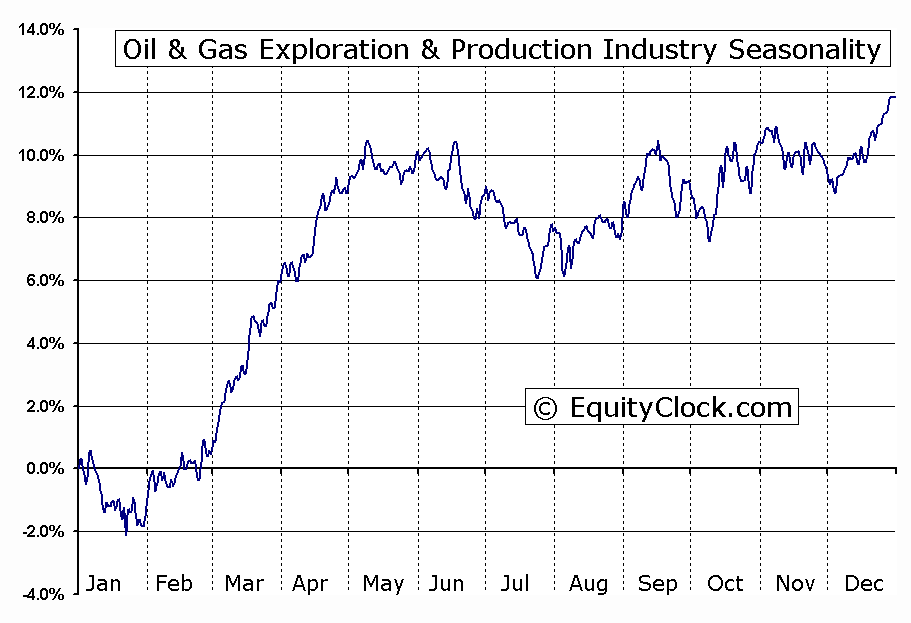
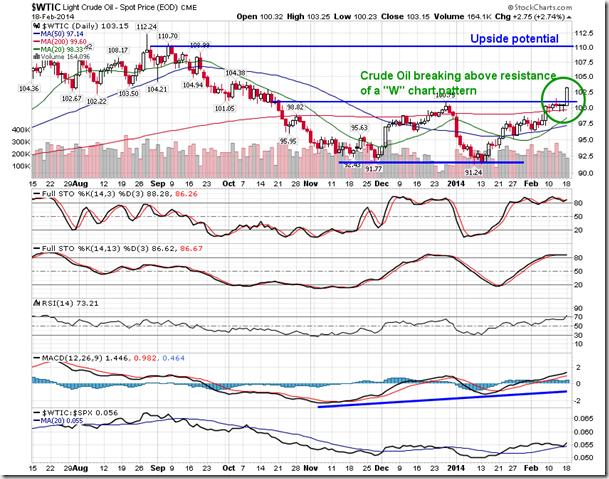
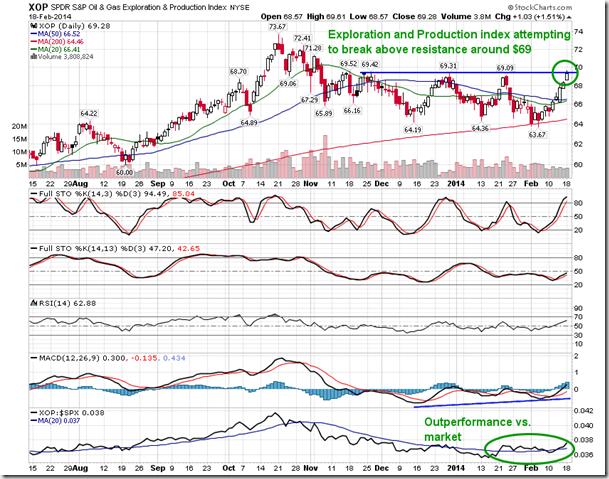
Aside from the Health Care sector, Energy stocks also posted firm gains, benefitting from the strength in energy commodity prices. Crude Oil jumped 2.74%, Gasoline gained 1.43%, and Natural Gas surged 7.15% due to the inclement winter weather in the US northeast. The price of Crude Oil has now broken through resistance presented by the previous intermediate high of $100.75, completing a “W” chart formation that projects upside potential towards $110. Energy stocks and commodities seasonally gain from January through to May, running higher into the summer driving season. As reported in a previous Globe & Mail article, colder than average winter weather can have a significantly positive impact on the price of Oil, with average returns of around 13% during the 8 coldest winters over the past 30 years. This tendency is certainty holding true this year; crude oil is already higher by 13% since the low set in January. Upside potential of around 6% still remains, which would push the price of the commodity towards multi-year resistance around $110. Following the strength in Crude Oil are stocks in the Energy Exploration and Production Industry, which is the most leveraged way to take advantage of the strength in the commodity. The Exploration and Production ETF (XOP) is showing signs of breaking out above resistance around $69; outperformance versus the market has recently become apparent. Positive seasonal tendencies for energy stocks peak at the beginning of May, on average.
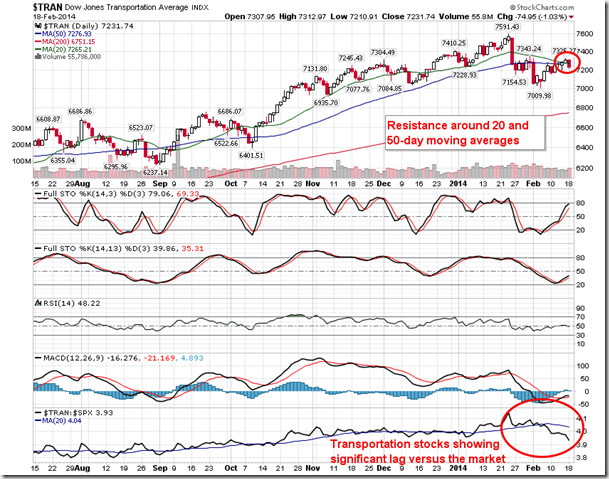
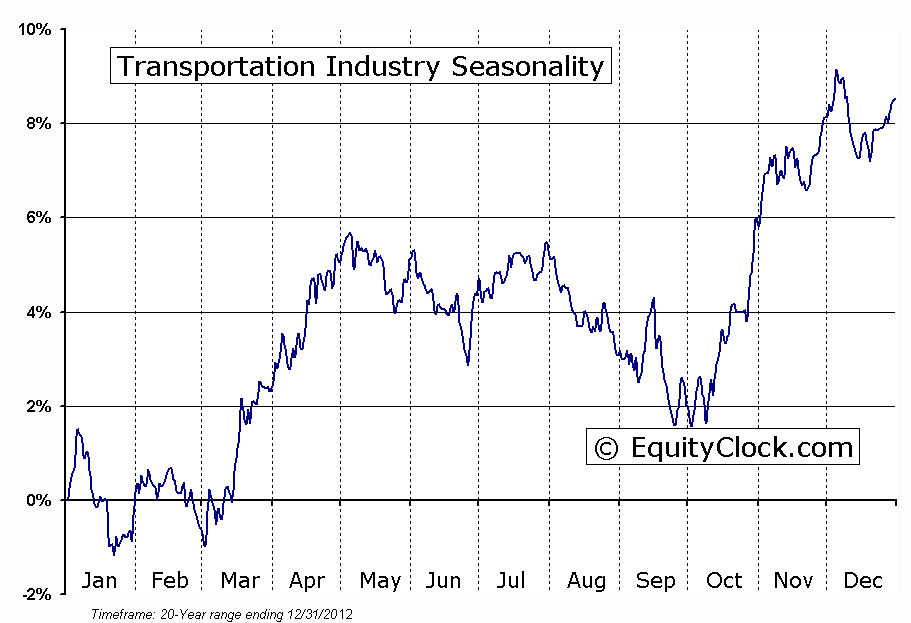
While energy stocks received a boost on the back of higher oil prices, transportation stocks dipped. Stocks within the industry have shown significant lag versus the market over recent weeks as a result of the higher energy costs. The colder than average temperatures typically benefit only two sectors, energy and utilities, while other equity market segments, such as the transportation industry, become burdened by the diminished economic activity and higher input costs. Consumer discretionary is another sector that remains under pressure, underperforming the market since the year began. The good news is that impacts resulting from colder (and snowier) than average weather typically do not persist beyond the winter months, implying that recent weakness may be short-lived. The last day of winter is precisely one month away. The transportation industry seasonally gains during March and April.
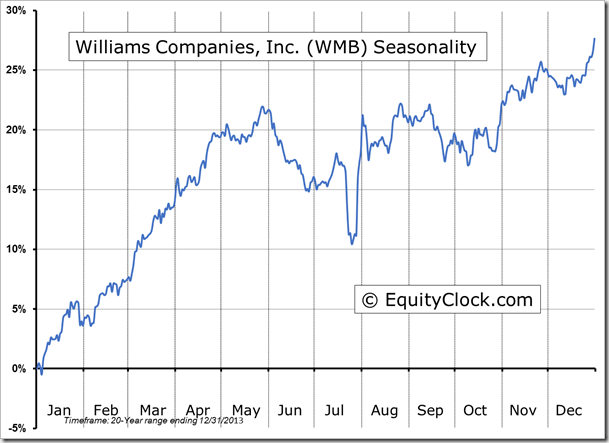
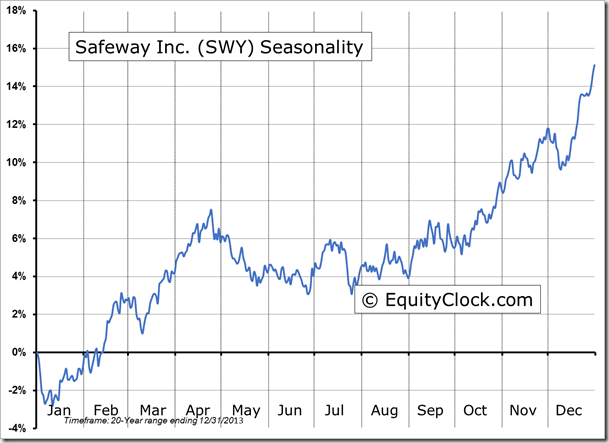
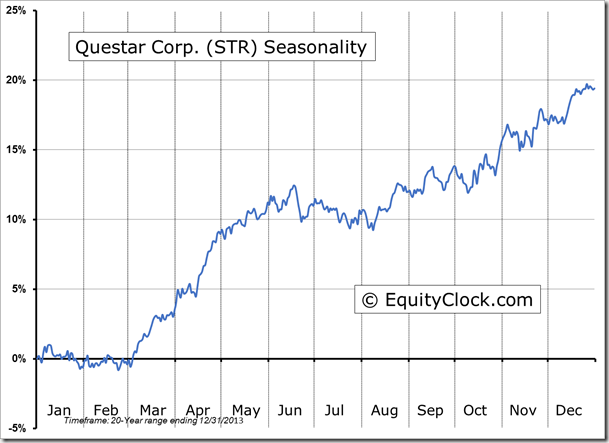
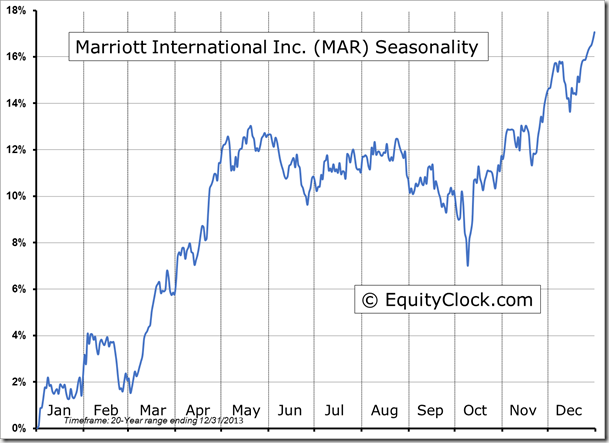
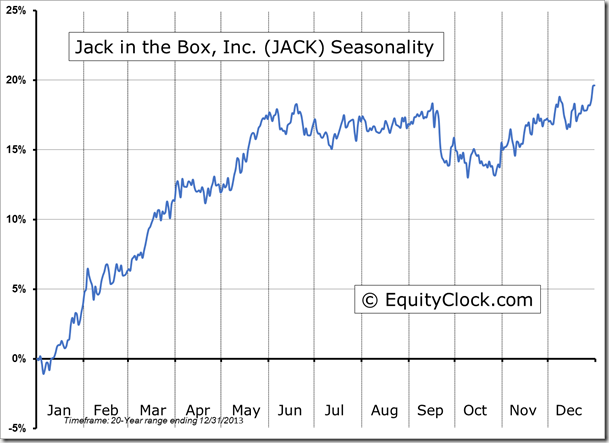
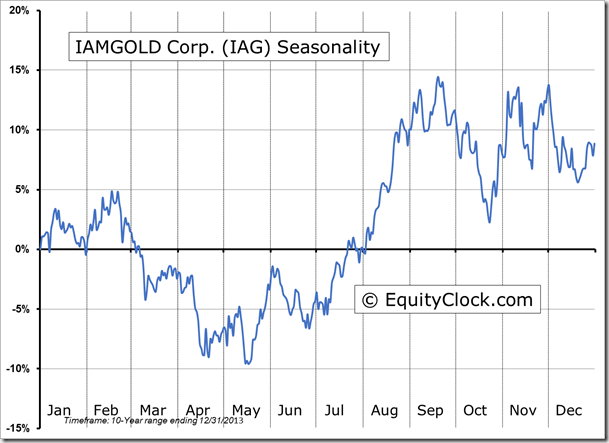
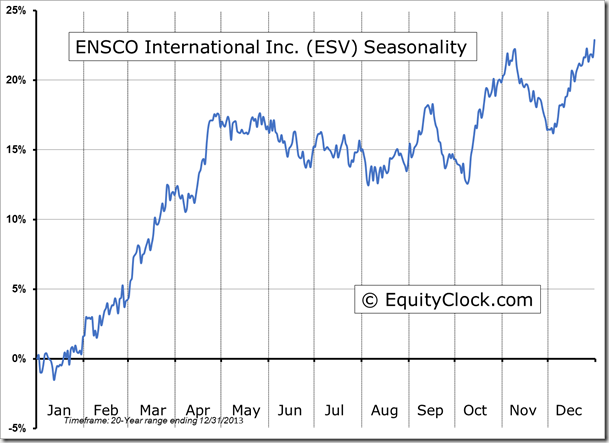
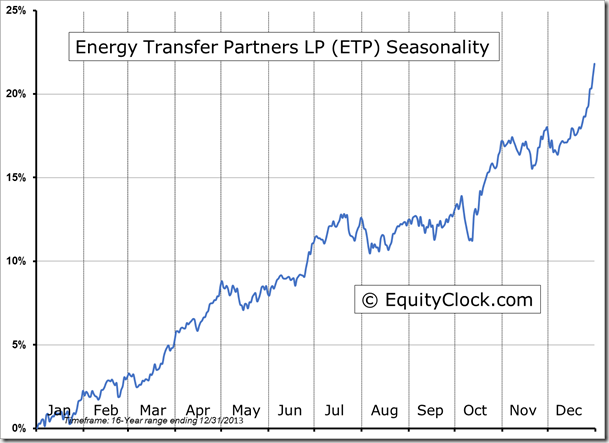
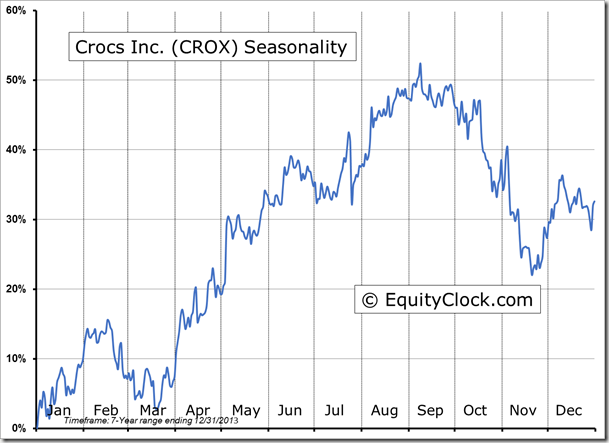
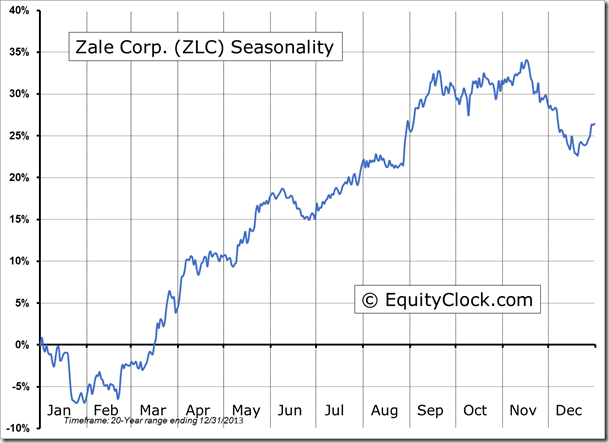
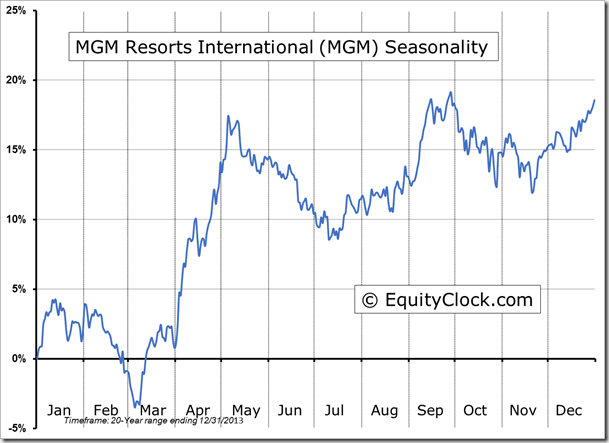
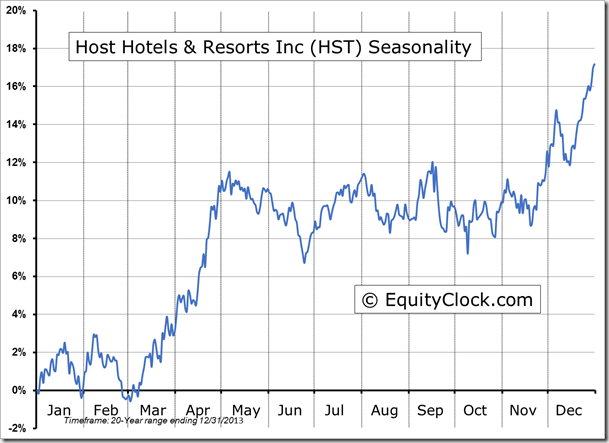
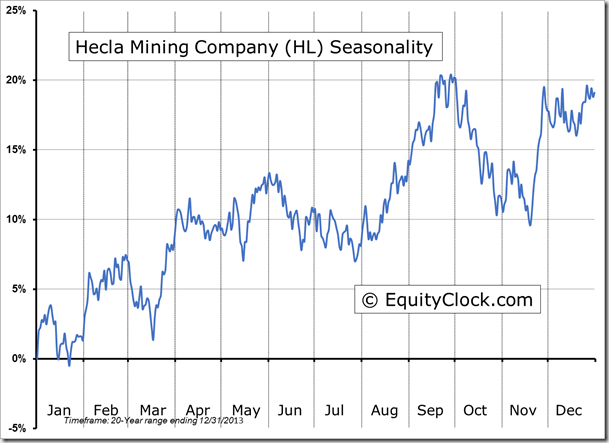
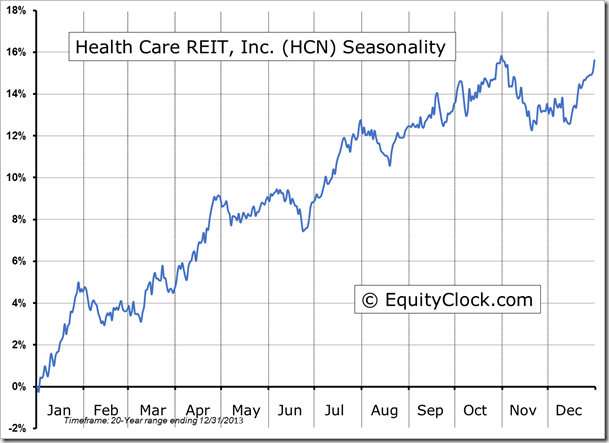
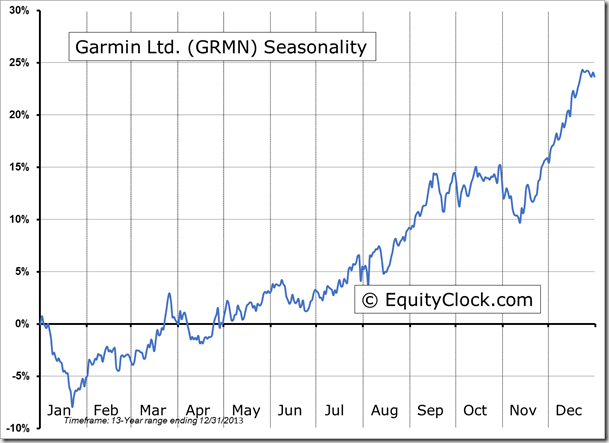
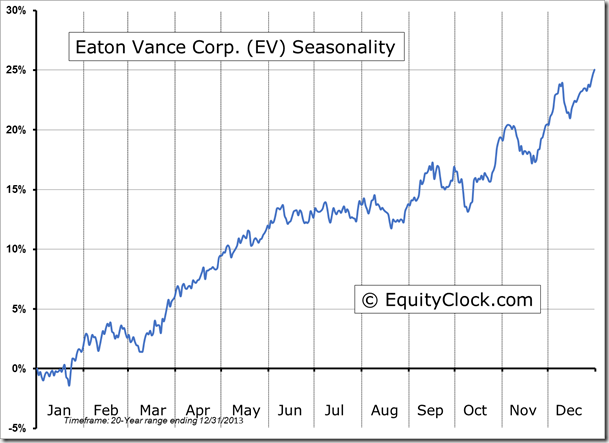
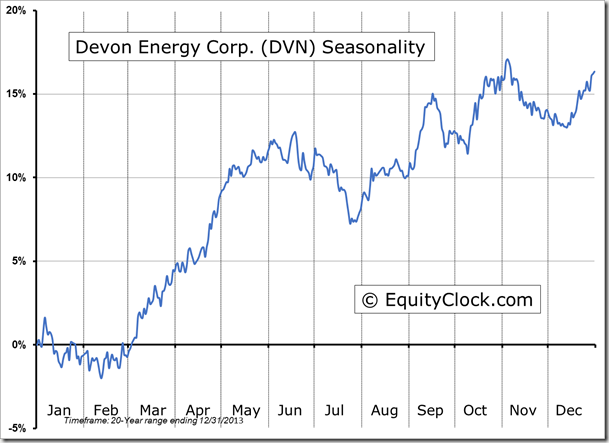
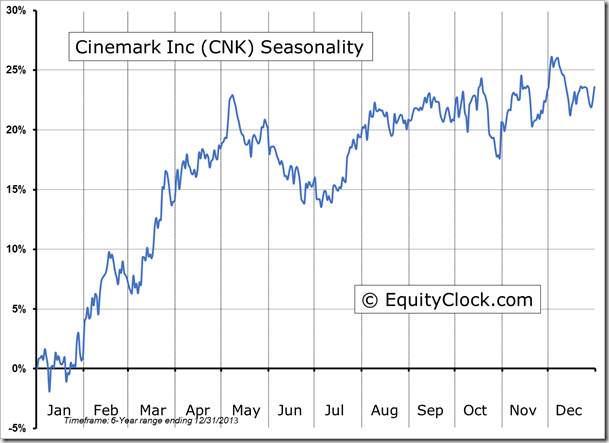
Seasonal charts of companies reporting earnings today:
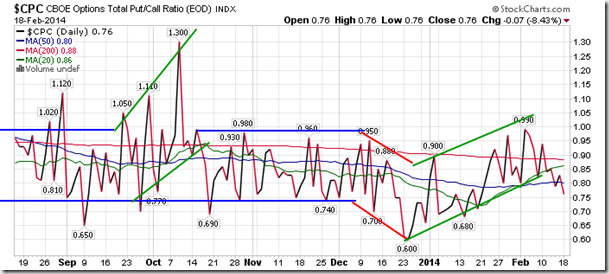
Sentiment on Tuesday, as gauged by the put-call ratio, ended bullish at 0.76. The re-emergence of a bullish trend is becoming apparent as investors gravitate back towards upside call options.
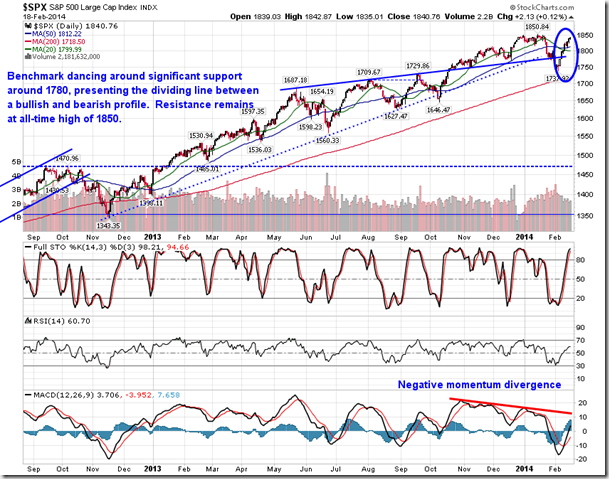
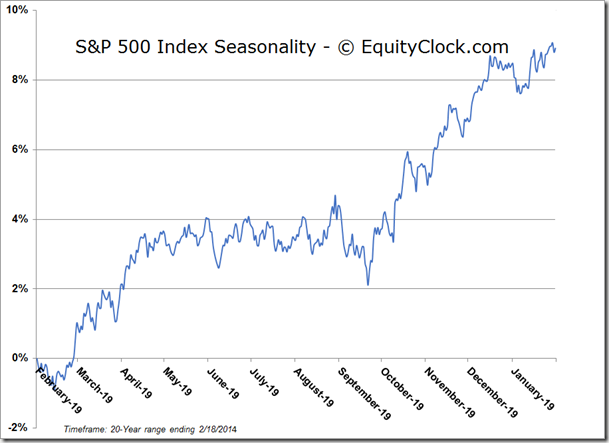
S&P 500 Index
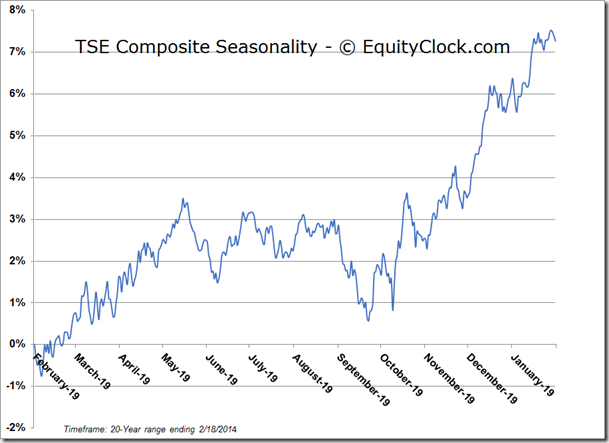
TSE Composite
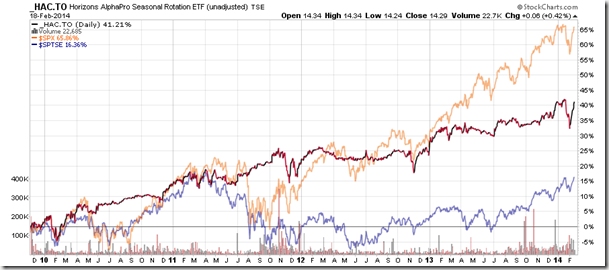
Horizons Seasonal Rotation ETF (TSX:HAC)
- Closing Market Value: $14.29 (up 0.42%)
- Closing NAV/Unit: $14.30 (up 0.37%)
Performance*
| 2014 Year-to-Date | Since Inception (Nov 19, 2009) | |
| HAC.TO | 0.00% | 43.0% |
* performance calculated on Closing NAV/Unit as provided by custodian
