Upcoming US Events for Today:
No significant events scheduled.
Upcoming International Events for Today:
- Bank of England Meeting Minutes will be released at 4:30am EST.
- Great Britain Jobless Claims Change for December will be released at 4:30am EST.
- Bank of Canada Rate Announcement will be released at 10:00am EST. The market expects no change at 1.0%.
- China Flash Manufacturing PMI for January will be released at 8:45pm EST. The market expects 50.4 versus 50.5 previous.
Recap of Yesterday’s Economic Events:
| Event | Actual | Forecast | Previous |
| EUR German ZEW Survey (Economic Sentiment) | 61.7 | 64 | 62 |
| EUR Euro-Zone ZEW Survey (Economic Sentiment) | 73.3 | 68.3 | |
| EUR German ZEW Survey (Current Situation) | 41.2 | 35 | 32.4 |
| GBP CBI Trends Selling Prices | 20 | 12 | 11 |
| GBP CBI Business Optimism | 21 | 25 | 24 |
| GBP CBI Trends Total Orders | -2 | 10 | 12 |
| CAD Manufacturing Shipments (MoM) | 1.00% | 0.30% | 0.70% |
| CAD Wholesale Sales (MoM) | 0.00% | 0.30% | 1.20% |
The Markets
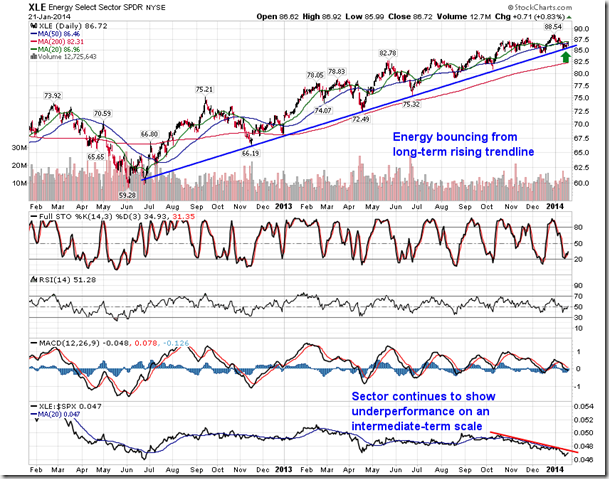
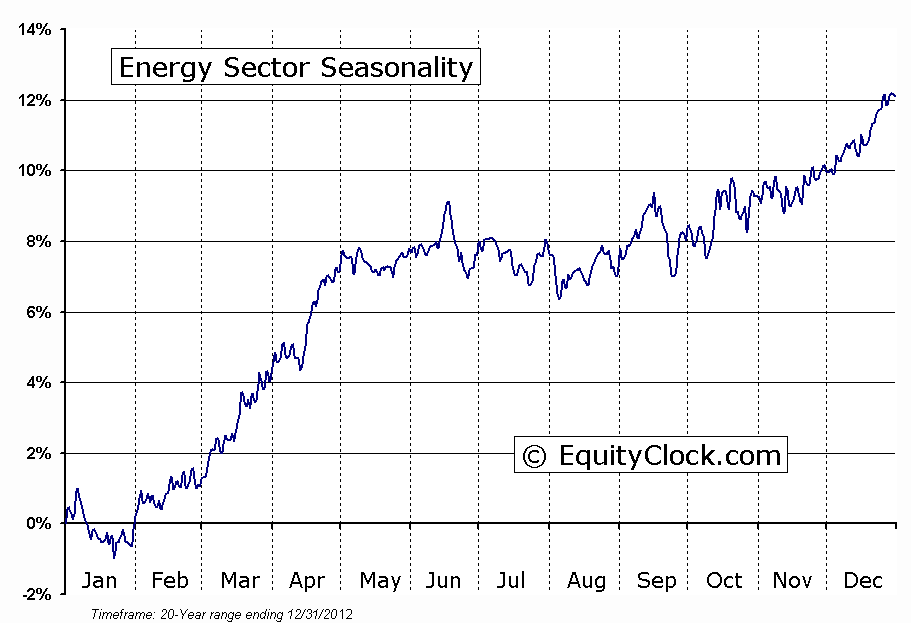
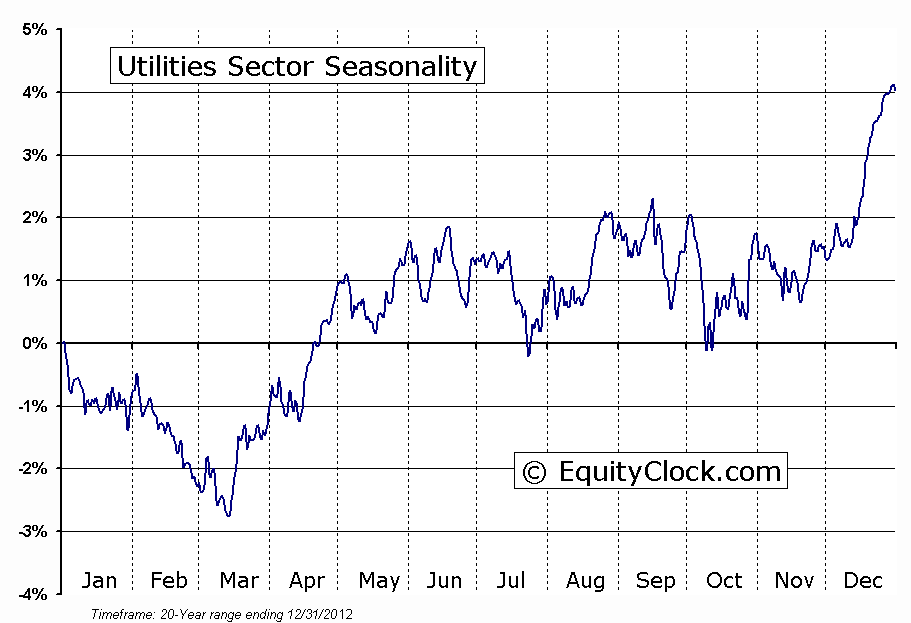
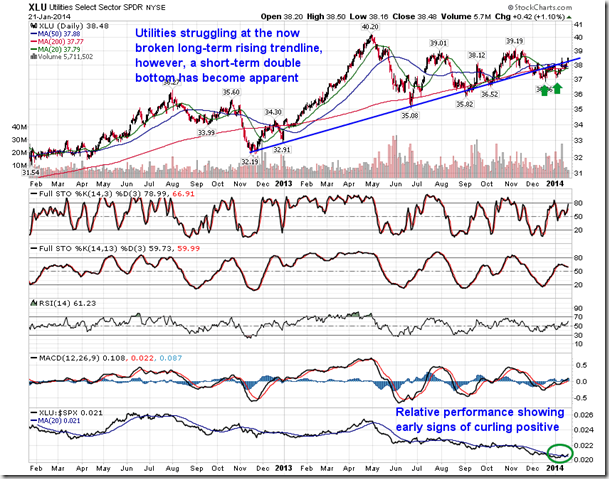
Stocks ended generally higher on Tuesday, supported by strength in the Energy and Utilities sectors. Both sectors received a boost following a jump in Oil and Natural Gas prices as the US Northeast gets hit with another blast of cold and snowy weather. Dusting off an old study produced by Tech Talk and published in the Financial Post in February of 2011 shows that both the Energy and Utility sectors tend to benefit during colder than average winter seasons; early indications of this phenomena happening again are becoming evident. Interesting to note that these two sectors are the only ones that tend to produce higher than seasonal average returns under extreme cold weather conditions; Industrials, Materials, Consumer Discretionary, Consumer Staples, Technology, and Financials all tend to produce lower than seasonal average returns when the thermometer plunges in the manner that we’ve see thus far this winter. The result is a lower than average return for the S&P 500 from the start of winter in December through to the end of the season in March. Returns for the large-cap index over this period during colder than normal years average a gain of 2.2% versus a gain of 5.6% during warmer than average years. Cold weather tends to drive energy commodity prices higher, increasing costs for other equity market sectors. As well, the difficult operating conditions that the cold weather presents can limit economic activity. Colder than average temperatures are forecasted well into February, suggesting that this season could be the coldest in recent history. Oil and Natural Gas prices are already advancing on this cold forecast. The Energy Sector ETF (XLE) is showing signs of reacting as well, bouncing from long-term trendline support; the relative performance of the sector still has yet to establish an intermediate-term positive trend. The Utilities sector, on the other hand, is struggling at the now broken long-term rising trendline, although a short-term double bottom pattern has become apparent. The Utilities sector is showing early signs of outperformance versus the market following the gain of 1.10% during Tuesday’s session. Energy is typically strong during the first quarter, however, Utilities, during average years, tends to be one of the worst performing sectors of the market at this time of year.
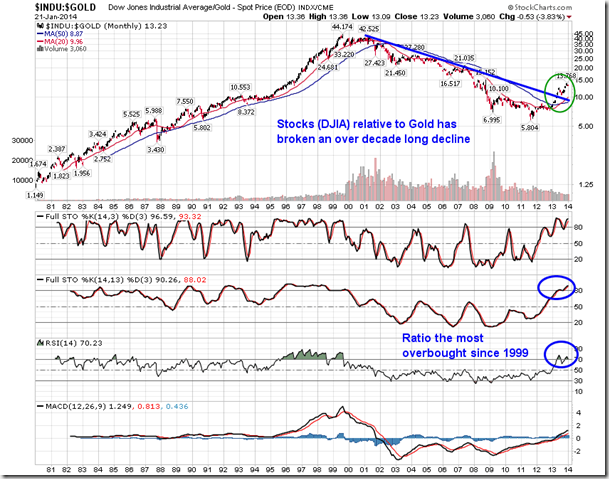
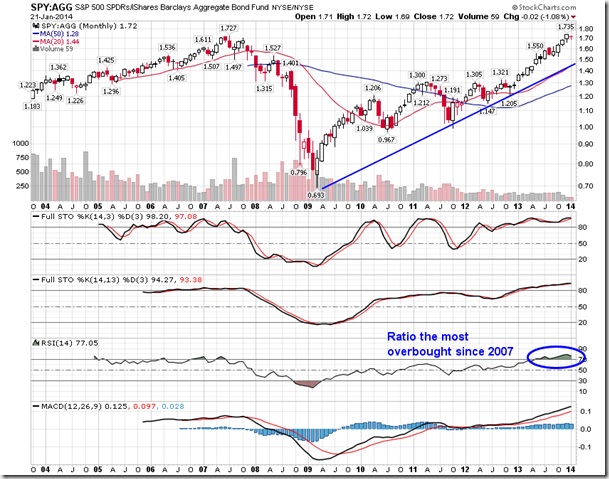
It can be argued that the performance of various asset classes are interconnected; the valuation of equity benchmarks can be priced relative to the bond or commodity market to determine extremes. Often funds will flow from one asset class to another, bidding up the price of one while asking lower the price of the other(s). This was evident last year as equity markets captured the fund flows, leading to the outperformance of stocks relative to bonds or commodities. Bond funds and commodity funds, particularly those relating to gold, saw outflows, leading to lower prices of the assets. A ratio of US equity benchmarks to both the price of gold and to the price of bonds shows that equity markets are now the most overbought relative to these other assets classes in many years. The Dow Jones Industrial Average relative to the price of Gold broke above a long-term declining trendline last year, suggesting the end of over a decade of caution that led to a bull market in Gold and flat equity market returns from 2000 to 2011/2012. The ratio is now the most overbought since 1999, suggesting the two asset classes may soon converge, at least over the short-term, in order to alleviate the stretched condition. A similar reading is present when looking at the ratio of the S&P 500 ETF (SPY) and the iShares Aggregate Bond Fund (AGG). According to the monthly chart of this ratio, stocks are the most overbought relative to bonds since 2007. Once again, the suggestion is that the two assets classes will soon converge in order to alleviate the stretched condition. Both ratio charts suggest that stocks remain in a long-term trend of outperformance, something that is not expected to conclude anytime soon. However, as always, there is going to be push and pull along the way.
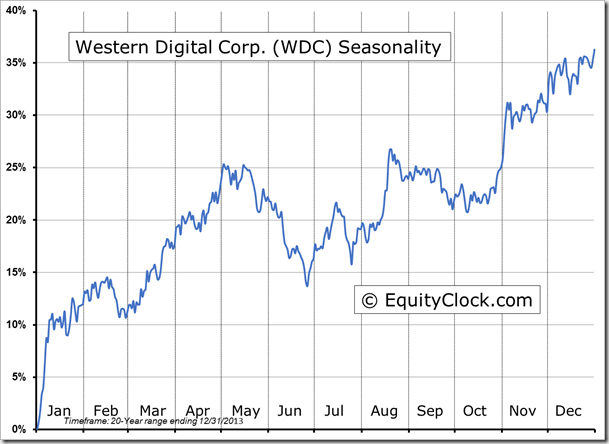
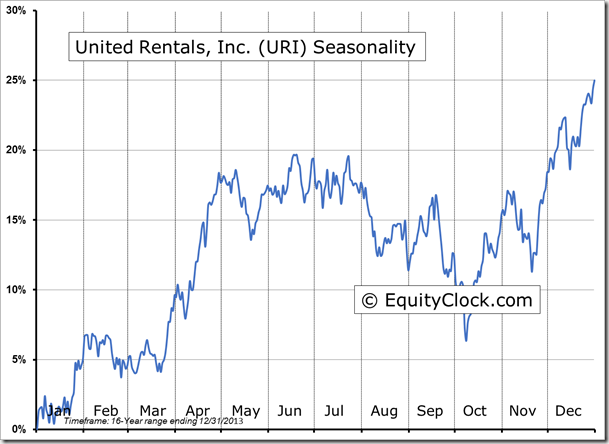
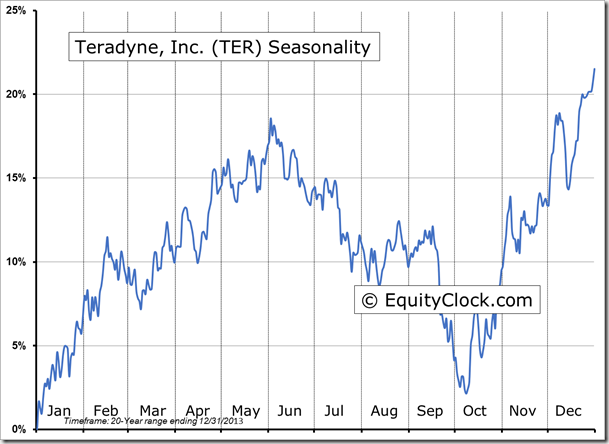
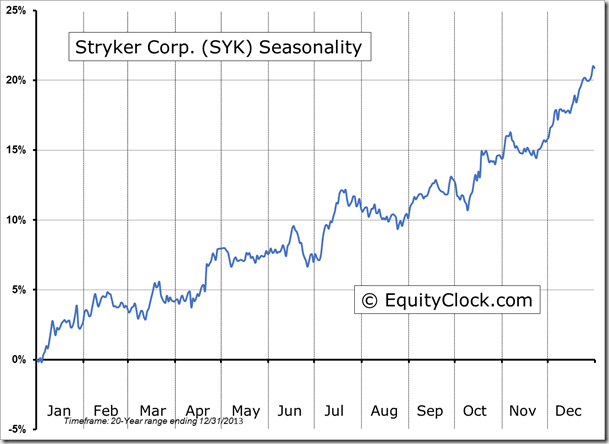
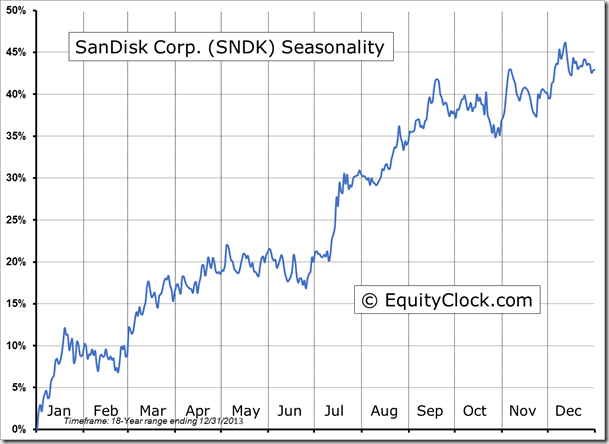
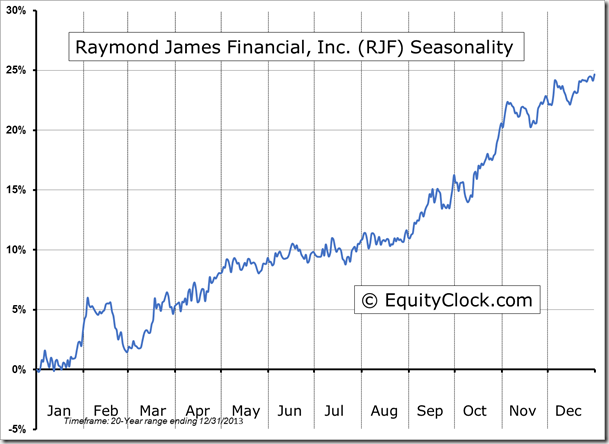
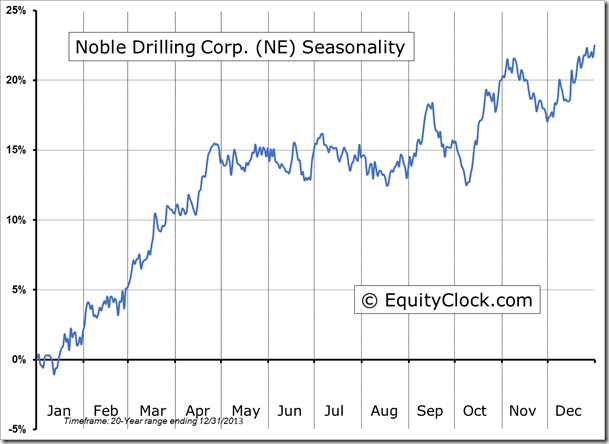
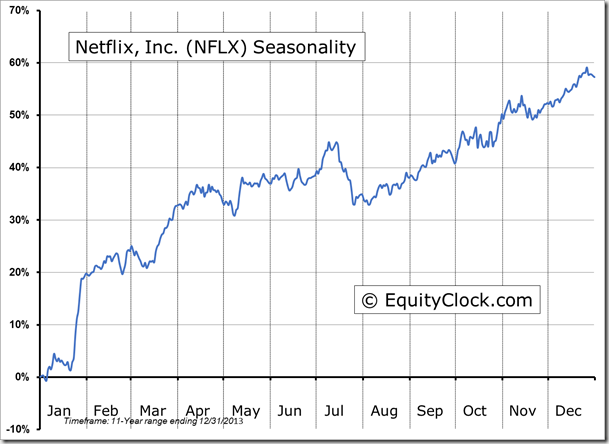
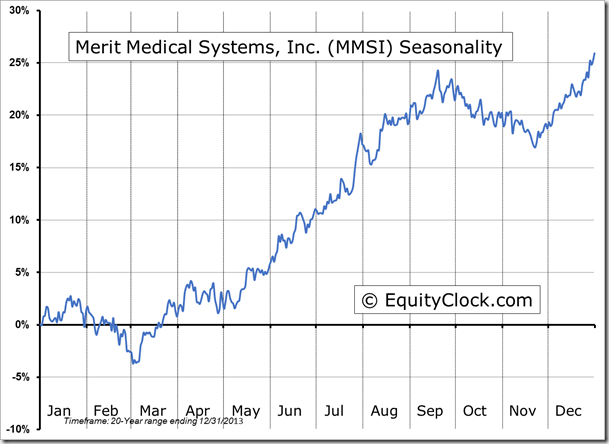
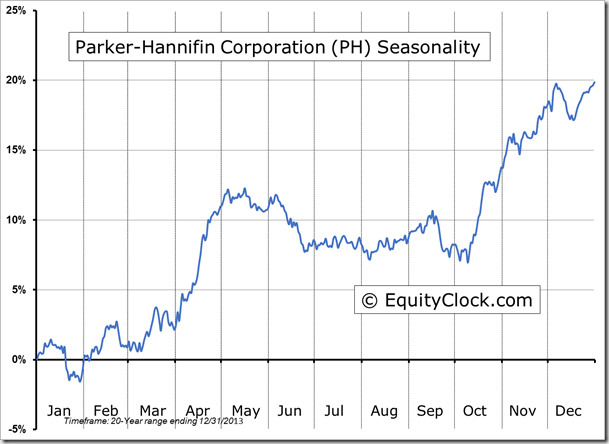
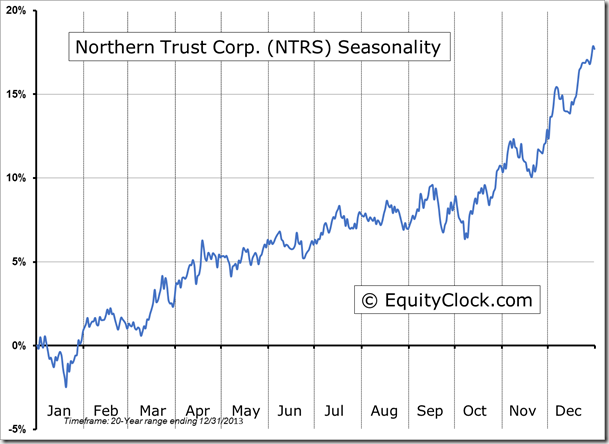
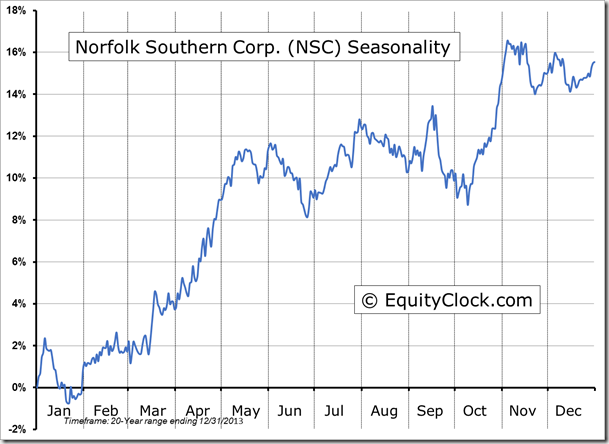
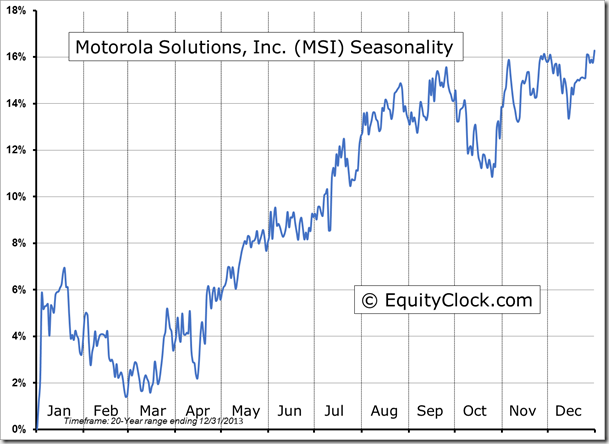
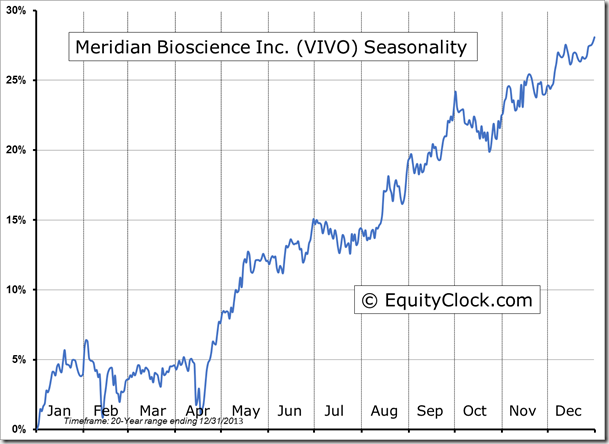
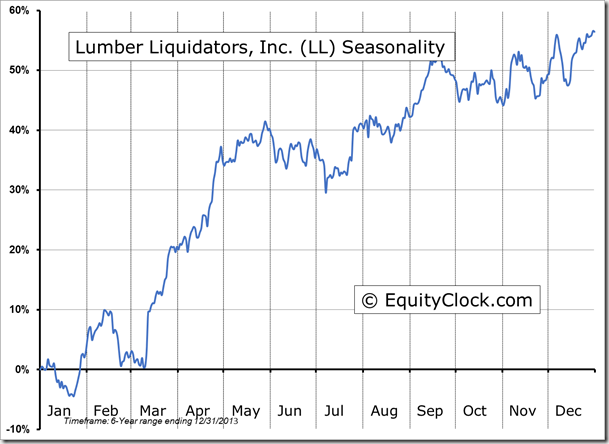
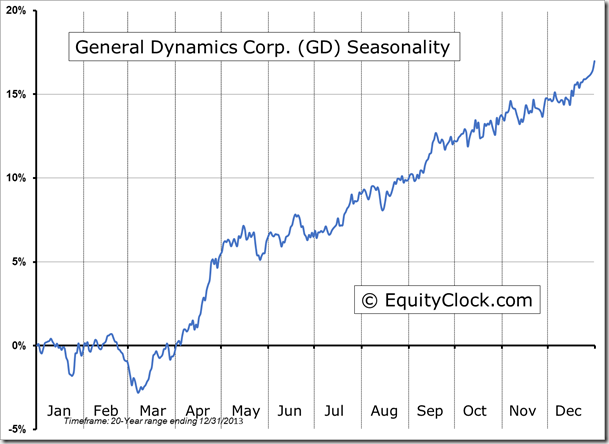
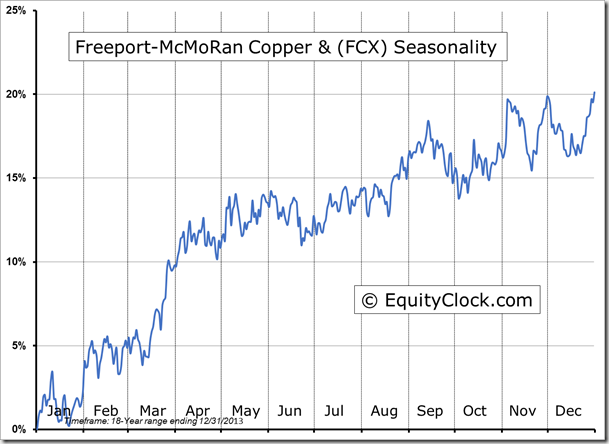
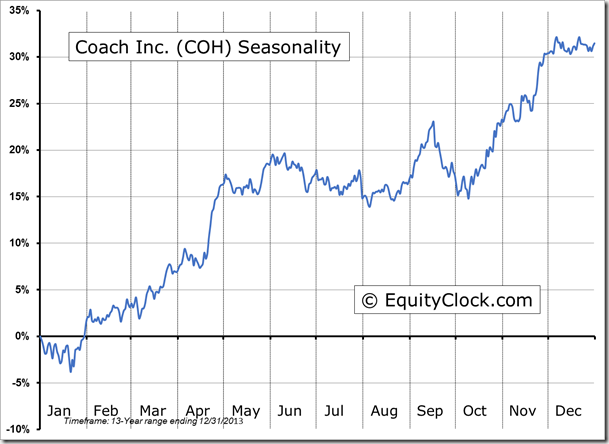
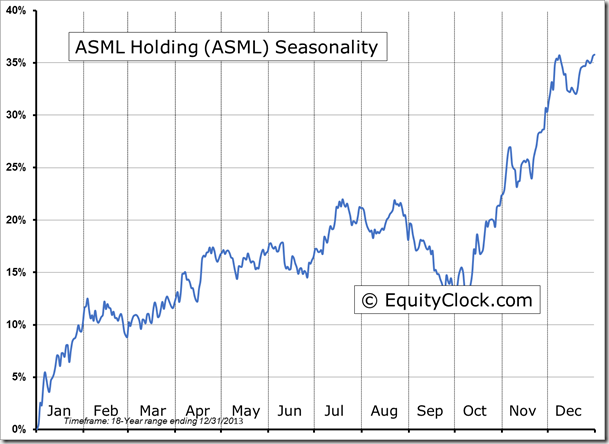
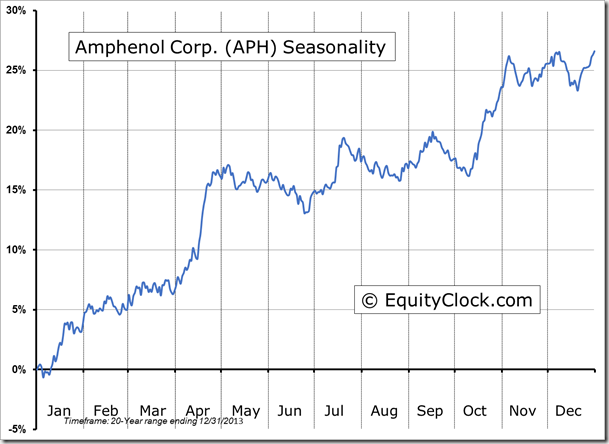
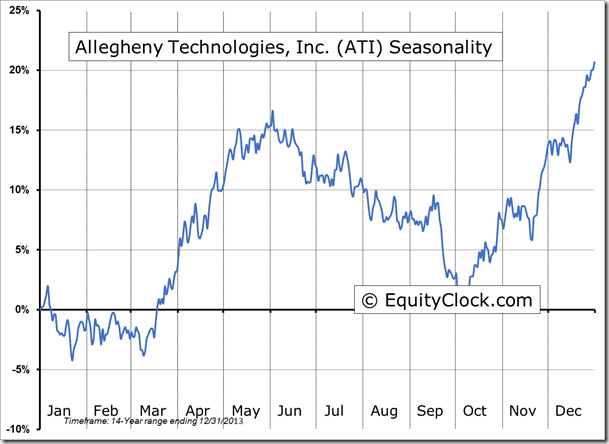
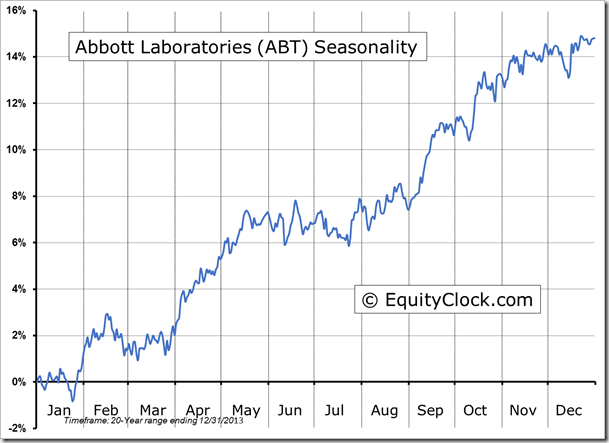
Seasonal charts of companies reporting earnings today:
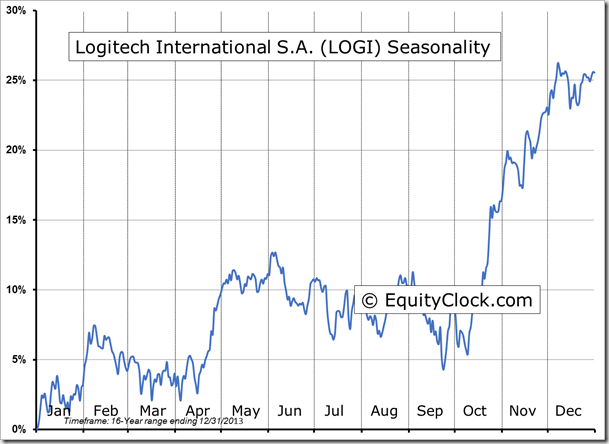
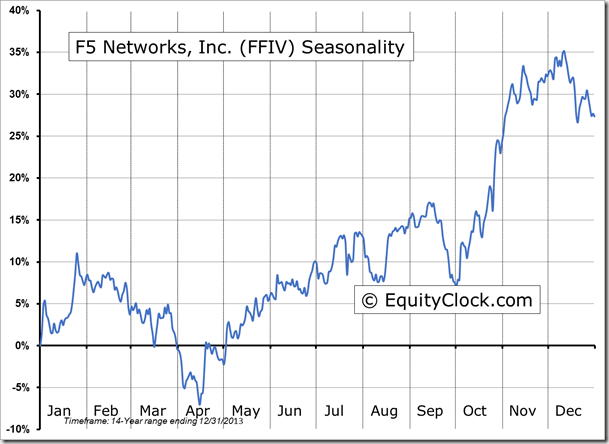
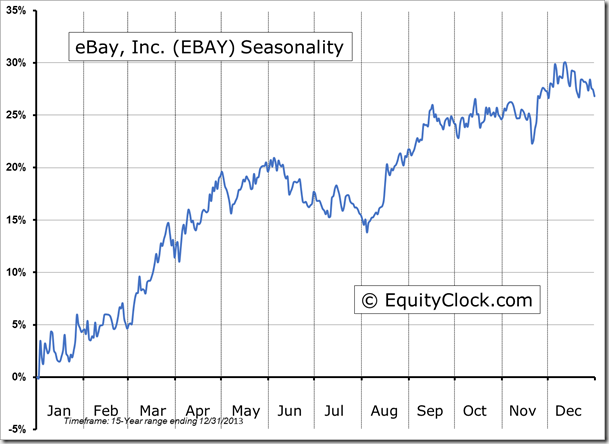
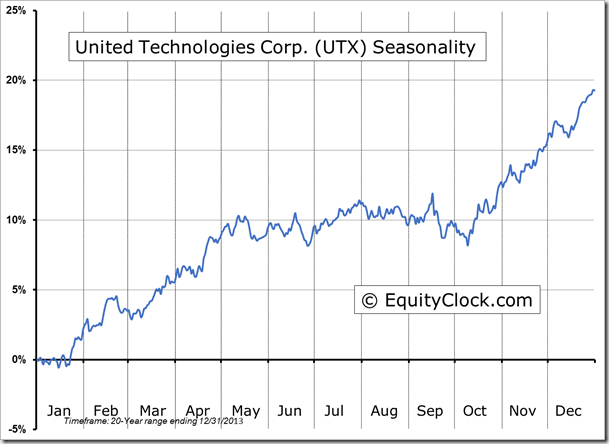
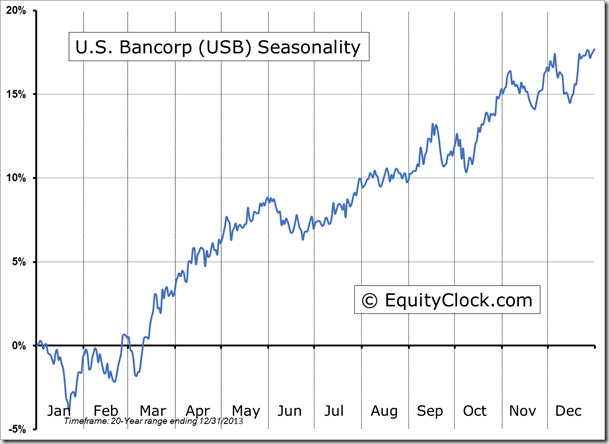
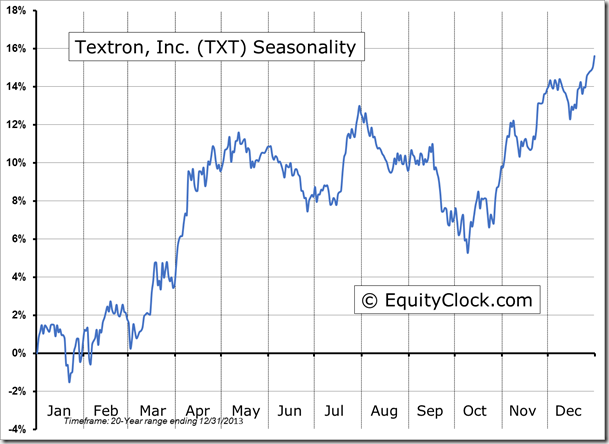
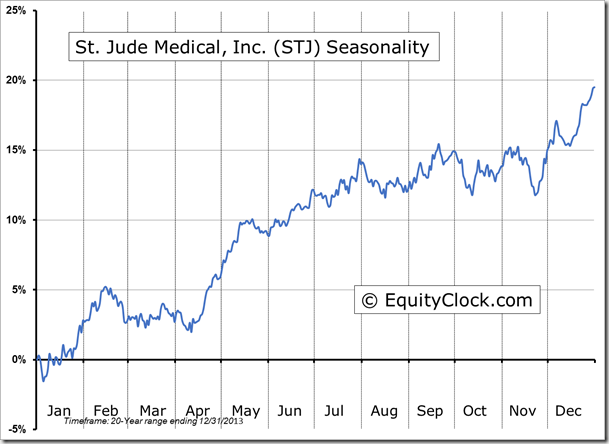
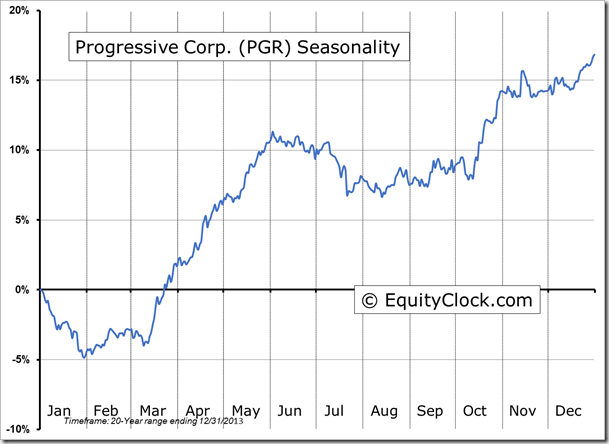
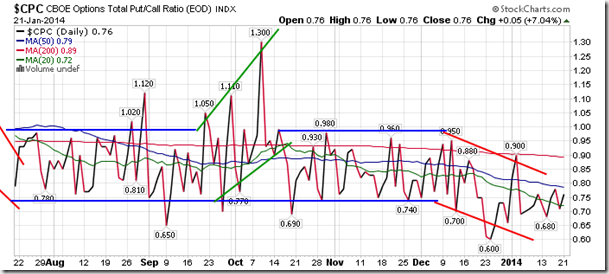
Sentiment on Tuesday, as gauged by the put-call ratio, ended bullish at 0.76.
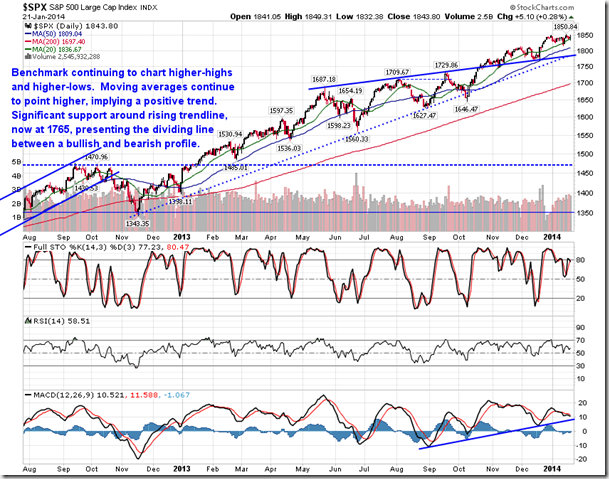
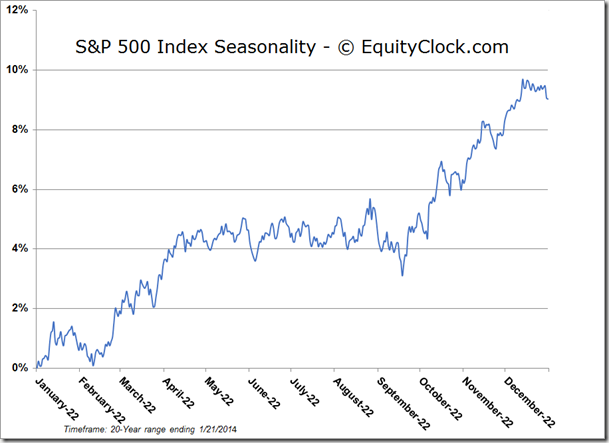
S&P 500 Index
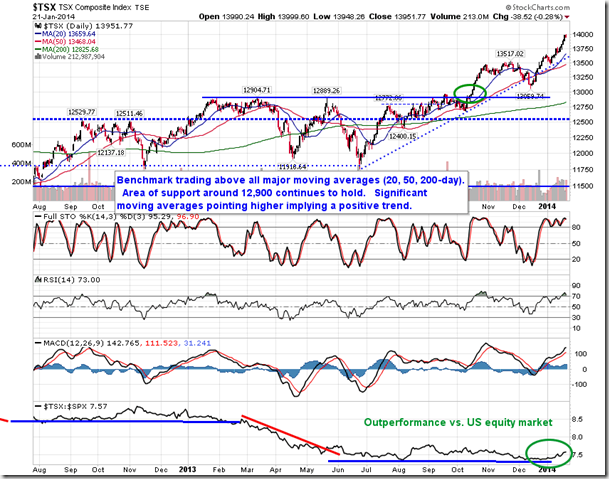
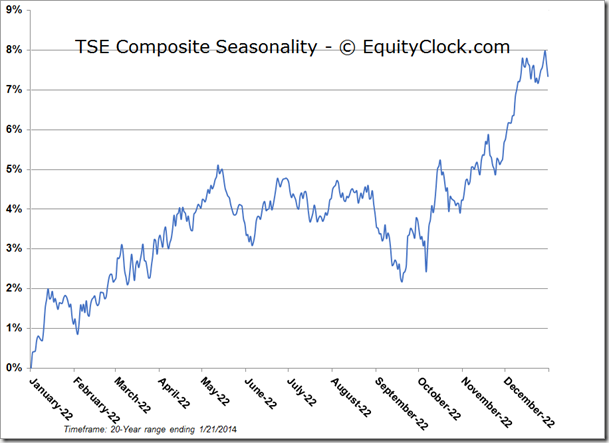
TSE Composite
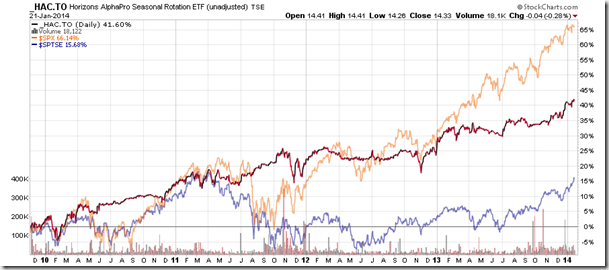
Horizons Seasonal Rotation ETF (TSX:HAC)
- Closing Market Value: $14.33 (down 0.28%)
- Closing NAV/Unit: $14.33 (down 0.12%)
Performance*
| 2014 Year-to-Date | Since Inception (Nov 19, 2009) | |
| HAC.TO | 0.21% | 43.3% |
* performance calculated on Closing NAV/Unit as provided by custodian
