Upcoming US Events for Today:
- ADP Employment Report for November will be released at 8:15am.The market expects 185,000 versus 130,000 previous.
- International Trade for October will be released at 8:30am.The market expects a deficit of $40.2B versus a deficit of $41.8B previous.
- New Home Sales for September will be released at 10:00am.The market expects 420K versus 421K previous.
- ISM Non-Manufacturing Index for November will be released at 10:00am. The market expects 55.5 versus 55.4 previous.
- Weekly Crude Inventories will be released at 10:30am.
- The Fed’s Beige Book for November will be released at 2:00pm.
Upcoming International Events for Today:
- German PMI Services for November will be released at 3:55am EST. The market expects 54.5 versus 52.9 previous.
- Euro-Zone PMI Services for November will be released at 4:00am EST. The market expects 50.9 versus 51.6 previous.
- Great Britain PMI Services for November will be released at 4:30am EST. The market expects 62.0 versus 62.5 previous.
- Euro-Zone GDP for for the Third Quarter will be released at 5:00am EST. The market expects a year-over-year decline of 0.4% versus a decline of 0.6% previous.
- Euro-Zone Retail Sales for October will be released at 5:00am EST. The market expects a year-over-year increase of 1.0% versus an increase of 0.3% previous.
- Canadian Merchandise Trade for October will be released at 8:30am EST. The market expects a deficit of $0.90B versus a deficit of $0.44B previous.
- Bank of Canada Announcement will be held at 10:00am EST. The market expects no change in rates at 1.0%.

The Markets
Stocks around the globe dipped on Tuesday as weakness in European benchmarks fuelled losses on Wall Street. A weaker than expected Producer Price Index in the Euro-Zone re-escalated the deflationary risks to the economy. The ECB meets on Thursday to discuss the policies to correct the negative price trend that recent rate cuts have thus far failed to resolve. Inflation in the US, as gauged by the 5-year treasury breakeven rate, is not faring much better with declining growth remaining fairly consistent since a peak in February. Still, the US remains well off of deflationary levels, but the trend is leaning towards that direction. Clearly current simulative monetary policies are having little impact, which can easily allow the Fed and the ECB to remain accommodative well into the future. The next Fed meeting will take place on December 18th.
Euro-Zone PPI: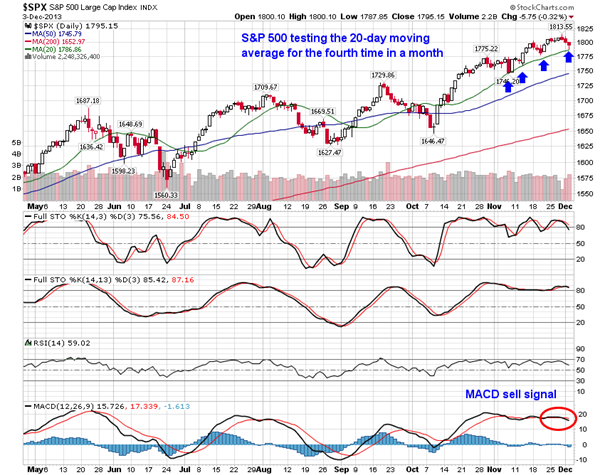
US 5-Year Treasury Breakeven Rate: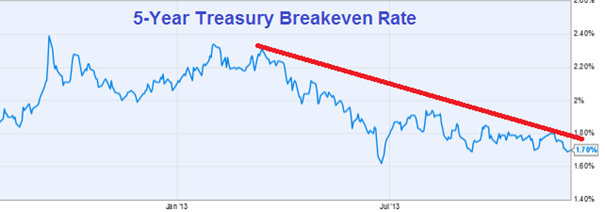
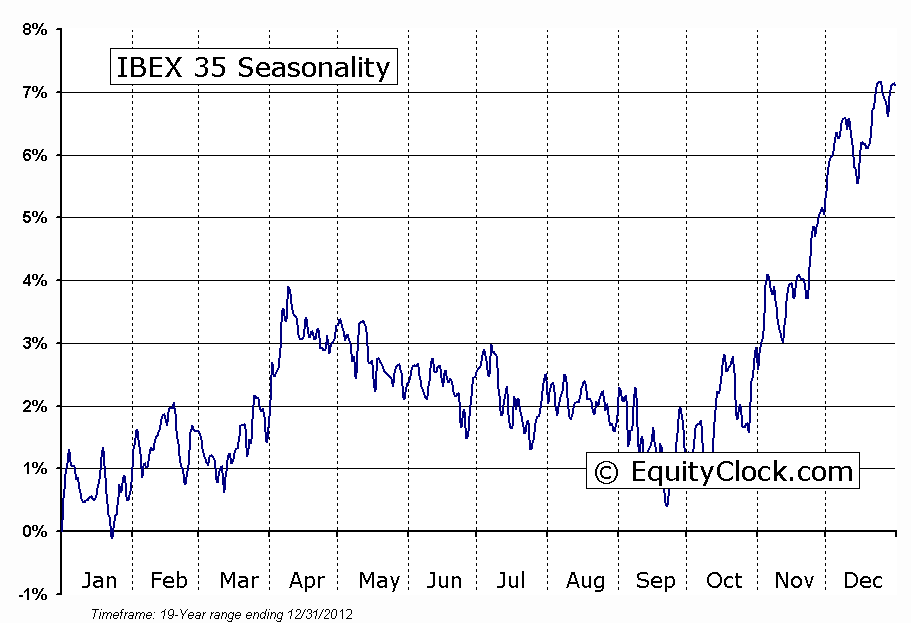
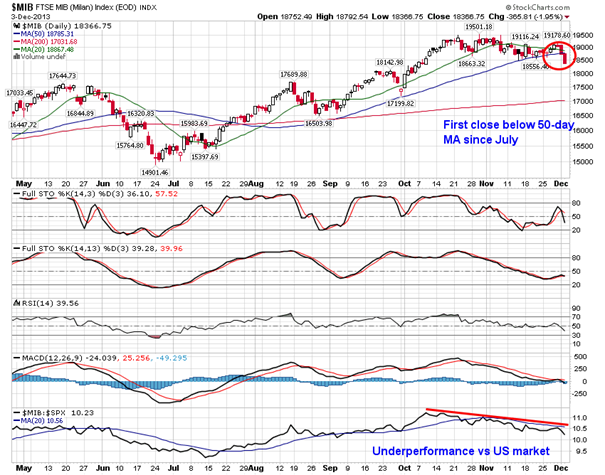
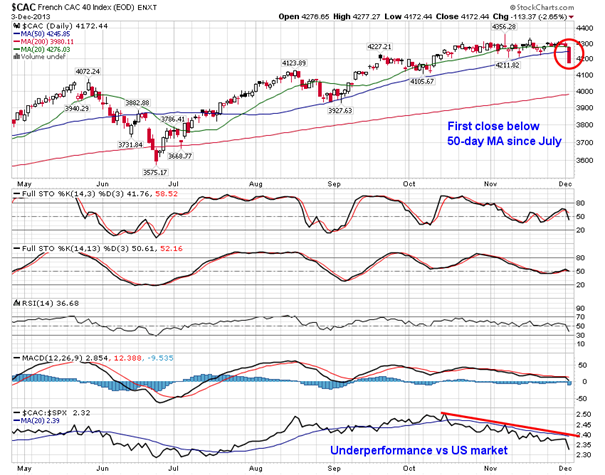
The selling pressures in Europe pushed the CAC, IBEX, and FTSE MIB to close below 50-day moving averages, the first close below this level since July. Each of these benchmarks have underperformed the US market since mid-October, a period that is typically positive for European benchmarks.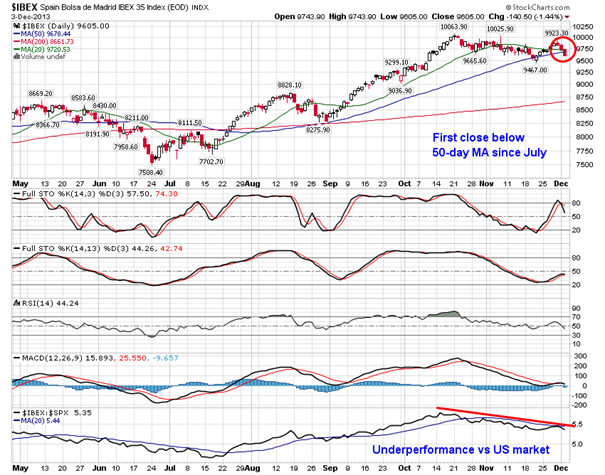
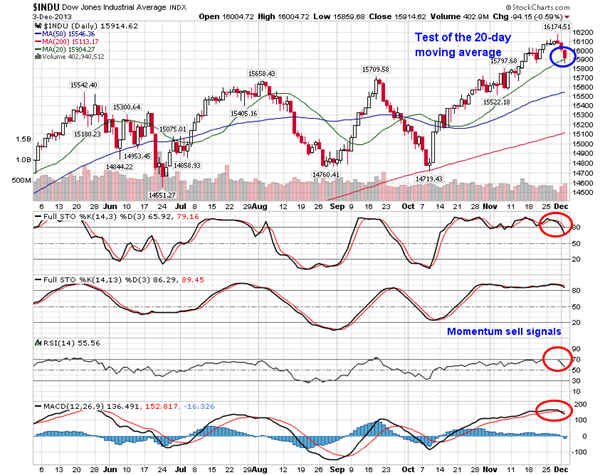
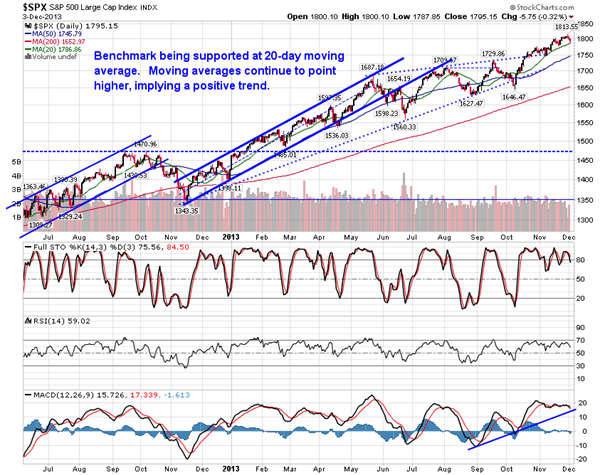
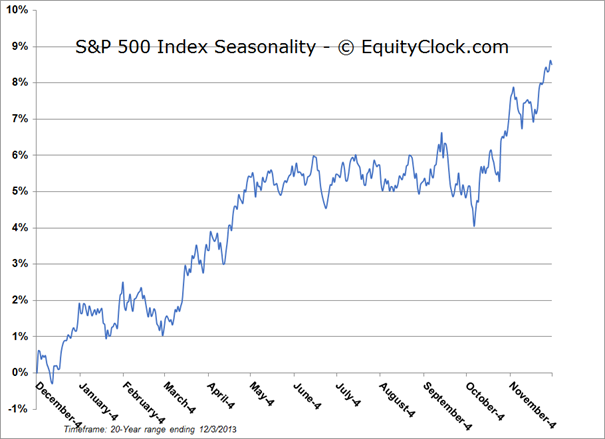
And while European stocks showed signs of breaking down, the S&P 500 tested support at the 20-day moving average for the fourth time in a month. The Dow Jones Industrial also found support at this short-term moving average. Sell signals with respect to MACD have been triggered across both benchmarks as the start of December swoon grips stocks. Weakness within the first two weeks of the month often provides ideal buying opportunities for the Santa Claus Rally period, which begins on December 15th, on average. The trend of higher-highs and higher-lows amongst US equity indices remains firmly intact, implying that any near-term weakness presents a buying opportunity.
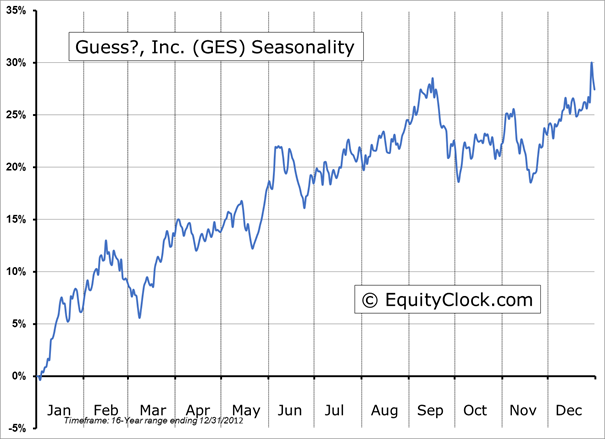
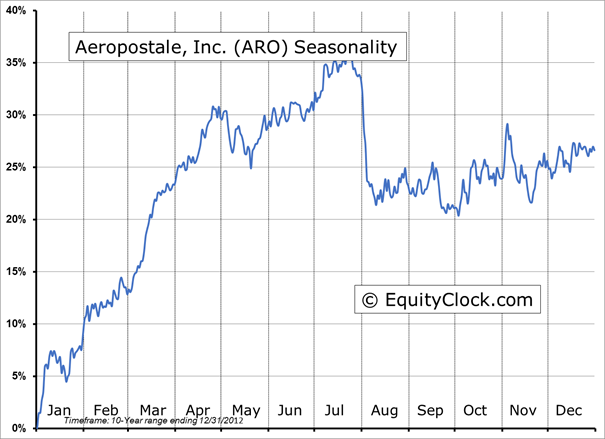
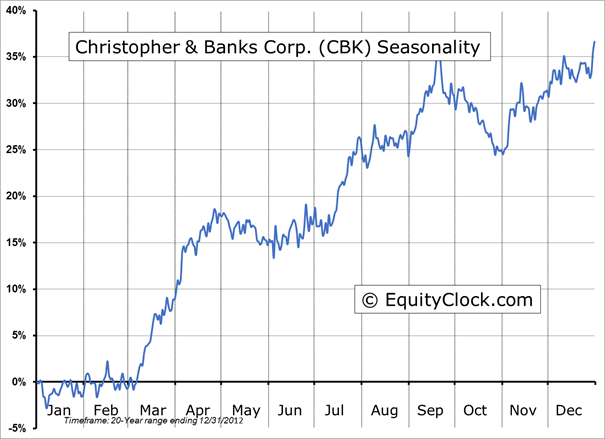
Seasonal charts of companies reporting earnings today: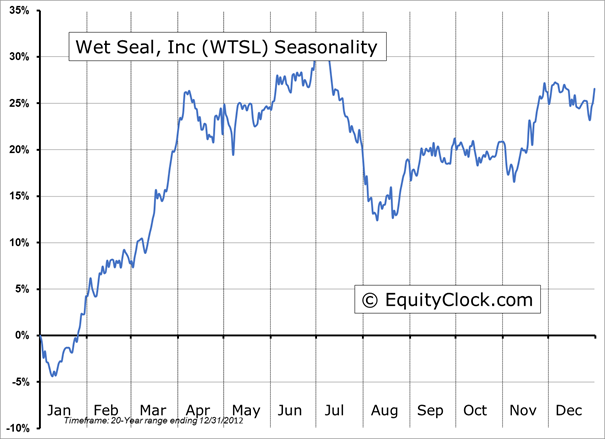
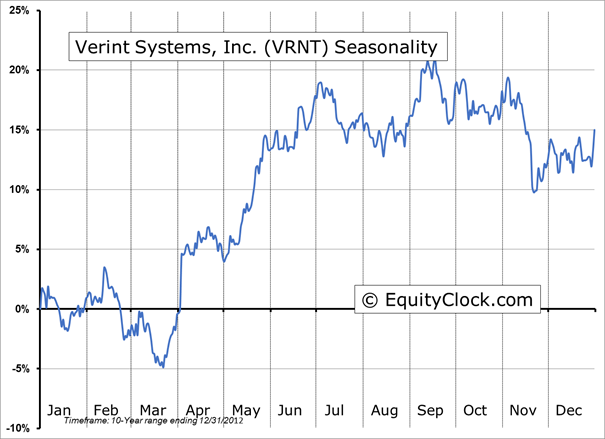
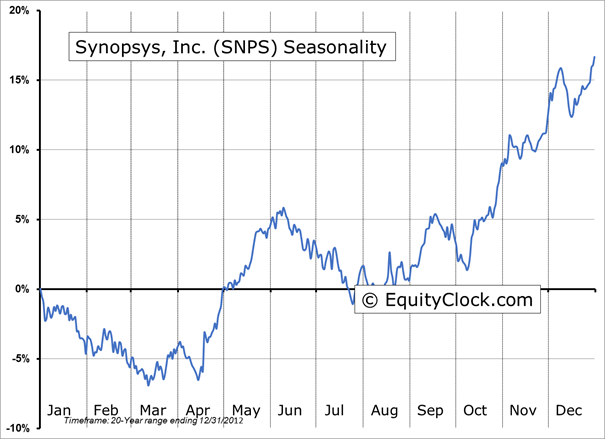
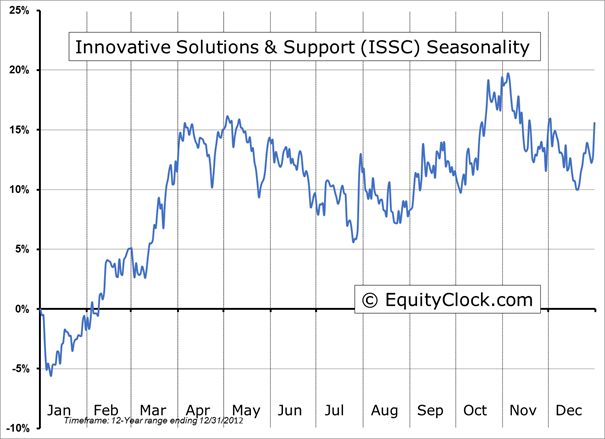

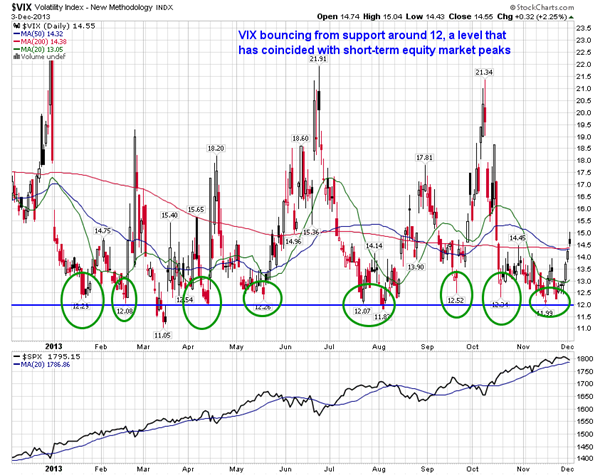
Sentiment on Tuesday, as gauged by the put-call ratio, ended bullish at 0.87. The VIX, calculated on S&P 500 call and put options, continues to bounce from long-term support at 12. The current reading of close to 15 implies that investors expect a nearly 4% move, either up or down, in the equity market over the next 30-day period.
S&P 500 Index
TSE Composite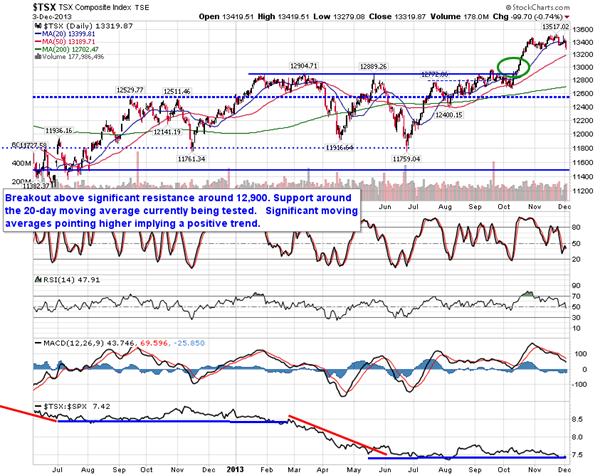

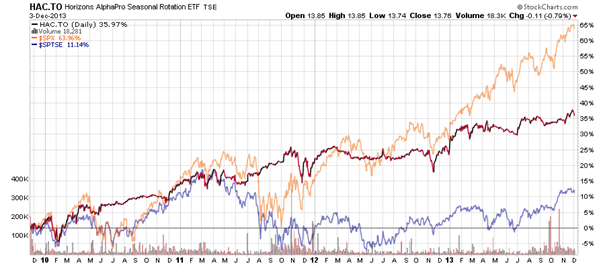
Horizons Seasonal Rotation ETF (TSX:HAC)
- Closing Market Value: $13.76 (down 0.79%)
- Closing NAV/Unit: $13.78 (down 0.65%)
Performance*
* performance calculated on Closing NAV/Unit as provided by custodian
Click Here to learn more about the proprietary, seasonal rotation investment strategy developed by research analysts Don Vialoux, Brooke Thackray, and Jon Vialoux.