Upcoming US Events for Today:
- Motor Vehicle Sales for February will be released throughout the day.
- Personal Income and Spending for January will be released at 8:30am. The market expects Personal Income to increase by 0.3% month-over-month versus no change (0.0%) previous. Personal Spending is expected to increase by 0.1% month-over-month versus an increase of 0.4% previous.
- PMI Manufacturing Index for February will be released at 8:58am.
- ISM Manufacturing Index for February will be released at 10:00am. The market expects 52 versus 51.3 previous.
- Construction Spending for January will be released at 10:00am.The market expects a month-over-month decline of 0.3% versus an increase of 0.1% previous.
Upcoming International Events for Today:
- China PMI Services for February will be released on Sunday at 8:00pm EST.
- China HSBC/Markit PMI Manufacturing for February will be released at 8:45pm EST. The market expects 48.5 versus 49.5 previous.
- German PMI Manufacturing for February will be released at 3:55am EST.
- Euro-Zone PMI Manufacturing for February will be released at 4:00am EST.
- Great Britain PMI Manufacturing for February will be released at 4:30am EST.
Recap of Friday’s Economic Events:
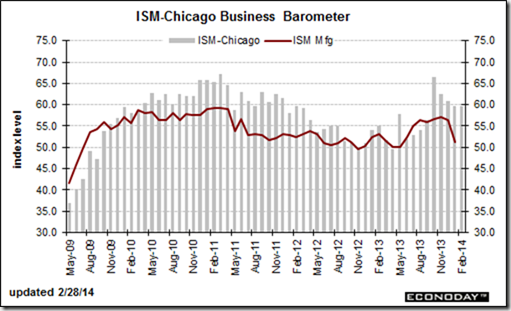
Stocks ended higher on Friday following a better than expected read on consumer confidence and an upbeat report on business conditions in the Chicago area for the month of February. Despite the less than favourable weather conditions, Chicago PMI showed an increased in activity over the month of January, coming in at 59.8 versus 59.6 previous. A large jump in employment to 59.3 is noted to be a factor behind the strength in the report. Readings above 50 suggest expanding economic conditions, something that is typical for this time of year. However, colder than average weather has strained economic activity during the first two months of the year, impacting both of the manufacturing reports out of New York and Philadelphia. The strong Chicago PMI is expected to increase expectations for the upcoming ISM Manufacturing and Non-Manufacturing reports.
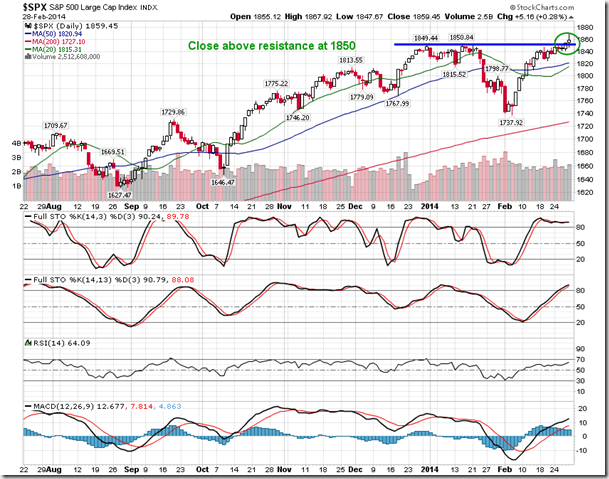
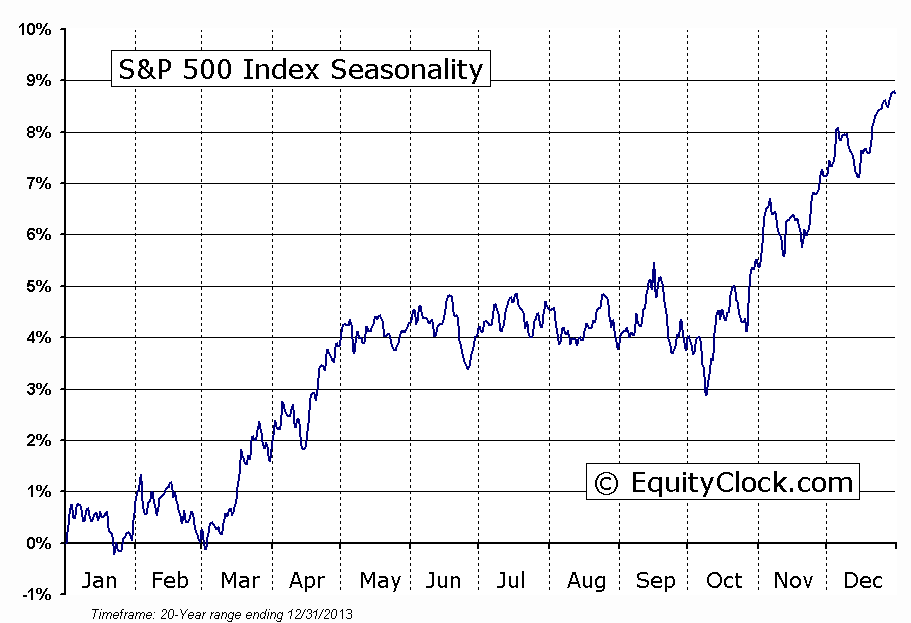
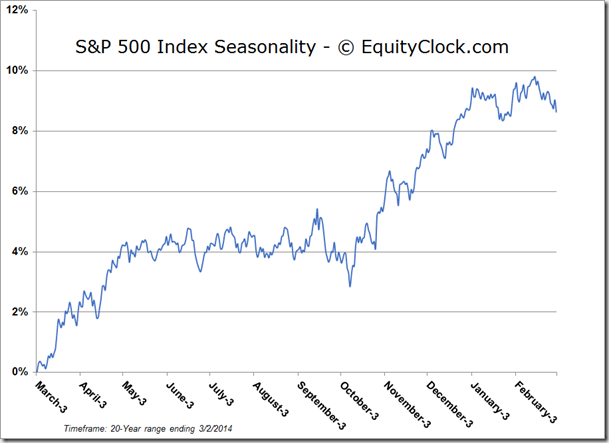
With Friday’s gains, the S&P 500 charted a new all-time closing high, ending the month on a positive note. For the month of February, the large-cap index was higher by 4.31%, reversing all of the losses recorded in January. The weak January return followed by the strong February gain opposes seasonal norms. Over the last 20 years, February has been one of the weakest months of the year, ending lower by 0.6%, on average; gains for the month of January have averaged 0.6%. Effectively, although taking an alternate path, the S&P 500 has recorded a return that is inline with historical averages by the end of February; year-to-date returns after the first two months hover around the flatline.
Seasonally, the market is entering one of the strongest times of the year. During the months of March and April, the S&P 500 has recorded gains averaging 1.6% and 2.2%, respectively, over the past 20 years; the frequency of positive results for this two month period is over 70%. The run-up to earnings season, continued economic expansion into the spring months, and IRA contributions ahead of the April 15th deadline are all factors in this March/April boost.

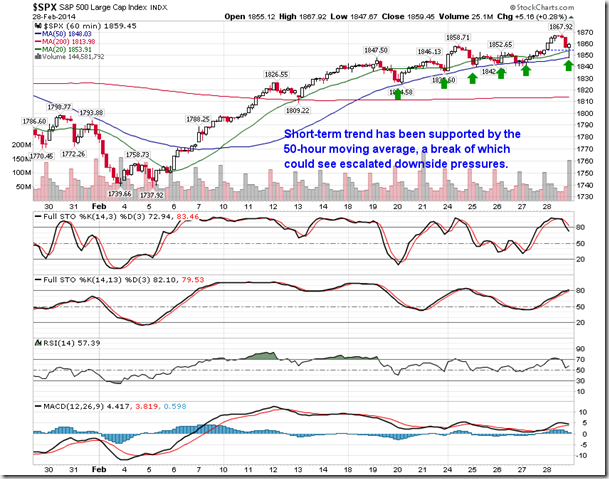
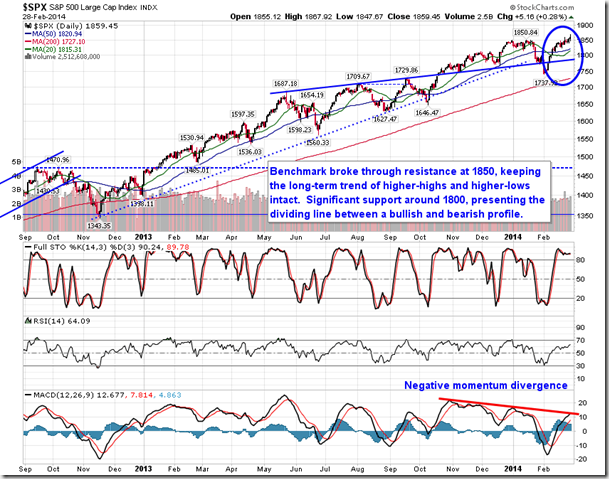
Narrowing down to a short-term glimpse of the market, the S&P 500 continues to be supported by the 50-hour moving average. Even during Friday afternoon selloff attributed to concerns over the situation in Ukraine, the benchmark bounced from this key short-term average, now at 1848. Should it break, expect escalated downside pressures.
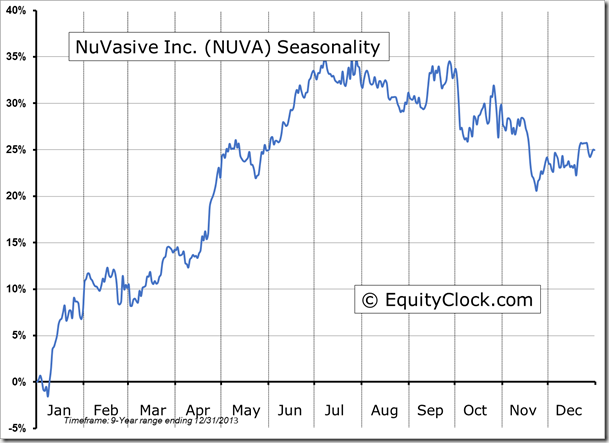
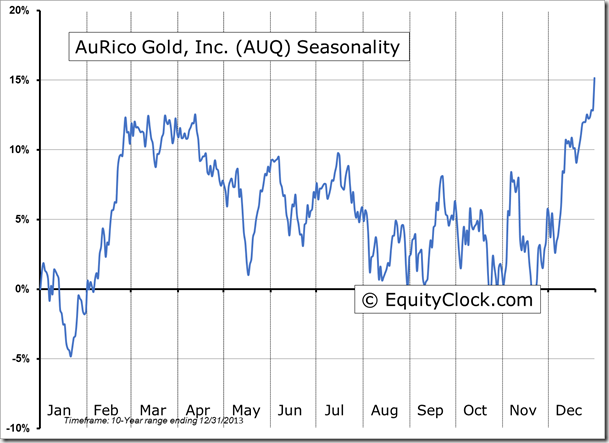
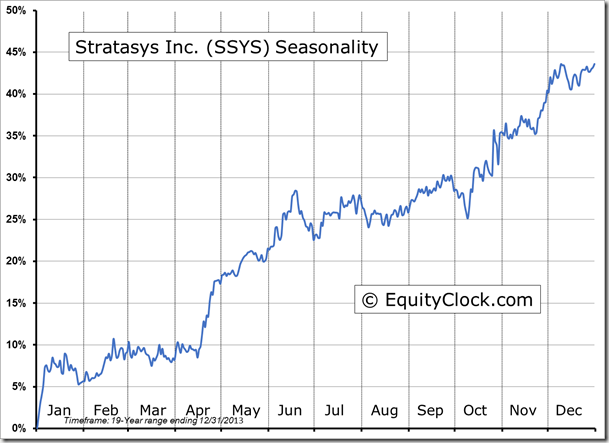
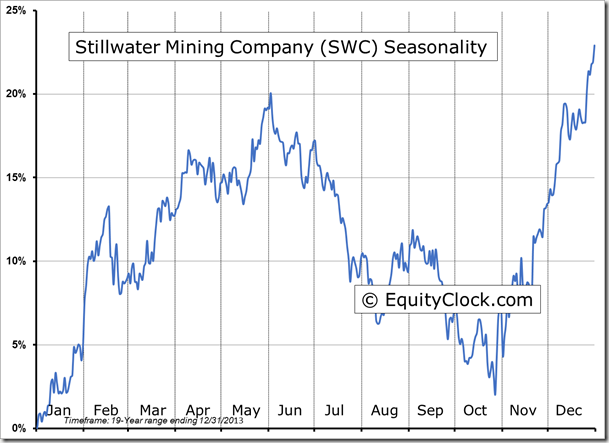
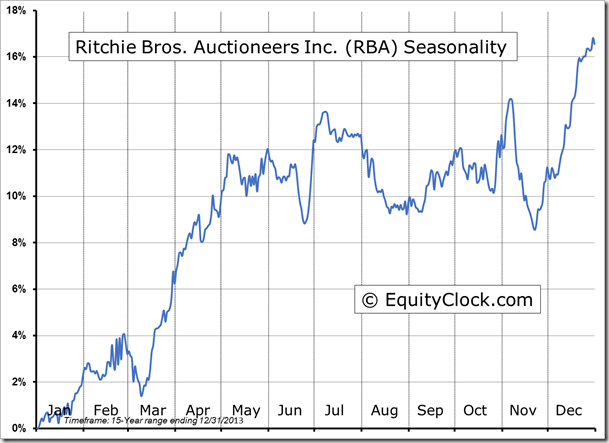
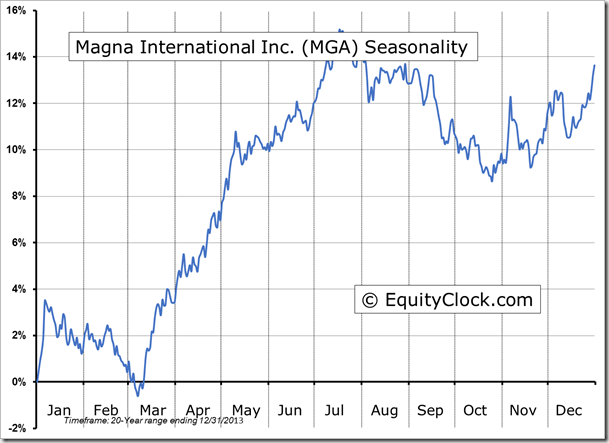
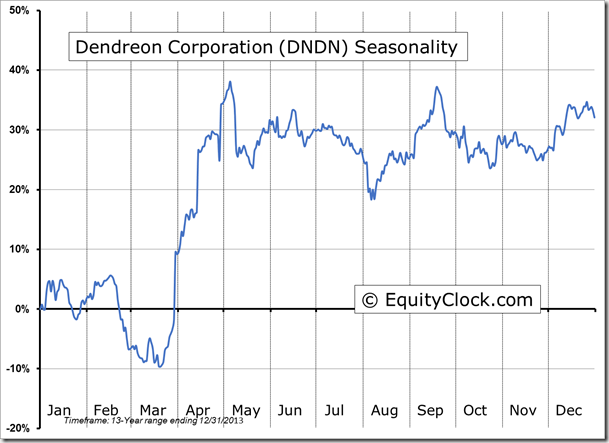
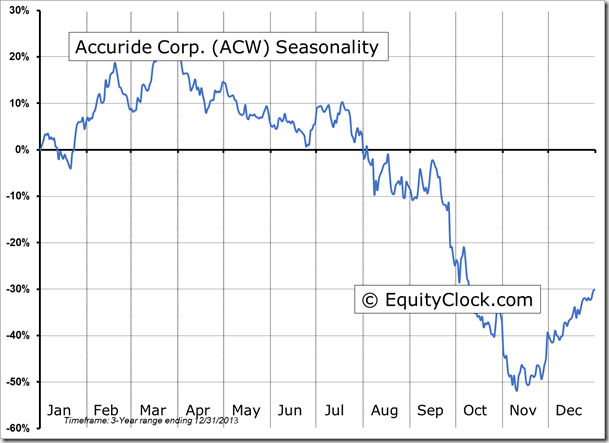
Seasonal charts of companies reporting earnings today:
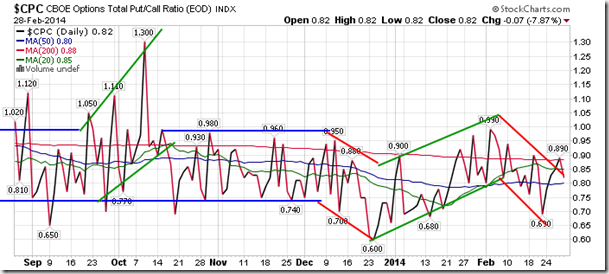
Sentiment on Friday, as gauged by the put-call ratio, ended bullish at 0.82.
S&P 500 Index
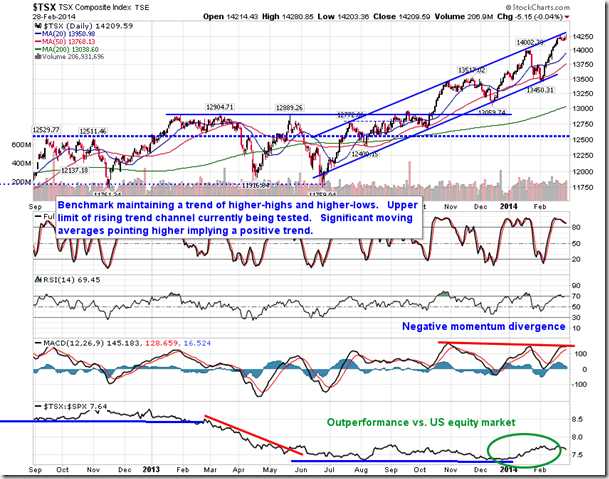
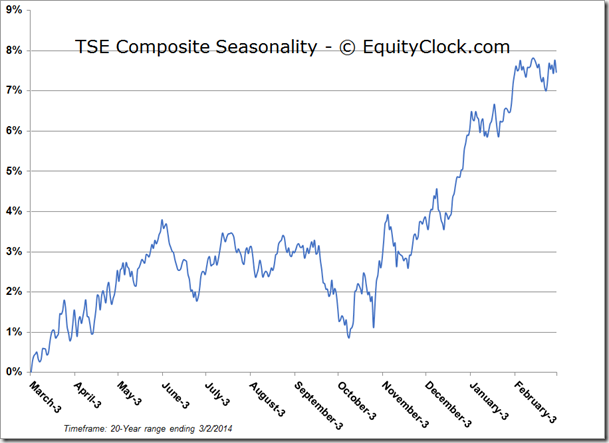
TSE Composite
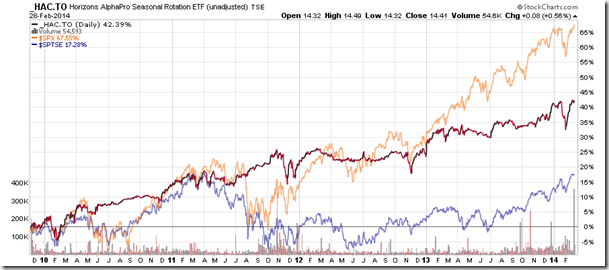
Horizons Seasonal Rotation ETF (HAC)
- Closing Market Value: $14.41 (up 0.56%)
- Closing NAV/Unit: $14.40 (up 0.15%)
Performance*
| 2014 Year-to-Date | Since Inception (Nov 19, 2009) | |
| HAC.TO | 0.70% | 44.0% |
* performance calculated on Closing NAV/Unit as provided by custodian
