Upcoming US Events for Today:- Weekly Crude Inventories will be released at 10:30am.
- FOMC Minutes will be released at 2:00pm.
Upcoming International Events for Today:
- Japan All-Industry Activity Index for June will be released at 12:30am EST. The market expects a month-over-month decline of 0.4% versus an increase of 0.6% previous.
- German PPI for July will be released at 2:00am EST. The market expects a year-over-year decline of 0.7%, consistent with the previous report.
- Bank of England Minutes will be released at 4:30am EST.
- Great Britain Industrial Trends Survey for August will be released at 6:00am EST. The market expects Total Orders to show 4 versus 2 previous.
- Canadian Wholesale Sales for June will be released at 8:30am EST. The market expects a month-over-month increase of 0.5% versus an increase of 2.2% previous.
- Japan Flash Manufacturing PMI for August will be released at 9:35pm EST. The market expects 51.5 versus 50.5 previous.
- China Flash Manufacturing PMI for August will be released at 9:45pm EST. The market expects 51.5 versus 51.7 previous.
The Markets
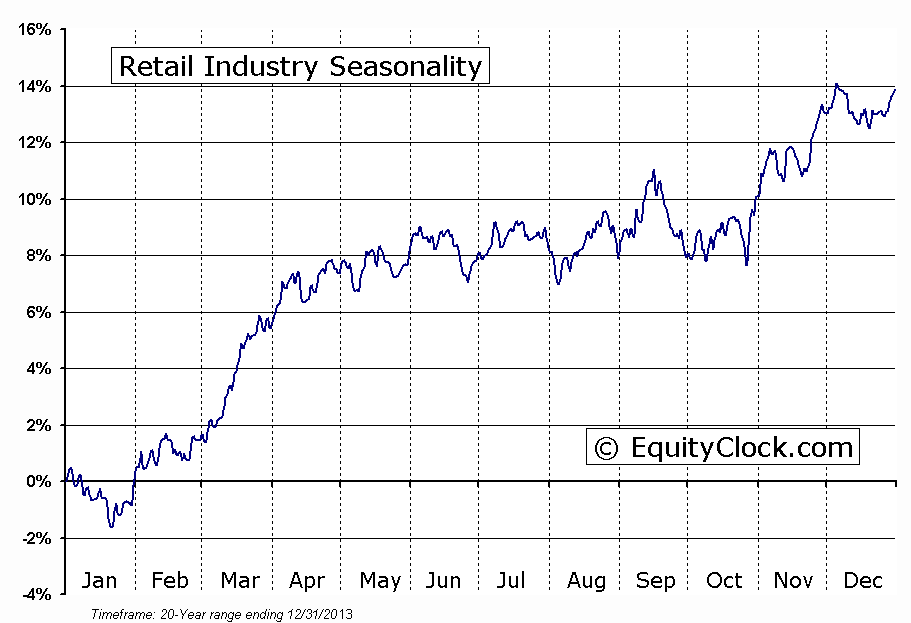
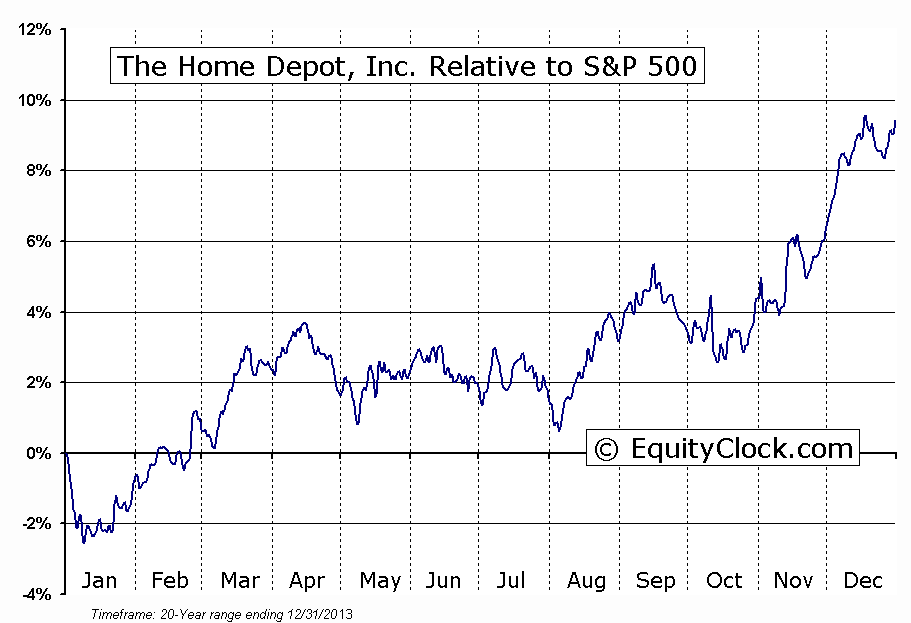
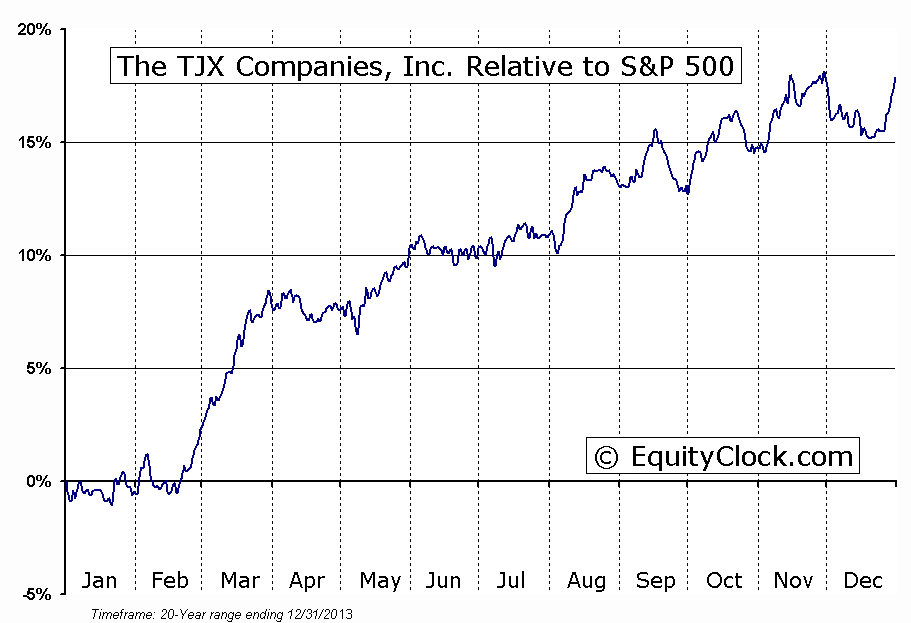
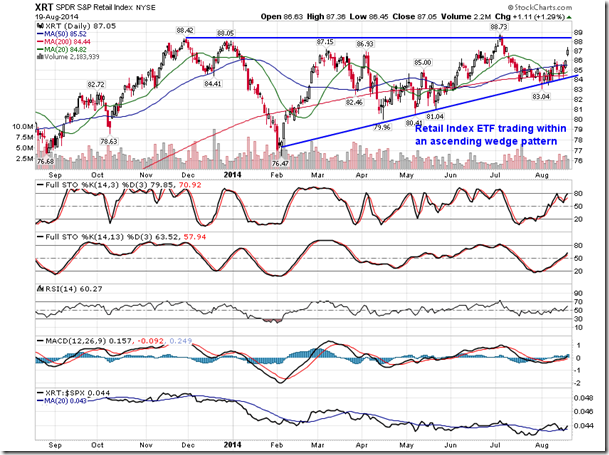
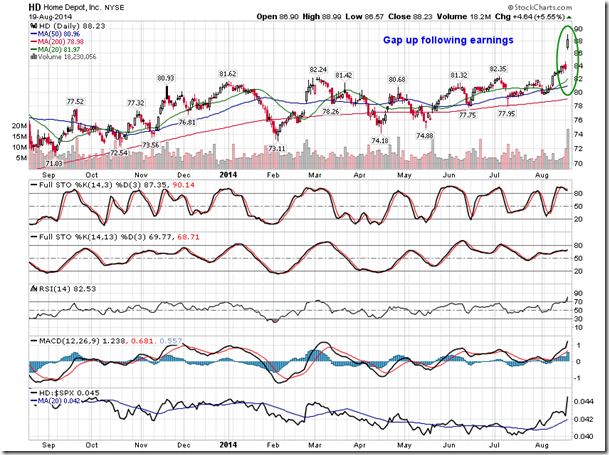
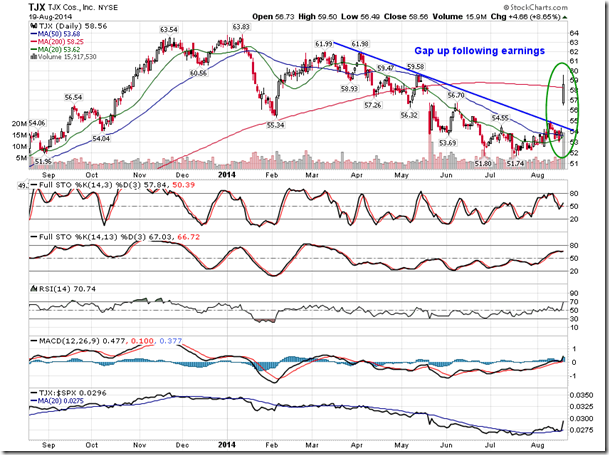
Stocks ended higher following upbeat earnings from TJX Companies Inc (NYSE:TJX) and Dow component Home Depot Inc (NYSE:HD).Shares of each company gapped up at the open, fuelling the broad retail sector to strong gains on the session. Retail stocks have been struggling in 2014, remaining below the flat-line for the year as investors find reasons to be concerned of the strength of the consumer. With oil prices plunging and the back to school season upon us, investors are being enticed back into discretionary allocations. The Retail Index ETF (SPDR S&P Retail (NYSE:XRT))has been supported by a rising trendline stemming from the February low; an ascending triangle is becoming apparent, a bullish setup that would be confirmed by a break above the year-to-date high around $89. The retail industry has recorded gains, on average, in the weeks leading up to the start of the school season in September; the more predominant period of seasonal strength occurs from October to early December, often referred to as the Christmas shopping season.
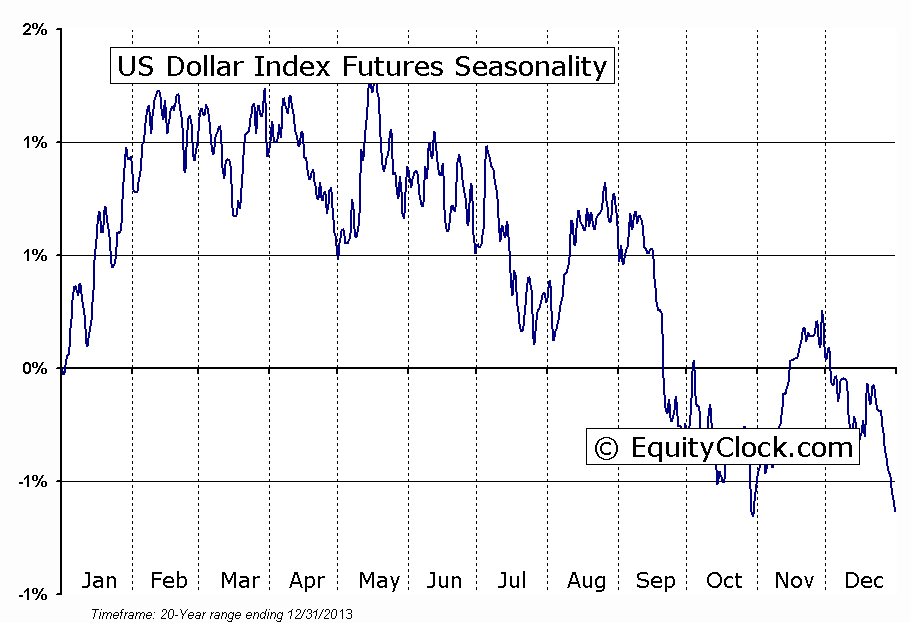
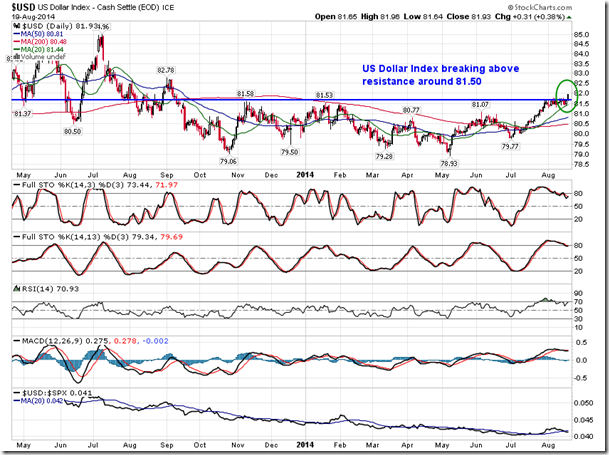
The positive returns in equity markets comes amidst further gains in the US Dollar, a trend that is not seasonally typical for this time of year. The US Dollar Index broke firmly above resistance around 81.50, moving to the highest level in almost a year. The currency benchmark has been supported by a rising 20-day moving average over recent weeks, implying a positive short-term trend. The 200-day moving average is also starting to point positive for the first time this year, implying positive long-term momentum. Seasonally, the US Dollar Index is frequently weak during the months of September and October, recording declines 60% and 75% of the time, respectively.
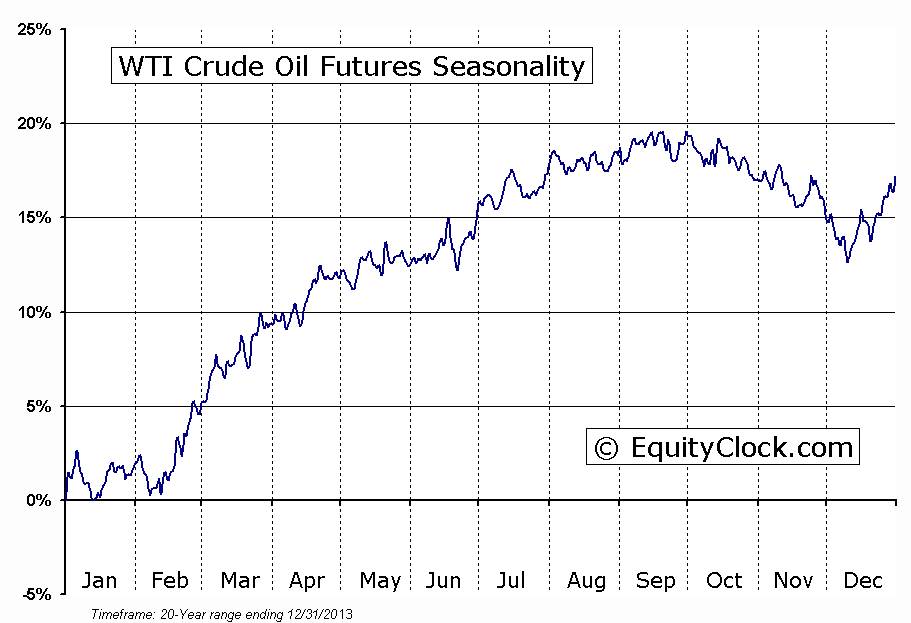
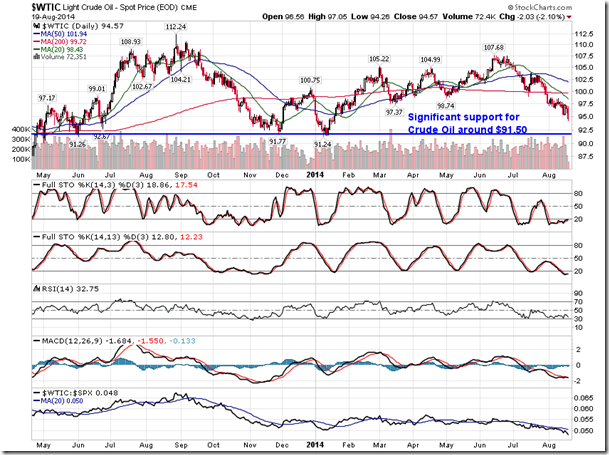
The stronger dollar continues to have an impact on the commodity market. The CRB commodity index is now down around 8.4% from the June peak. Commodities was one of the best performing asset classes during the first half of the year, but now it is quickly becoming the worst. If lower commodity prices are sustained, consumer stocks may benefit. The price of oil, which was a significant reason for the strength in the CRB index during the first half of the year, has declined significantly since June from highs of over $100 a barrel. Sustained lower oil prices typically ease the strain on the consumer, a much needed benefit during the critical season for retailers ahead. The energy commodity continues to hover around oversold levels, but signs of bottoming have yet to become apparent. Significant support exists around $91.50 The price of Oil enters a period of seasonal weakness in September, following the conclusion of the summer driving season.
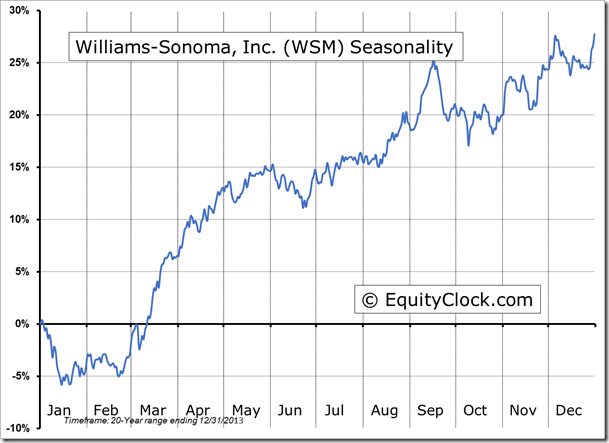
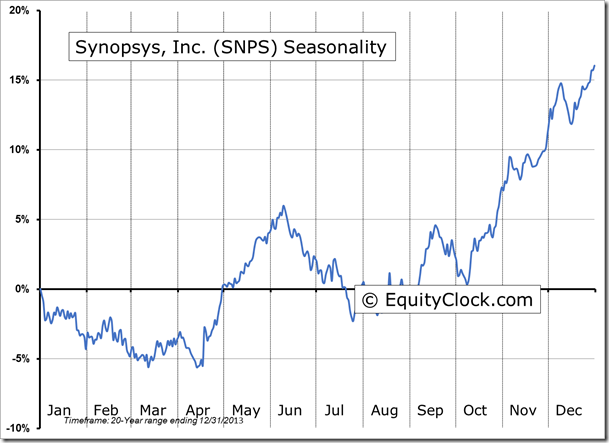
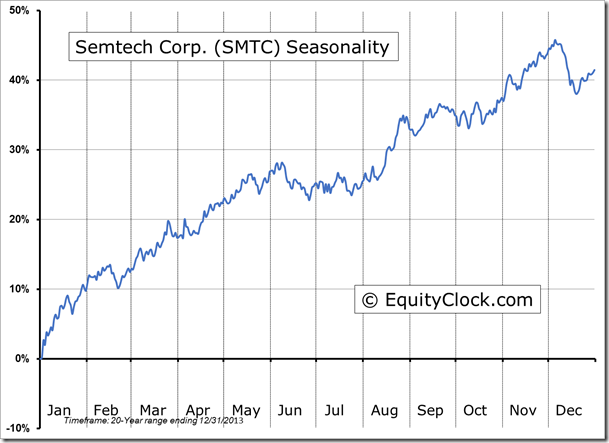
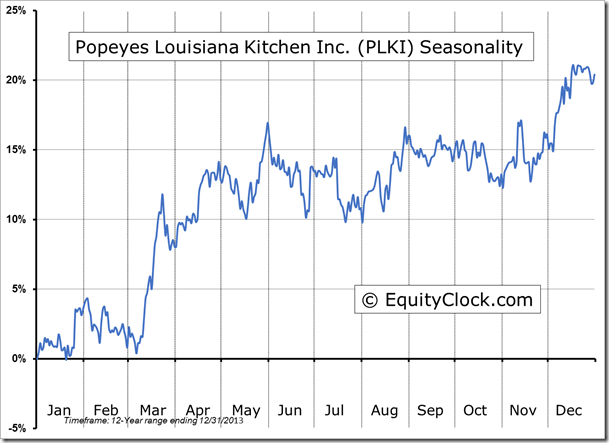
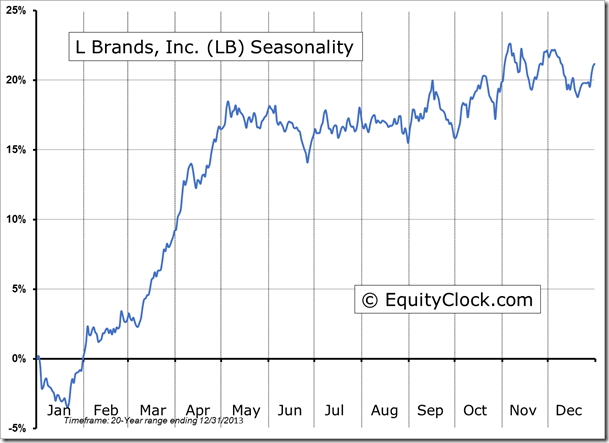
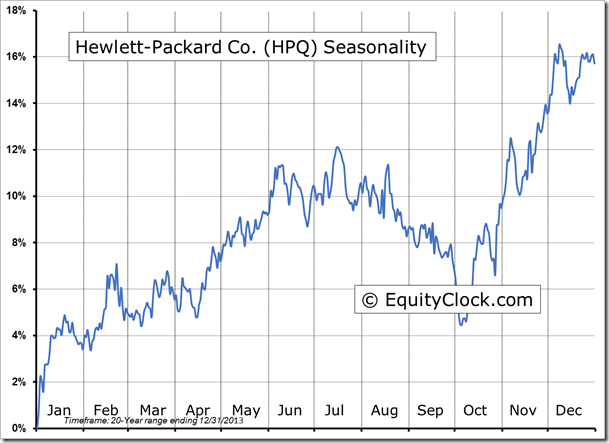
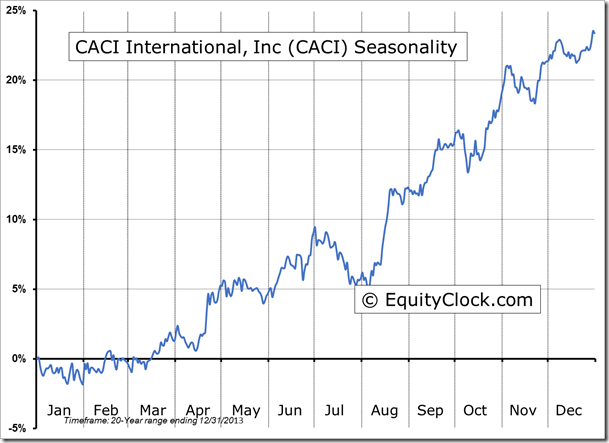
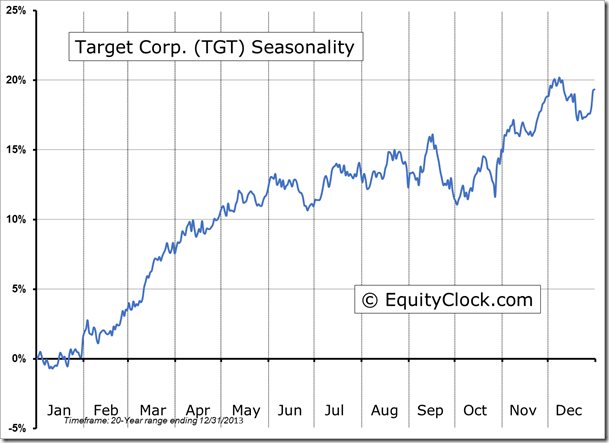
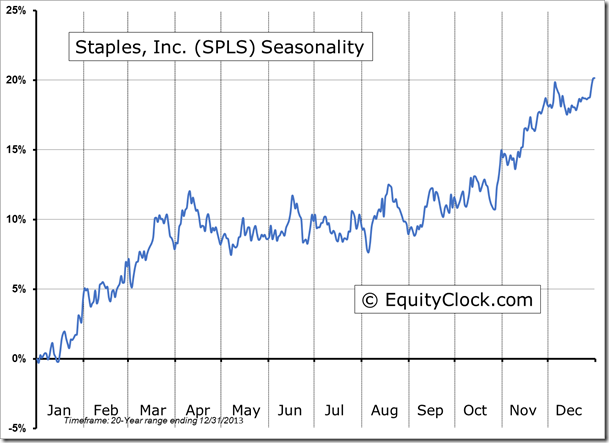
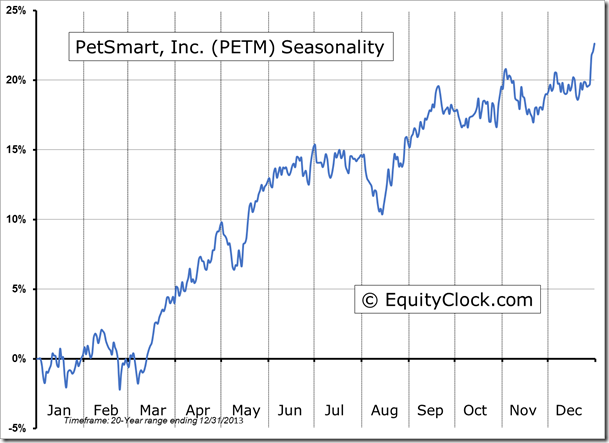
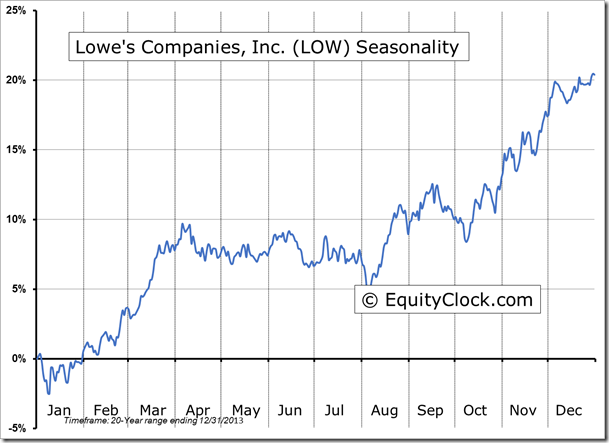
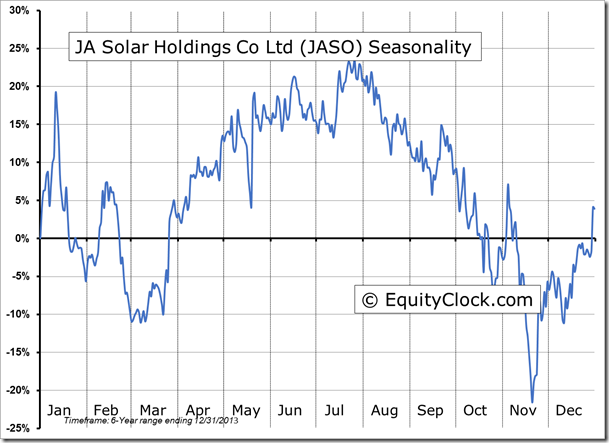
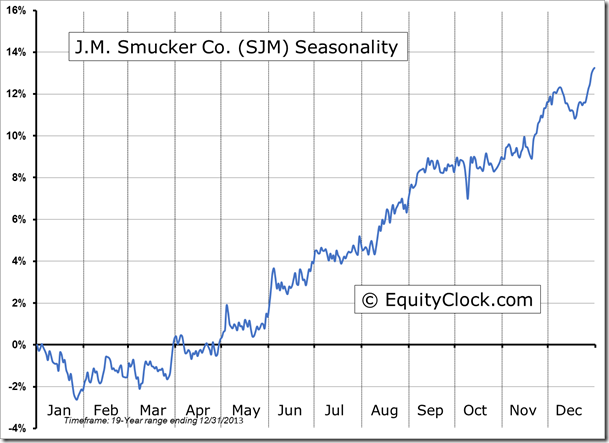
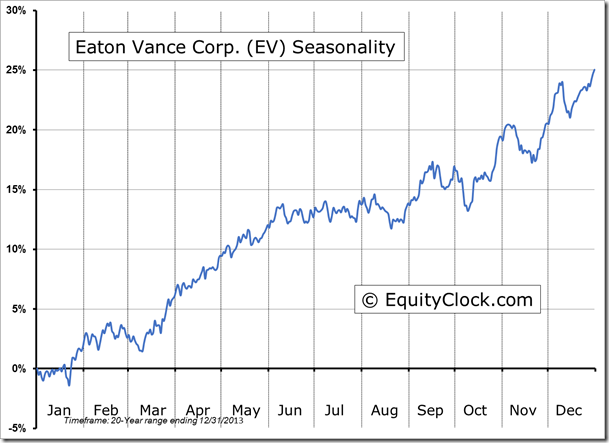
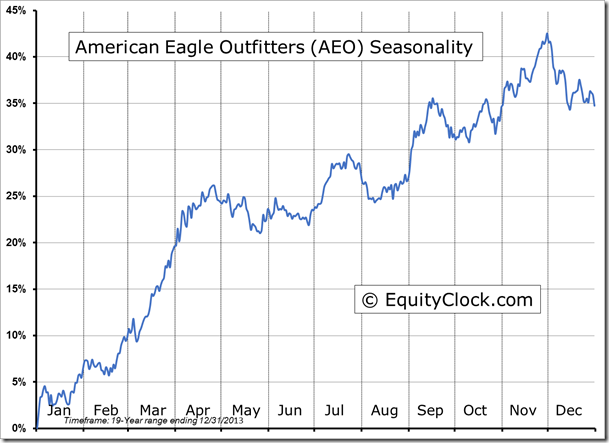
Seasonal charts of companies reporting earnings today:
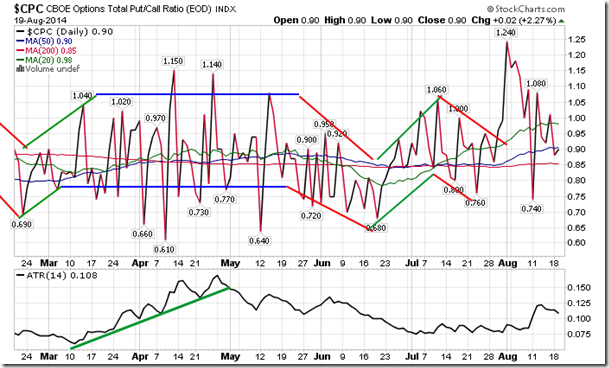
Sentiment on Tuesday, as gauged by the put-call ratio, ended bullish at 0.90.
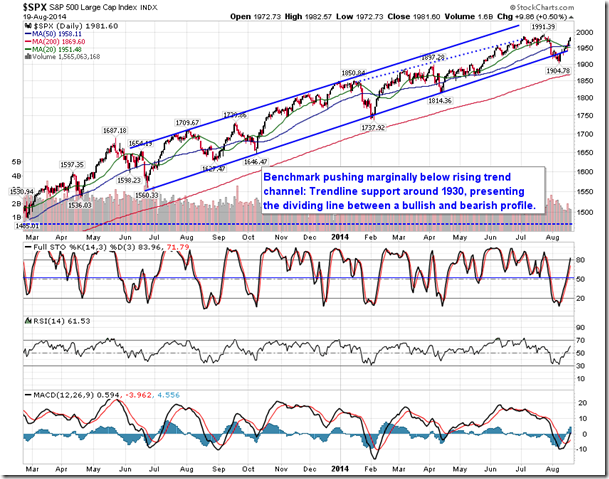
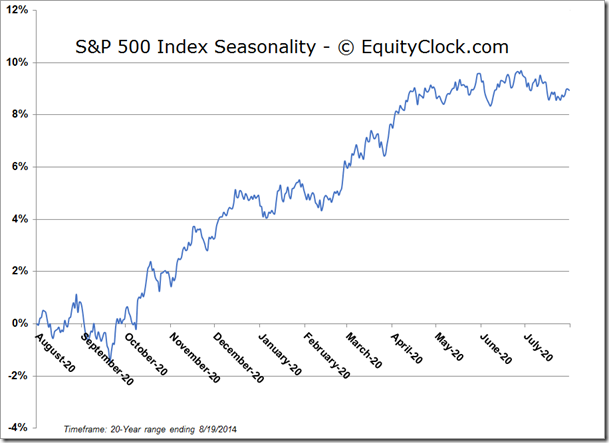
S&P 500 Index
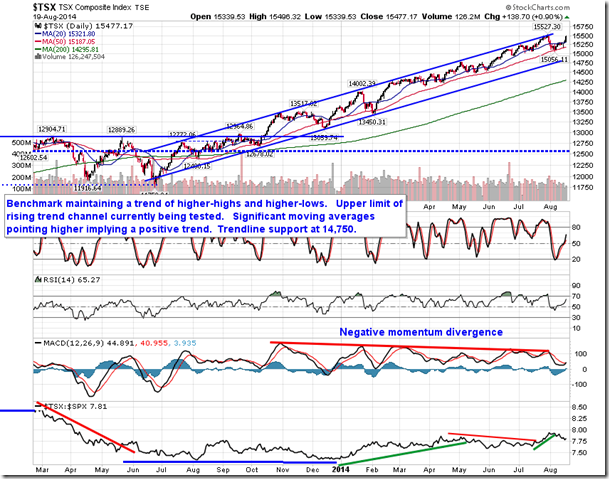
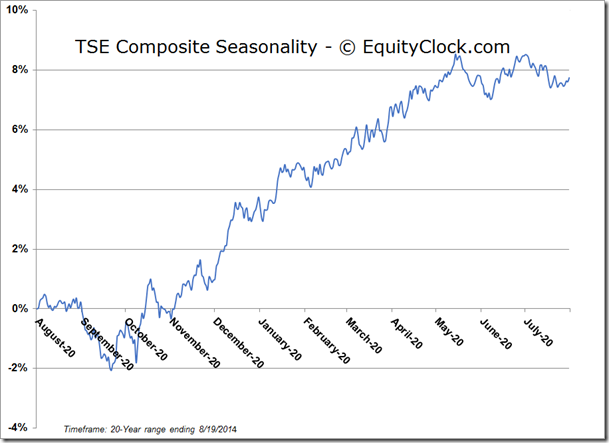
TSE Composite
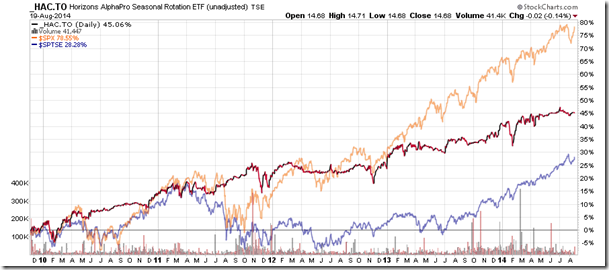
Horizons Seasonal Rotation ETF (TO:HAC)
- Closing Market Value: $14.68 (down 0.14%)
- Closing NAV/Unit: $14.69 (down 0.08%)
Performance*
| 2014 Year-to-Date | Since Inception (Nov 19, 2009) | |
| HAC.TO | 2.73% | 46.9% |
* performance calculated on Closing NAV/Unit as provided by custodian
