Upcoming US Events for Today:- Chain Store Sales for March will be released throughout the day.
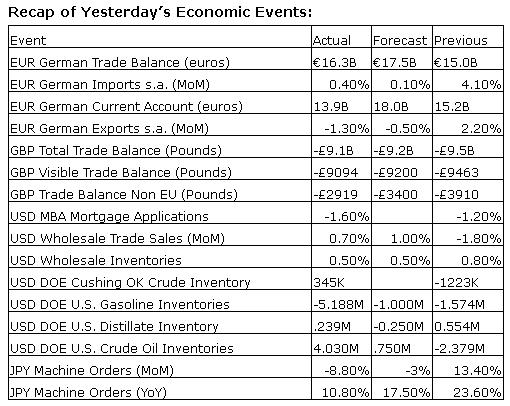
- Weekly Jobless Claims will be released at 8:30am. The market expects Initial Claims to show 318K versus 326K previous.
- Import/Export Prices for March will be released at 8:30am.
- Treasury Budget for March will be released at 2:00pm. The market expects –$132.8B versus –$193.5B previous.
Upcoming International Events for Today:
- Bank of England rate announcement will be released at 7:00am EST. The market expects no change at 0.50%.
- Canadian New House Price Index for February will be released at 8:30am EST. The market expects a month-over-month increase of 0.2% versus an increase of 0.3% previous.
- China Consumer Price Index for March will be released at 9:30pm EST. The market expects a year-over-year increase of 2.4% versus an increase of 2.0% previous. Producer Price Index is expected to decline by 2.2% versus a decline of 2.0% previous.
The Markets
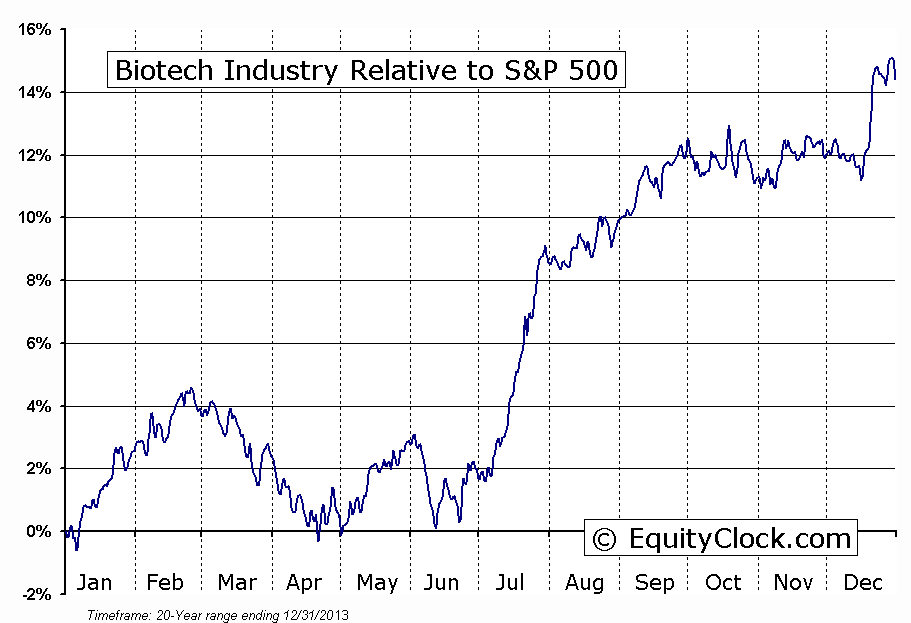
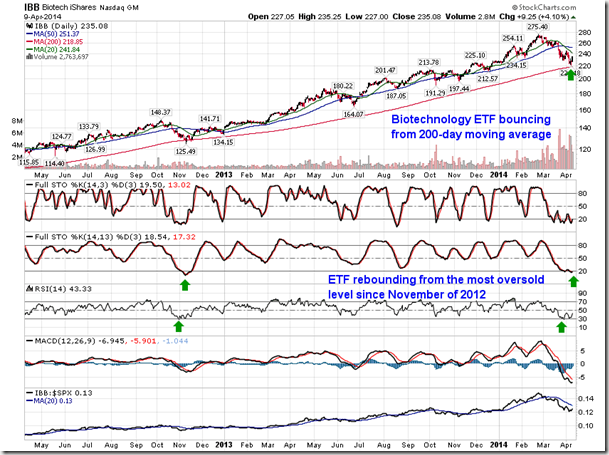
Stocks surged higher on Wednesday as investors welcomed the latest FOMC Minutes. The committee held a special meeting early last month that the market was unaware of to discuss forward guidance. It was agreed that the 6.5% unemployment target to trigger a rate increase was outdated, suggesting that the Fed will remain accommodative despite any milestones that may be hit. The unemployment rate recently hit a recovery low of 6.6%, leading many market participants to believe that a rate increase was near. The renewed dovish stance sent major equity benchmarks higher by over 1%, more than doubling the positive returns achieved prior to the release of the Fed minutes. Investors flipped back to cyclical sectors, buying Material, Technology, and Industrial stocks, while booking profits in the recently strong Utilities sector. Beaten down momentum stocks, including the Biotechnology industry, saw the greatest gains on the day as investors unwound negative bets accumulated over recent sessions. The Biotechnology ETF (IBB) recently became the most oversold since November of 2012, exhausting downside pressures and leading to the present bounce from around a rising 200-day moving average; resistance for ETF is implied around the 50-day moving average, currently at $251.37. Biotechnology remains seasonally negative through to mid-April.
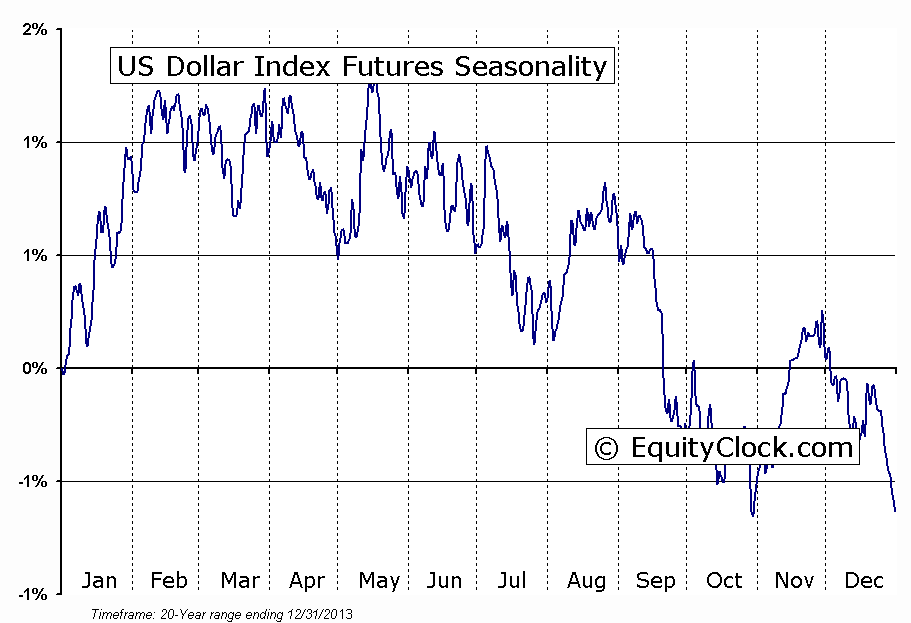
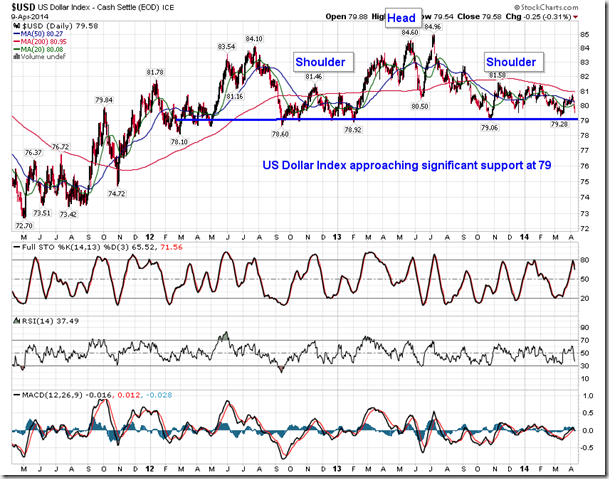
The FOMC minutes put continued pressure on the US Dollar, which is lower for the fourth day in a row compared to a benchmark of global currencies. The US Dollar Index remains in an intermediate negative trend, charting a lower high a few days ago below the January peak. The currency benchmark is trending back towards long-term support around 79, which also marks the neckline of a massive head-and-shoulders topping pattern. Downside target, should horizontal support at 79 be broken, of the bearish pattern points to 73, back to levels last seen in 2011. US Dollar weakness has the power to continue to support US equity market strength as assets priced in the domestic currency become cheaper to foreigners. Although volatile, seasonal tendencies are relatively neutral for the US Dollar Index through to July.
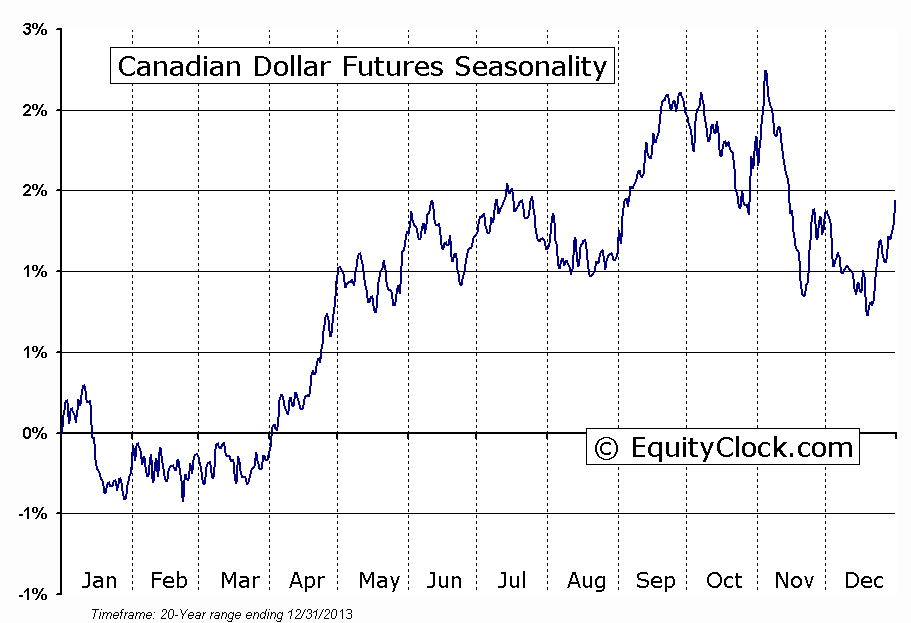
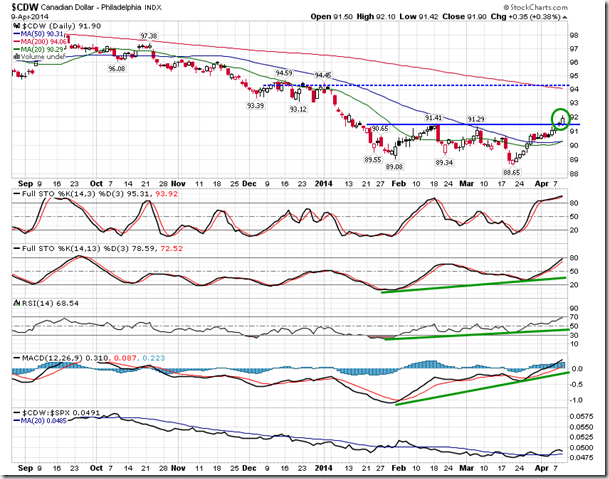
And as the US Dollar posted declines, the Canadian Dollar continued to gain, breaking through resistance around $0.915. Both the 20 and 50-day moving averages for the currency are starting to curl higher, suggesting a change of the short and intermediate trend from negative to positive. Momentum indicators continue to trend higher, fuelling the recent breakout. Next level of resistance can be found around $0.94, also equivalent to the 200-day moving average. The Canadian Dollar remains seasonally positive through the end of April.
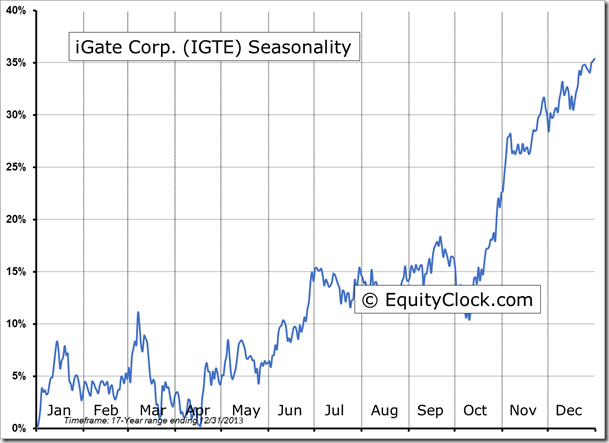
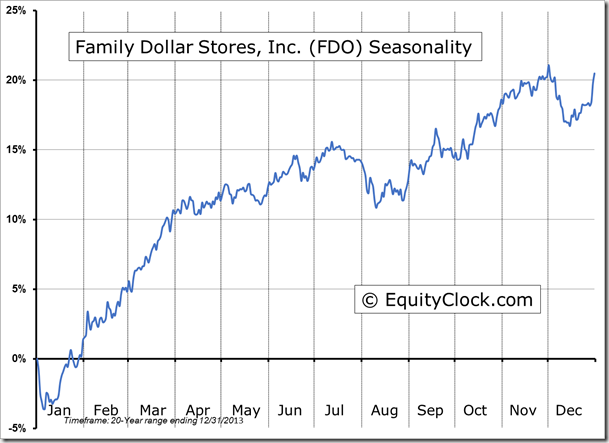
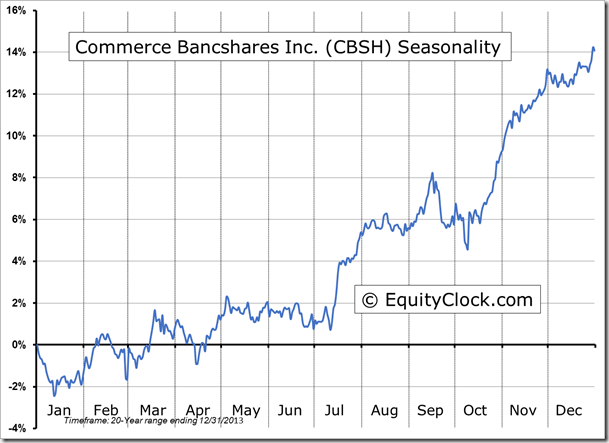
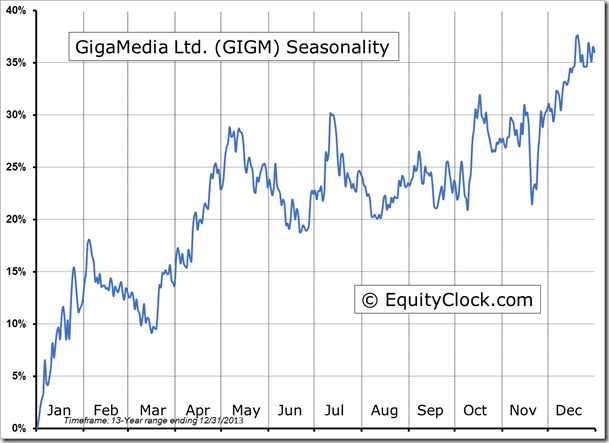
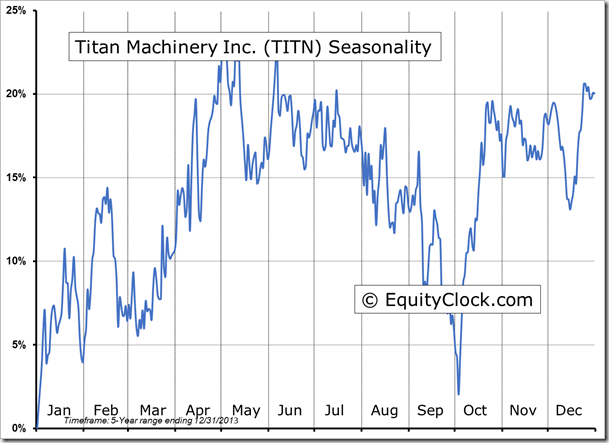
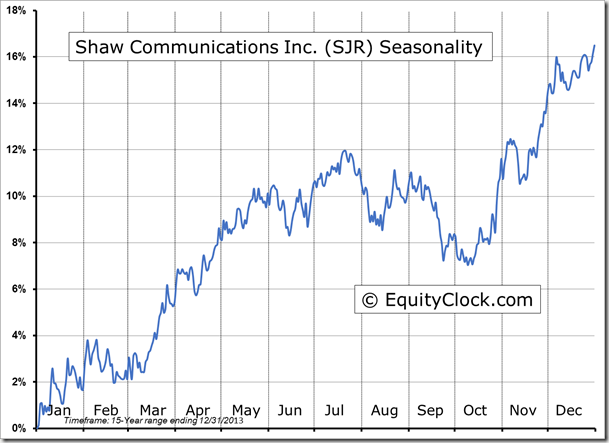
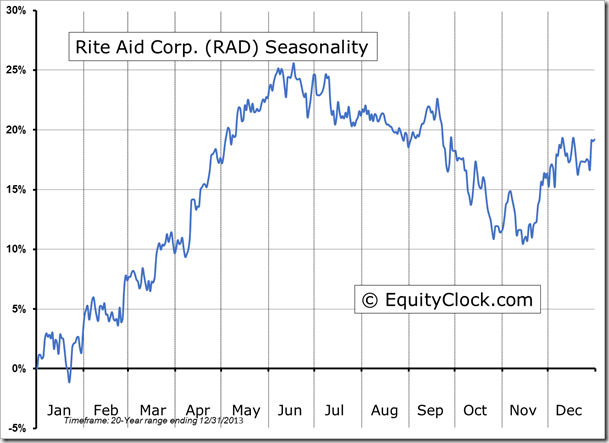
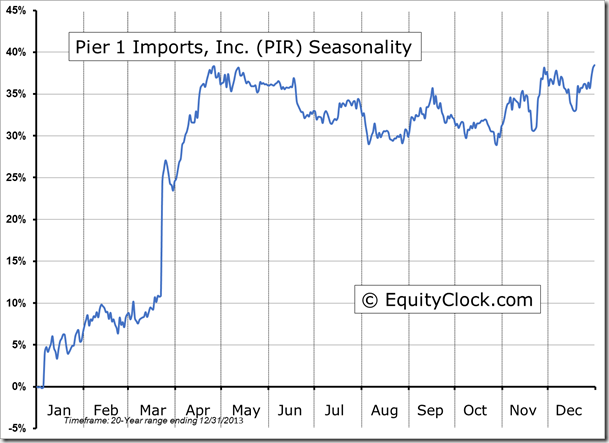
Seasonal charts of companies reporting earnings today:
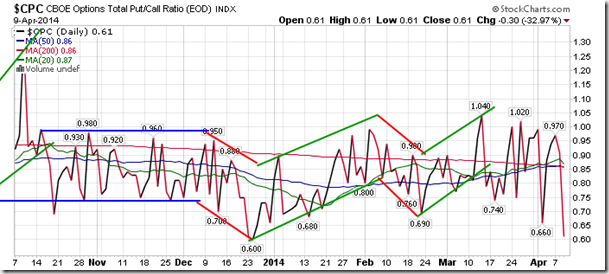
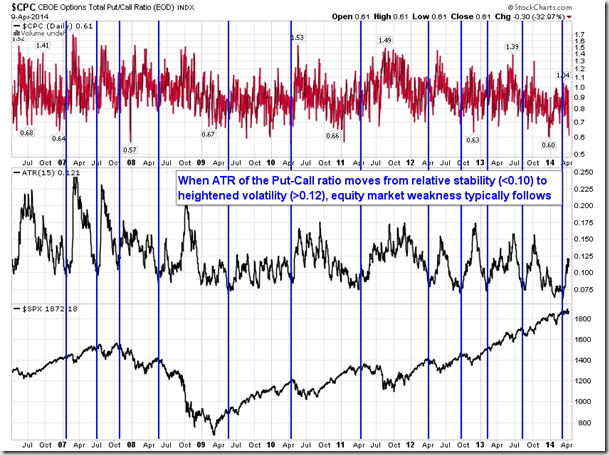
Sentiment on Wednesday, as gauged by the put-call ratio, ended overly bullish at 0.61. The ratio opened the session at a neutral 0.92 and quickly gravitated towards a bullish slant, trading to a low of 0.47, the lowest reading of the year. Over the last couple of weeks, the ratio has traded from the high of the year, just over 1, to the low of the year, which was charted on Wednesday. The recent volatility brings to an end a relatively stable period for the ratio, which spanned the last few months. Using the Average True Range to gauge volatility over the past 8 years, when the ratio moves from relative stability below 0.1 (some might argue complacency) to heightened volatility above 0.12, equity market weakness has typically followed. The Average True Range of the put-call ratio recently hit the lowest level since August of 2000, at the peak of the the tech bubble; declines in equity markets spanned more than two years that followed.
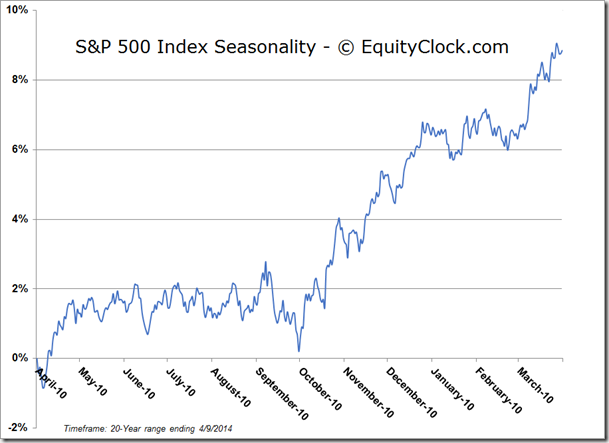
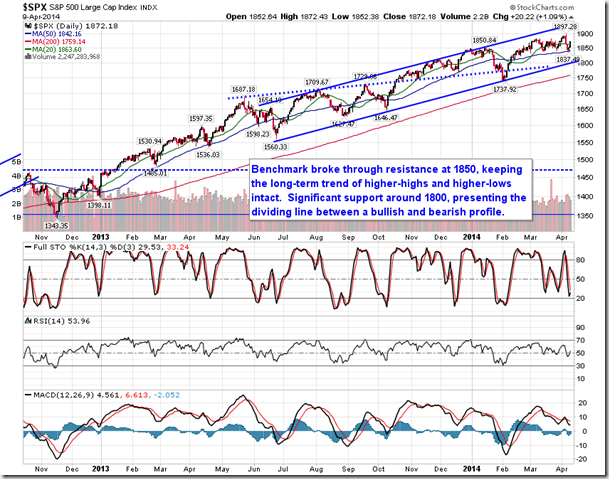
S&P 500 Index
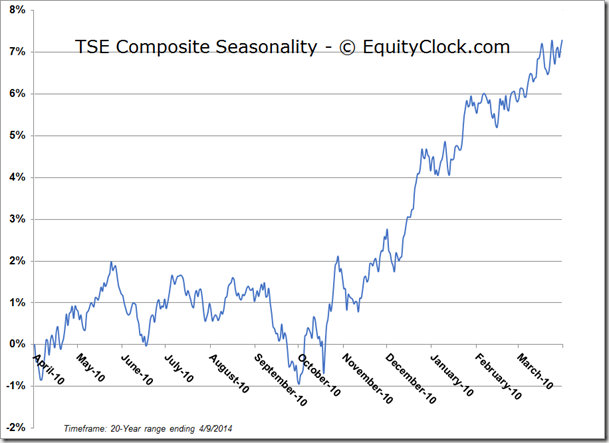
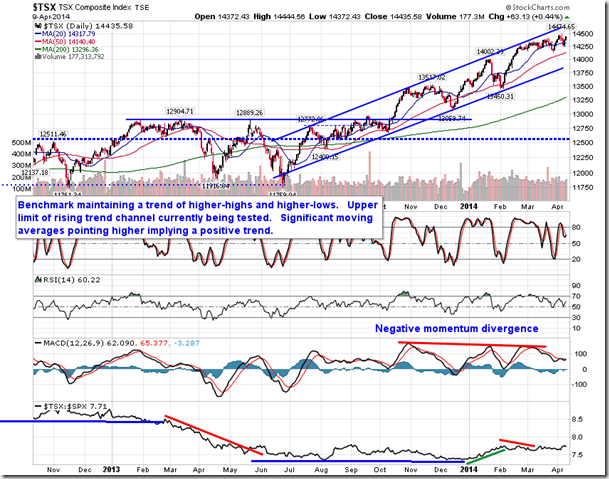
TSE Composite
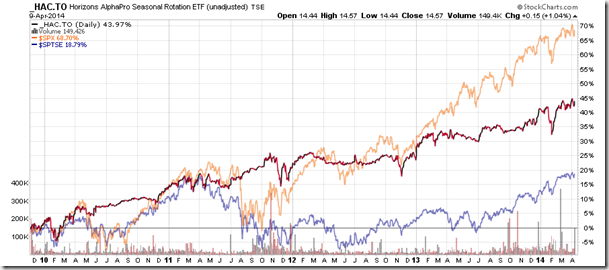
Horizons Seasonal Rotation ETF (HAC.TO)
- Closing Market Value: $14.57 (up 1.04%)
- Closing NAV/Unit: $14.55 (up 0.94%)
Performance*
| 2014 Year-to-Date | Since Inception (Nov 19, 2009) | |
| HAC.TO | 1.75% | 45.5% |
* performance calculated on Closing NAV/Unit as provided by custodian

