Upcoming US Events for Today:
- Durable Goods Orders for August will be released at 8:30am. The market expects a month-over-month decline of 0.5% versus a decline of 7.3% previous Excluding Transportation, Orders are expected to increase by 1.0% versus a decline of 0.6% previous.
- New Home Sales for August will be released at 10:00am. The market expects 425K versus 394K previous.
- Weekly Crude inventories will be released at 10:30am.
Upcoming International Events for Today:
- German Consumer Confidence Survey for October will be released at 2:00am EST. The market expects 7 versus 6.9 previous.

The Markets
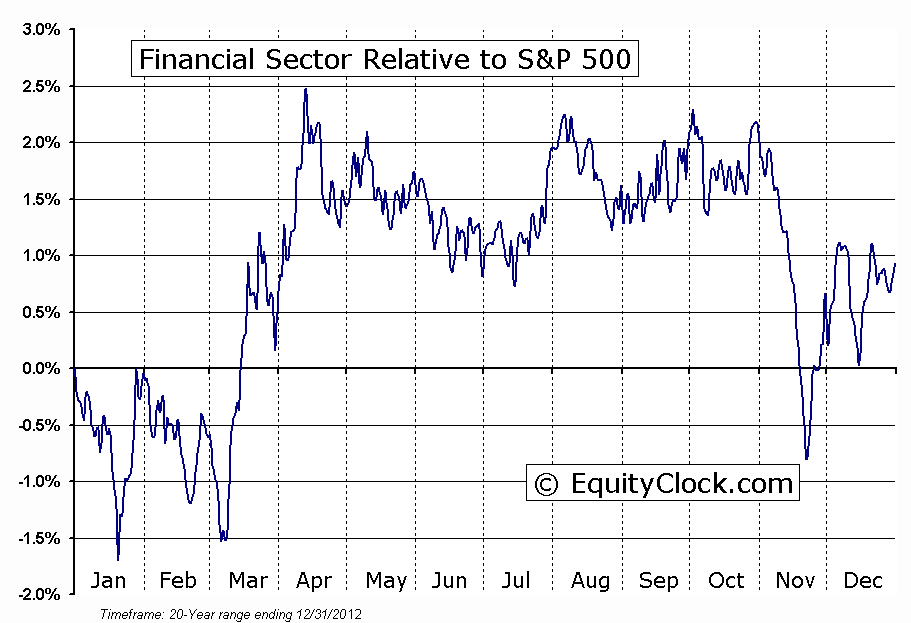
Stocks sold off for a fourth day, unbelievably matching the worst number of consecutive down days this year; one more day would make it the longest consecutive daily decline of the year. The budget impasse and debt ceiling debate continue to hold back market momentum as investors take advantage of the all-time highs to book profits. Cyclicals continue to dominate equity performance, particularly industrials and discretionary, as investors remain “risk-on” despite the broad market weakness that has become apparent over recent days. The exception to the strong cyclical performance is the financial sector, which has significantly underperformed the market since the start of August. Poor performance amongst financials can often weigh on broad market benchmarks. The Financial Sector ETF (XLF) is presently suggesting a lower intermediate high, implying a break of the positive trend that has benefitted the sector since last November. Relative performance of the sector seasonally weakens through to November, the weakest month of the year for Financials.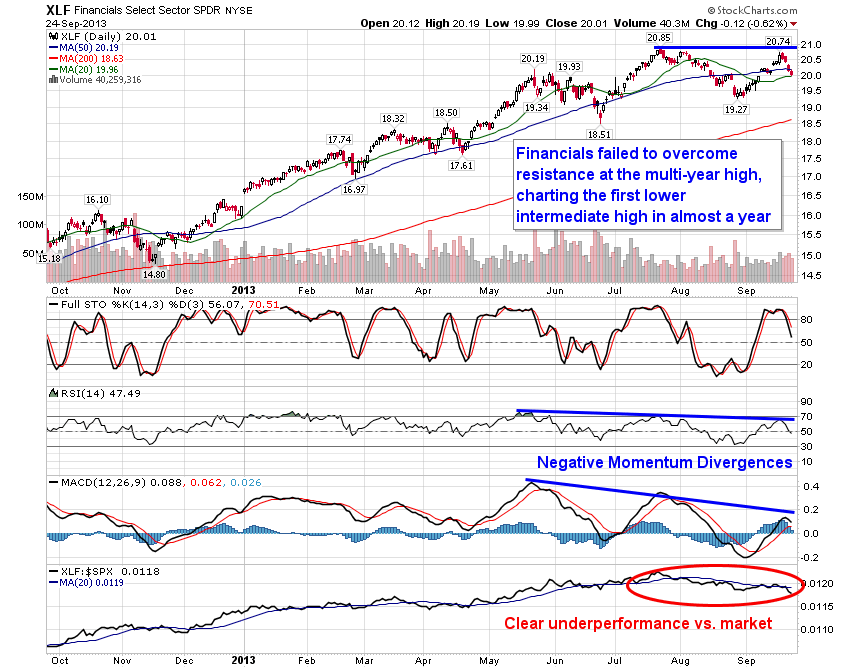
With another day of moderate declines for the S&P 500, the short-term technical picture continues to suggest struggle. Momentum indicators continue to roll over, triggering sell signals. A possible bearish setup presented by a rising wedge could fuel the selloff should the large-cap index break below 1650. Stay tuned!
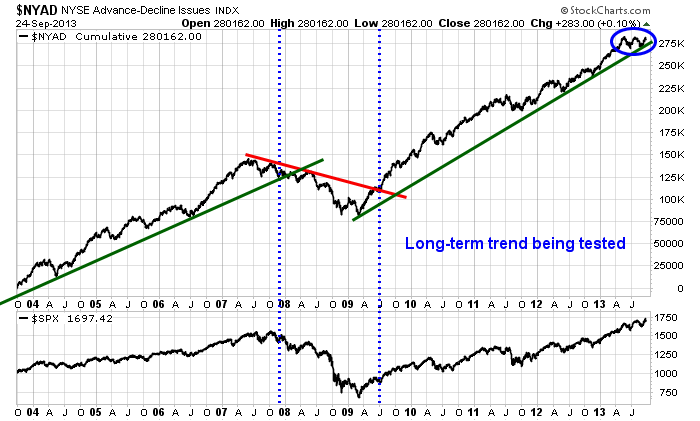
One technical indicator that continues to suggest intermediate-term caution is the NYSE Cumulative Advance-Decline line, which has notably stalled since a peak in May; a triple-top is apparent. This technical indicator is often seen as a leading indicator to changes in trend in the equity market as broad market strength comes into question. The indicator is testing the long-term positive trend line that stretches off of the March 2009 low; a break of the long-term trend could imply serious downside risks to the market ahead. Caution in equity markets is warranted until the recent range is broken to the upside.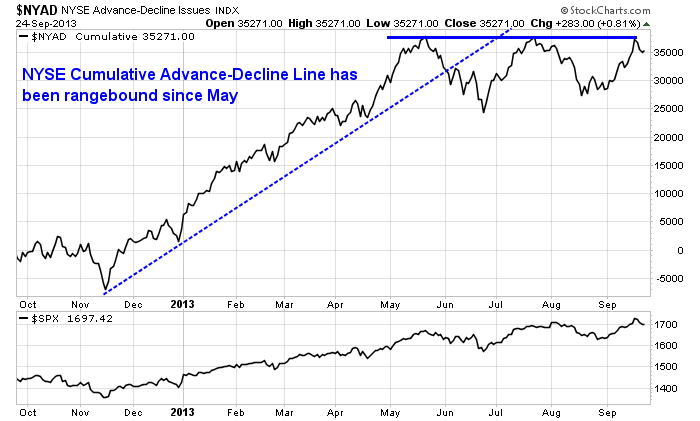
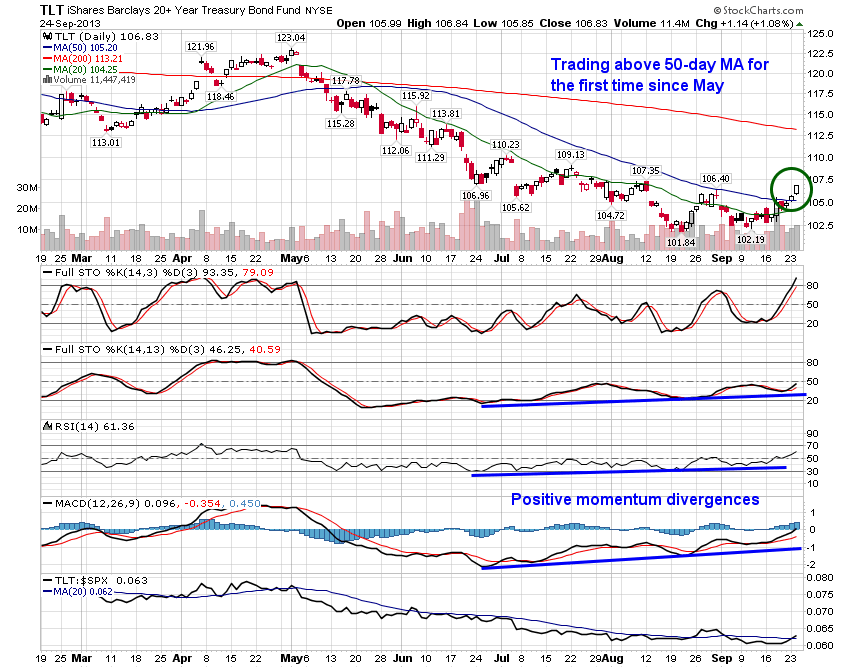
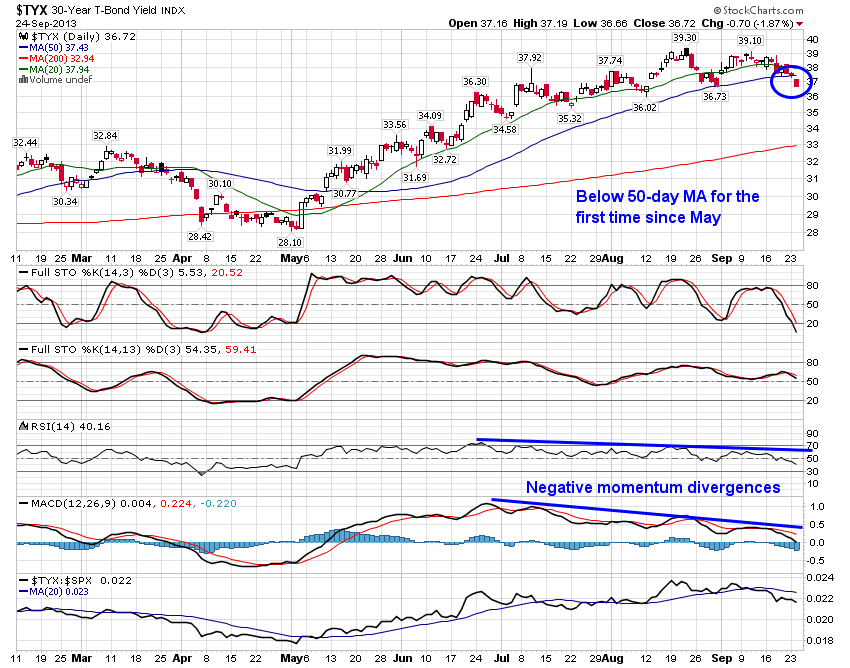
One of the few trades that is carrying through with gains following the Fed "no taper" shock is in the bond market. Bond prices across the various maturities broke firmly above their respective 50-day moving averages on Tuesday; treasury yields are below their 50-day moving averages for the first time since May. Negative momentum divergences on both the 10 and 30-year treasury note yield suggested fading upside pressures leading into this move. The intermediate trend of the yield on the 10-year note is showing signs of changing direction, almost precisely at the long-term declining trend line that has resulted in the bull market for bonds over the past 6 years. It is likely that the long-term negative trend will not be sustained given the prospects of Fed tapering ahead, but bond investors may be unwilling to let the bull market fade without a fight. Bonds remain in a period of seasonal strength through the end of the year.
Treasury Prices: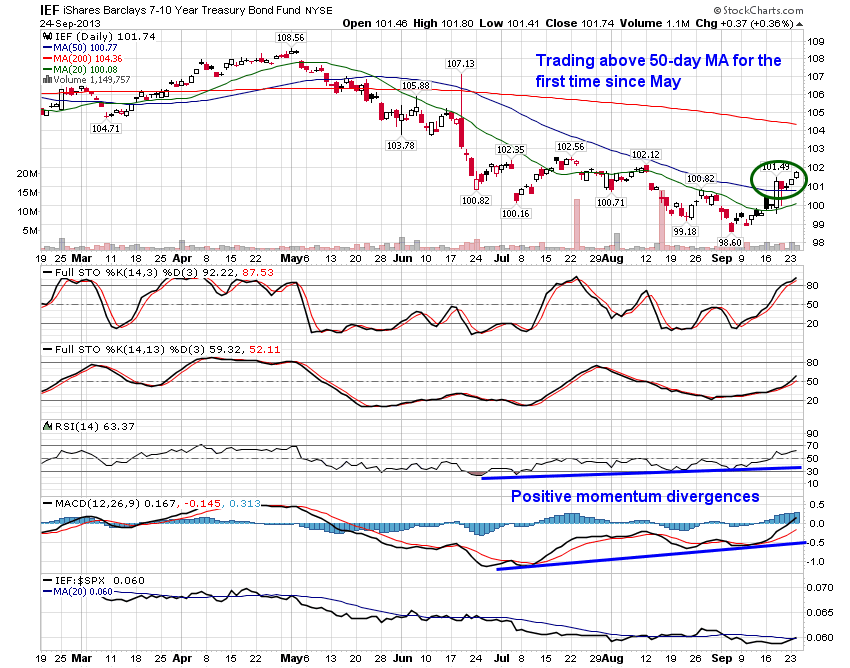
Treasury Yields: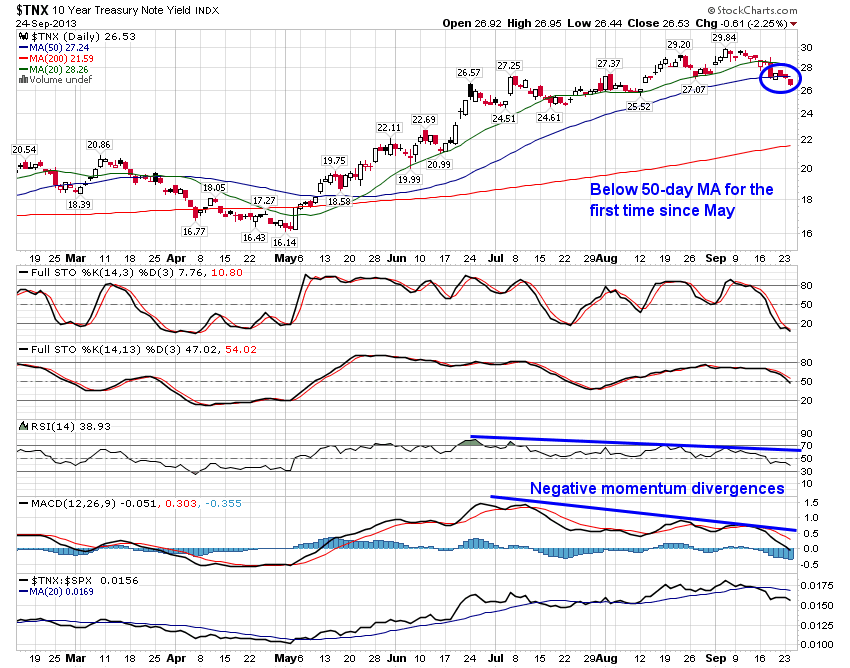
Long-Term View of Treasury Yields: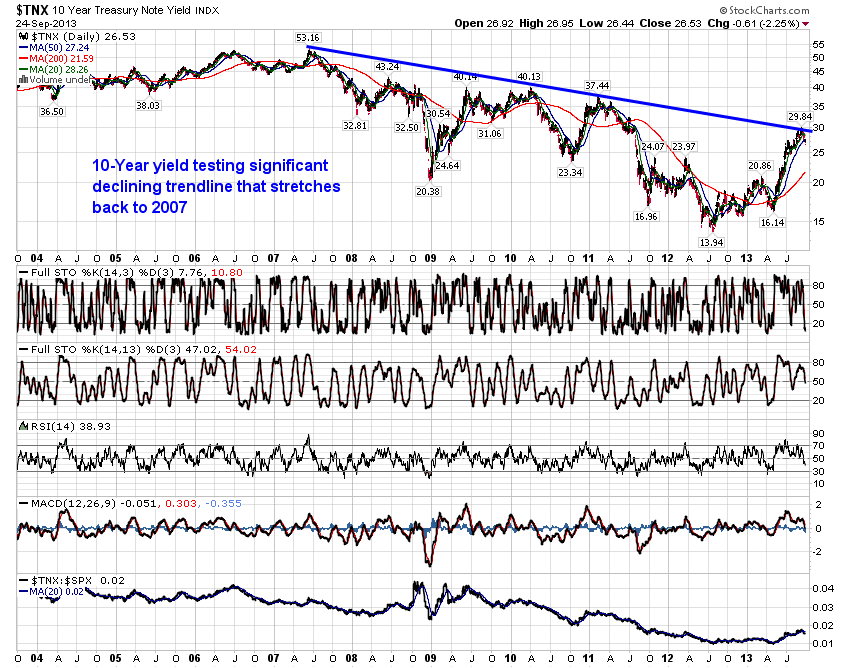
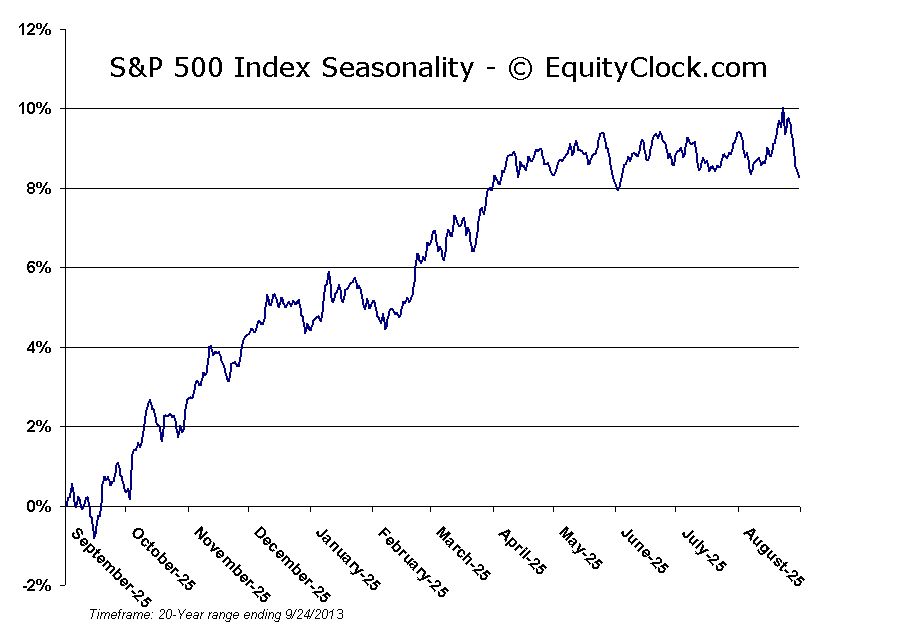
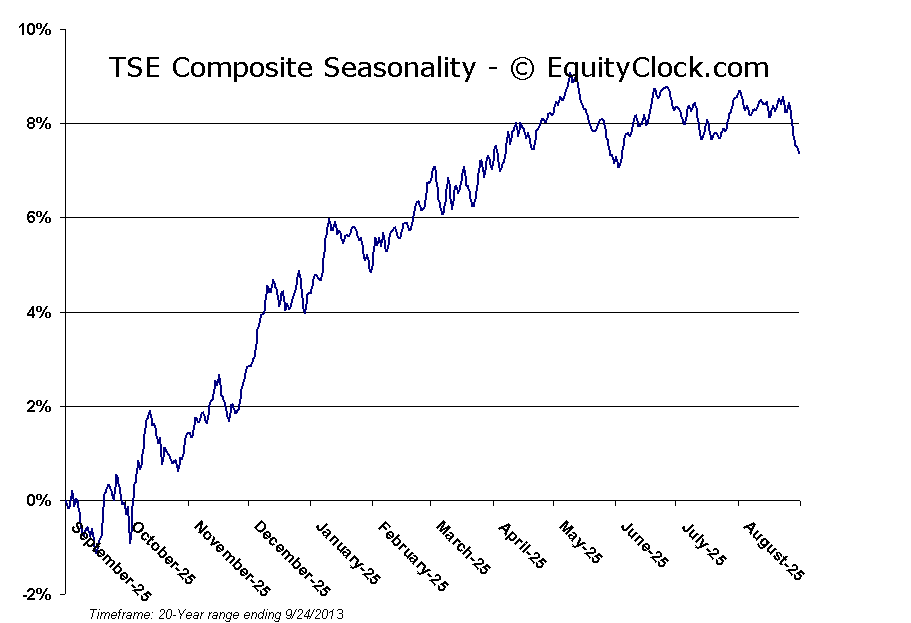
Seasonal profile: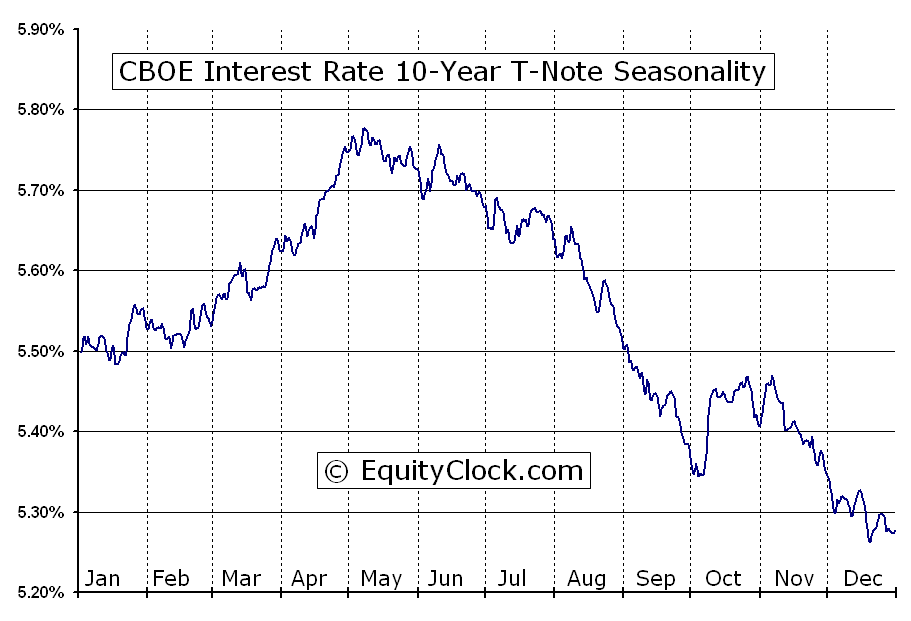
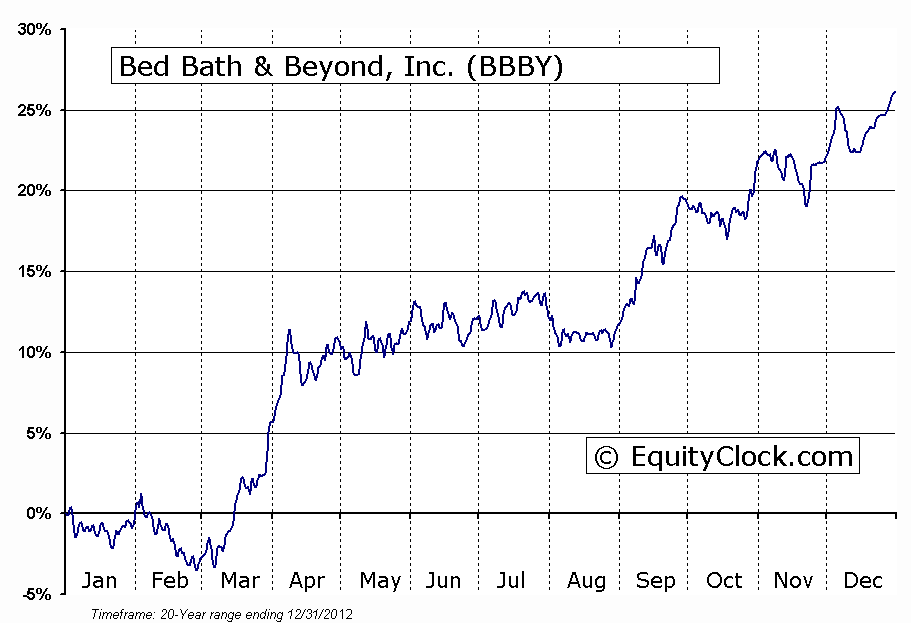
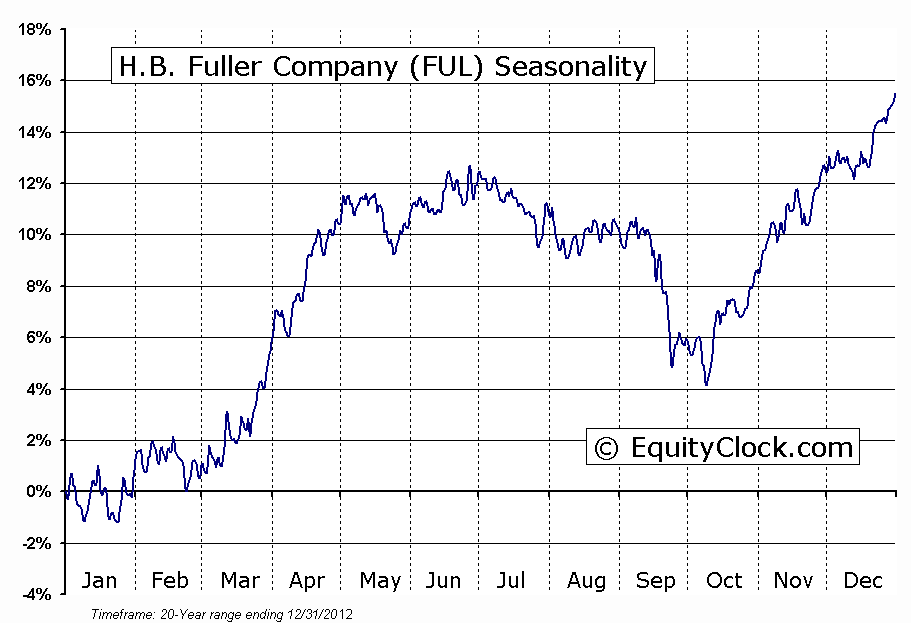
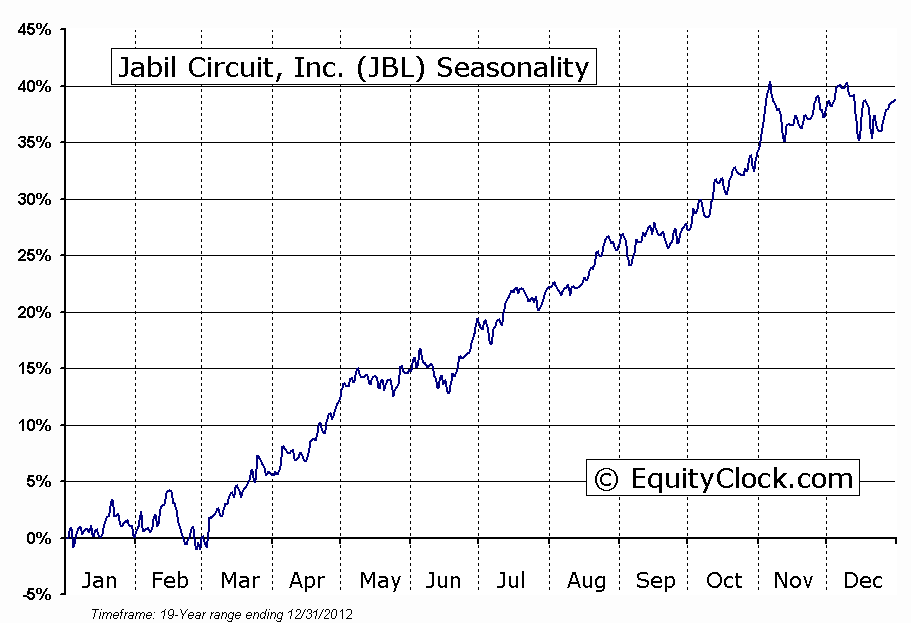
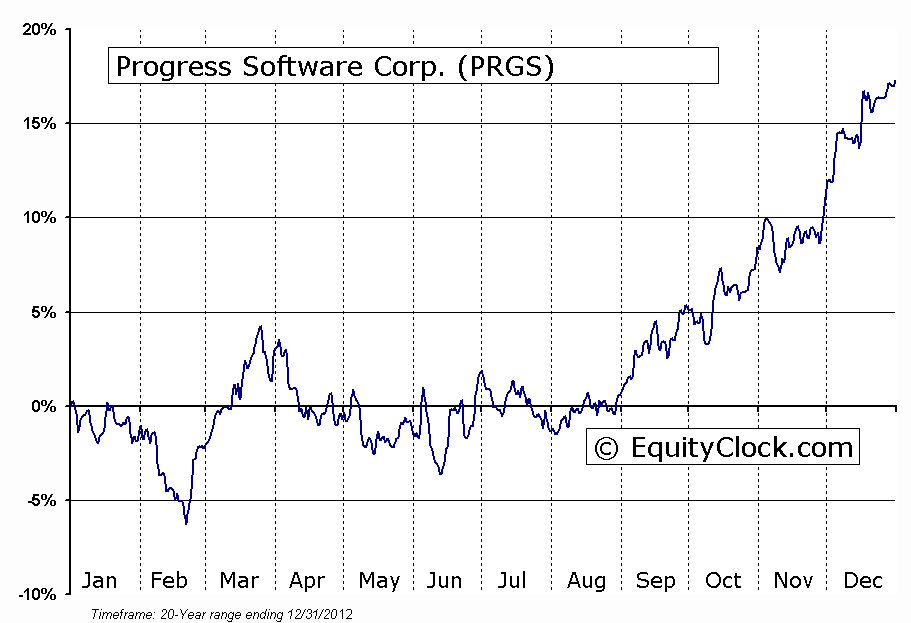
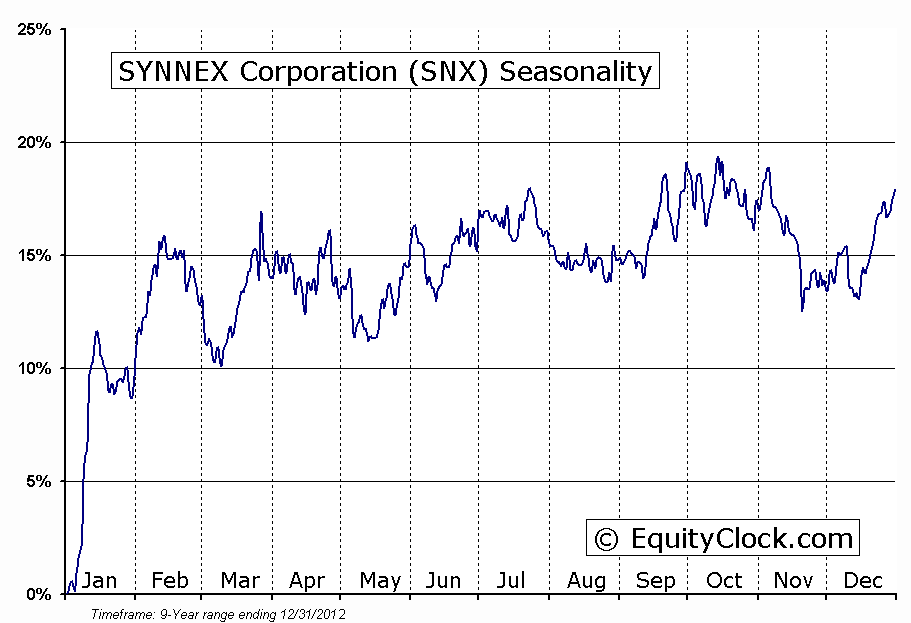
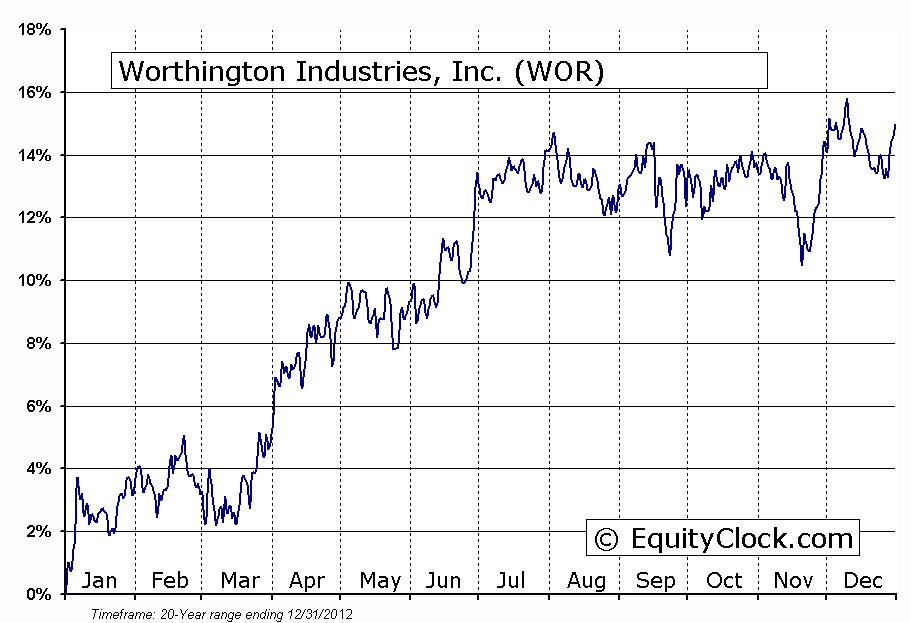
Seasonal charts of companies reporting earnings today: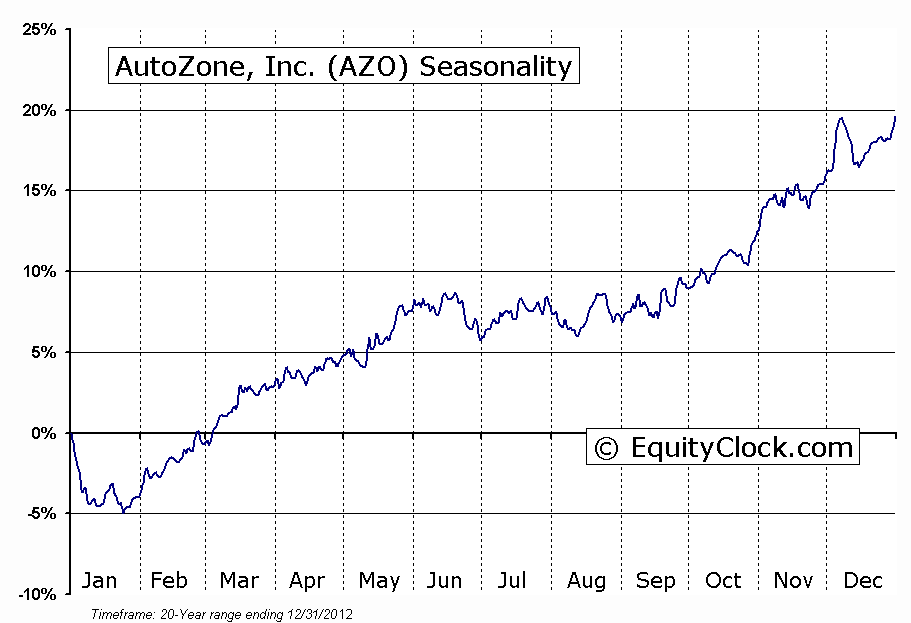
S&P 500 Index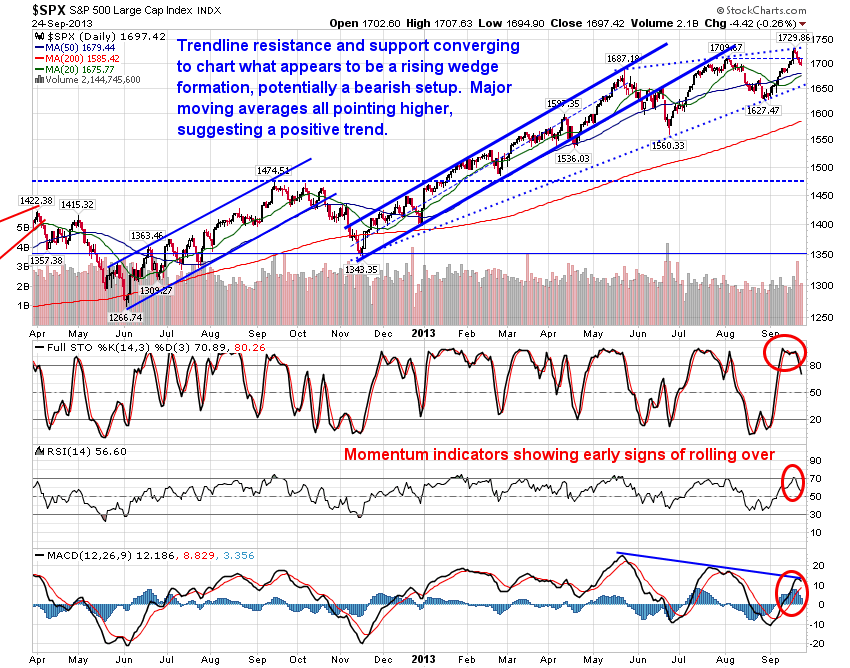
TSE Composite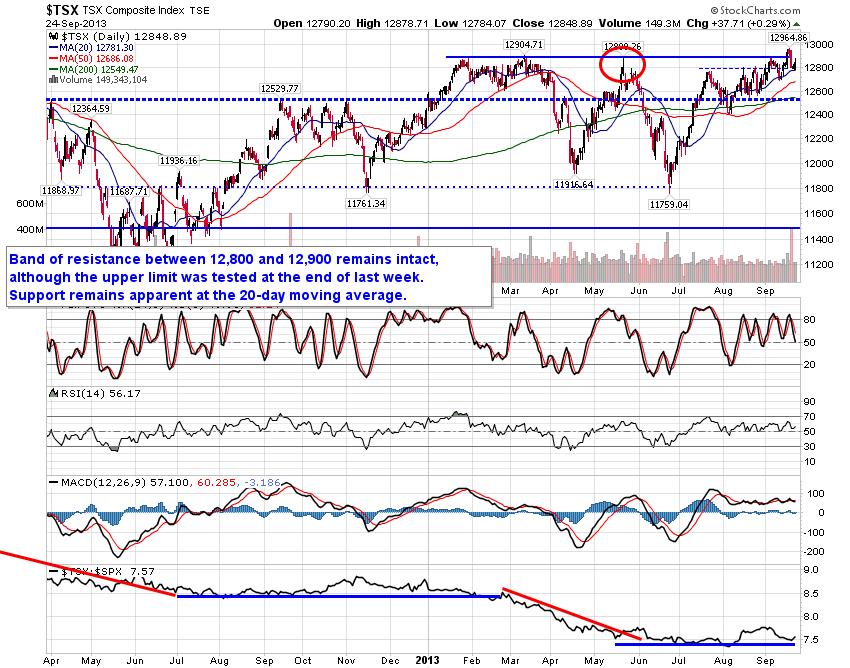
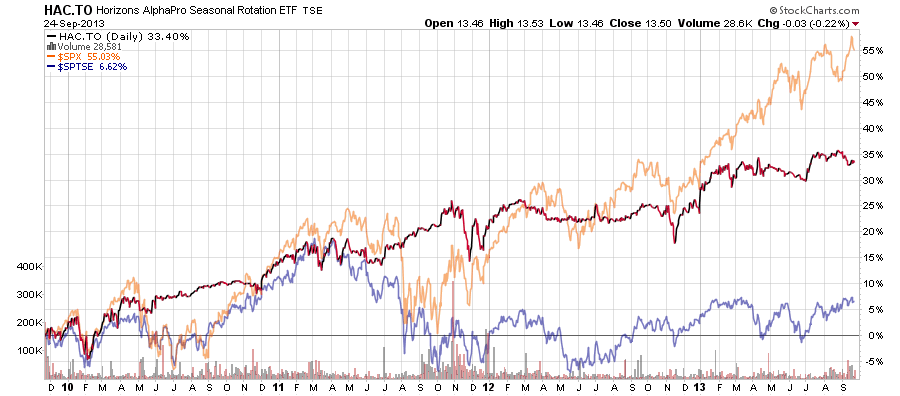
Horizons Seasonal Rotation ETF (TSX:HAC)
- Closing Market Value: $13.50 (down 0.22%)
- Closing NAV/Unit: $13.49 (unchanged)
Performance*
* performance calculated on Closing NAV/Unit as provided by custodian
Click Here to learn more about the proprietary, seasonal rotation investment strategy developed by research analysts Don Vialoux, Brooke Thackray, and Jon Vialoux.